


变量的作用域和生存期:
In the previous article, I have described the Kaplan-Meier estimator. To give a quick recap, it is a non-parametric method to approximating the true survival function. This time, I will focus on another approach to visualizing a survival dataset — using the hazard function and the Nelson-Aalen estimator. Once again, we will use the convenience of the lifetimes library to quickly create the plots in Python.
在上一篇文章中 ,我描述了Kaplan-Meier估计器。 快速回顾一下,这是一种逼近真实生存函数的非参数方法。 这次,我将重点介绍另一种可视化生存数据集的方法-使用危害函数和Nelson-Aalen估计量。 再次,我们将使用lifetimes库的便利性在Python中快速创建绘图。
1. Nelson-Aalen估计量 (1. The Nelson-Aalen estimator)
With the Kaplan-Meier curves, we approximated the survival function, stating the probability of the event of interest (for example, the death event) not occurring by a certain time t.
使用Kaplan-Meier曲线,我们近似了生存函数,指出了在特定时间t内未发生关注事件(例如,死亡事件)的概率。
An alternative approach to visualizing the aggregate information from a survival-focused dataset entails using the hazard function, which can be interpreted as the probability of the subject experiencing the event of interest within a small interval of time, assuming that the subject has survived up until the beginning of the said interval. For a more detailed description of the hazard function, please see this article.
可视化以生存为重点的数据集中的汇总信息的另一种方法是使用危险函数 ,该函数可以解释为受试者在短时间内间隔内经历感兴趣事件的概率,前提是受试者可以存活到所说间隔的开始。 有关危害功能的更详细说明,请参见本文 。
Unfortunately, we cannot transform the Kaplan-Meier estimate of the survival function to the hazard function. However, we can use another non-parametric estimator of the cumulative hazard function — the Nelson-Aalen estimator. In short, it is used to estimate the cumulative number of expected events within a certain period of time. And the reason why it is cumulative is that the sum of estimates is much more stable than the point-wise estimates.
不幸的是,我们无法将生存函数的Kaplan-Meier估计转换为危险函数。 但是,我们可以使用累积危害函数的另一个非参数估计量-Nelson-Aalen估计量。 简而言之,它用于估计特定时间段内预期事件的累积数量。 而且之所以具有累加性,是因为估算总和比逐点估算稳定得多。
The Nelson-Aalen estimator can be calculated as:
Nelson-Aalen估计量可以计算为:

where d_i stands for the number of events of interest at time t, while n_i is the number of observations at risk. All these terms are naturally similar to the ones in the Kaplan-Meier estimator’s formula.
其中d_i代表在时间t处感兴趣事件的数量,而n_i是处于风险中的观测值的数量。 所有这些术语自然都与Kaplan-Meier估计器的公式相似。
The Nelson-Aalen estimator, or more generally visualizing the hazard function over time, is not a very popular approach to survival analysis. That is because — in comparison to the survival function — explanation of the curves is not so simple and intuitive. However, the hazard function is of great importance for more advanced approaches to survival analysis, for example, the Cox regression. That is why it is important to understand the concept and I will try to provide some insights about it. We can say that the cumulative hazard function:
Nelson-Aalen估计器,或更一般地说是随着时间的推移可视化危害函数,并不是一种很流行的生存分析方法。 这是因为与生存函数相比,曲线的解释不是那么简单直观。 但是,危害函数对于更高级的生存分析方法(例如Cox回归)非常重要。 这就是为什么理解这个概念很重要的原因,我将尝试提供一些有关它的见解。 我们可以说累积危害函数为:
measures the total amount of risk that has been accumulated up to a certain point of time t.
衡量到某个时间点t之前已累计的风险总量。
provides the number of times we would mathematically expect the occurrence of the event of interest over a certain period if only the events were repeatable. This might be a bit confusing, so to make the statement a bit simpler (yet not that realistic) you can think of the cumulative hazard function as the expected number of deaths of an individual up to time t, if the individual could to be resurrected after each death without resetting the time. As I said, not that realistic, but this could be just as well applied to machine failures, etc.
提供了如果只有事件是可重复的,在数学上我们期望在特定时期内发生感兴趣事件的次数。 这可能有点令人困惑,因此,为了使该语句更简单(但不那么现实),您可以将累积危险函数视为直到t时一个人的预期死亡人数(如果该人可以复活)。每次死亡后无需重新设置时间。 就像我说的那样,这不现实,但这可以很好地应用于机器故障等。
The last concept that might be useful to get some intuition about the cumulative hazard function is the bathtub curve, or rather its components. The curve represents the life cycles of many electronic consumer products. The hazard rate of the bathtub curve is created by combining:
获得对累积危害函数的一些直觉可能有用的最后一个概念是浴盆曲线 ,或者更确切地说是其组成部分。 该曲线表示许多电子消费产品的生命周期。 通过组合以下内容来创建浴缸曲线的危险率:
- the rate of early “infant mortality” failures when the product is first introduced, 首次引入该产品时早期“婴儿死亡率”失败的比率,
- the rate of random failures with constant failure rate during the product’s designed life, 在产品的设计寿命中具有恒定故障率的随机故障率,
- the rate of “wear out” failures as the product exceeds its expected lifetime. 产品超过其预期使用寿命时的“磨损”故障率。
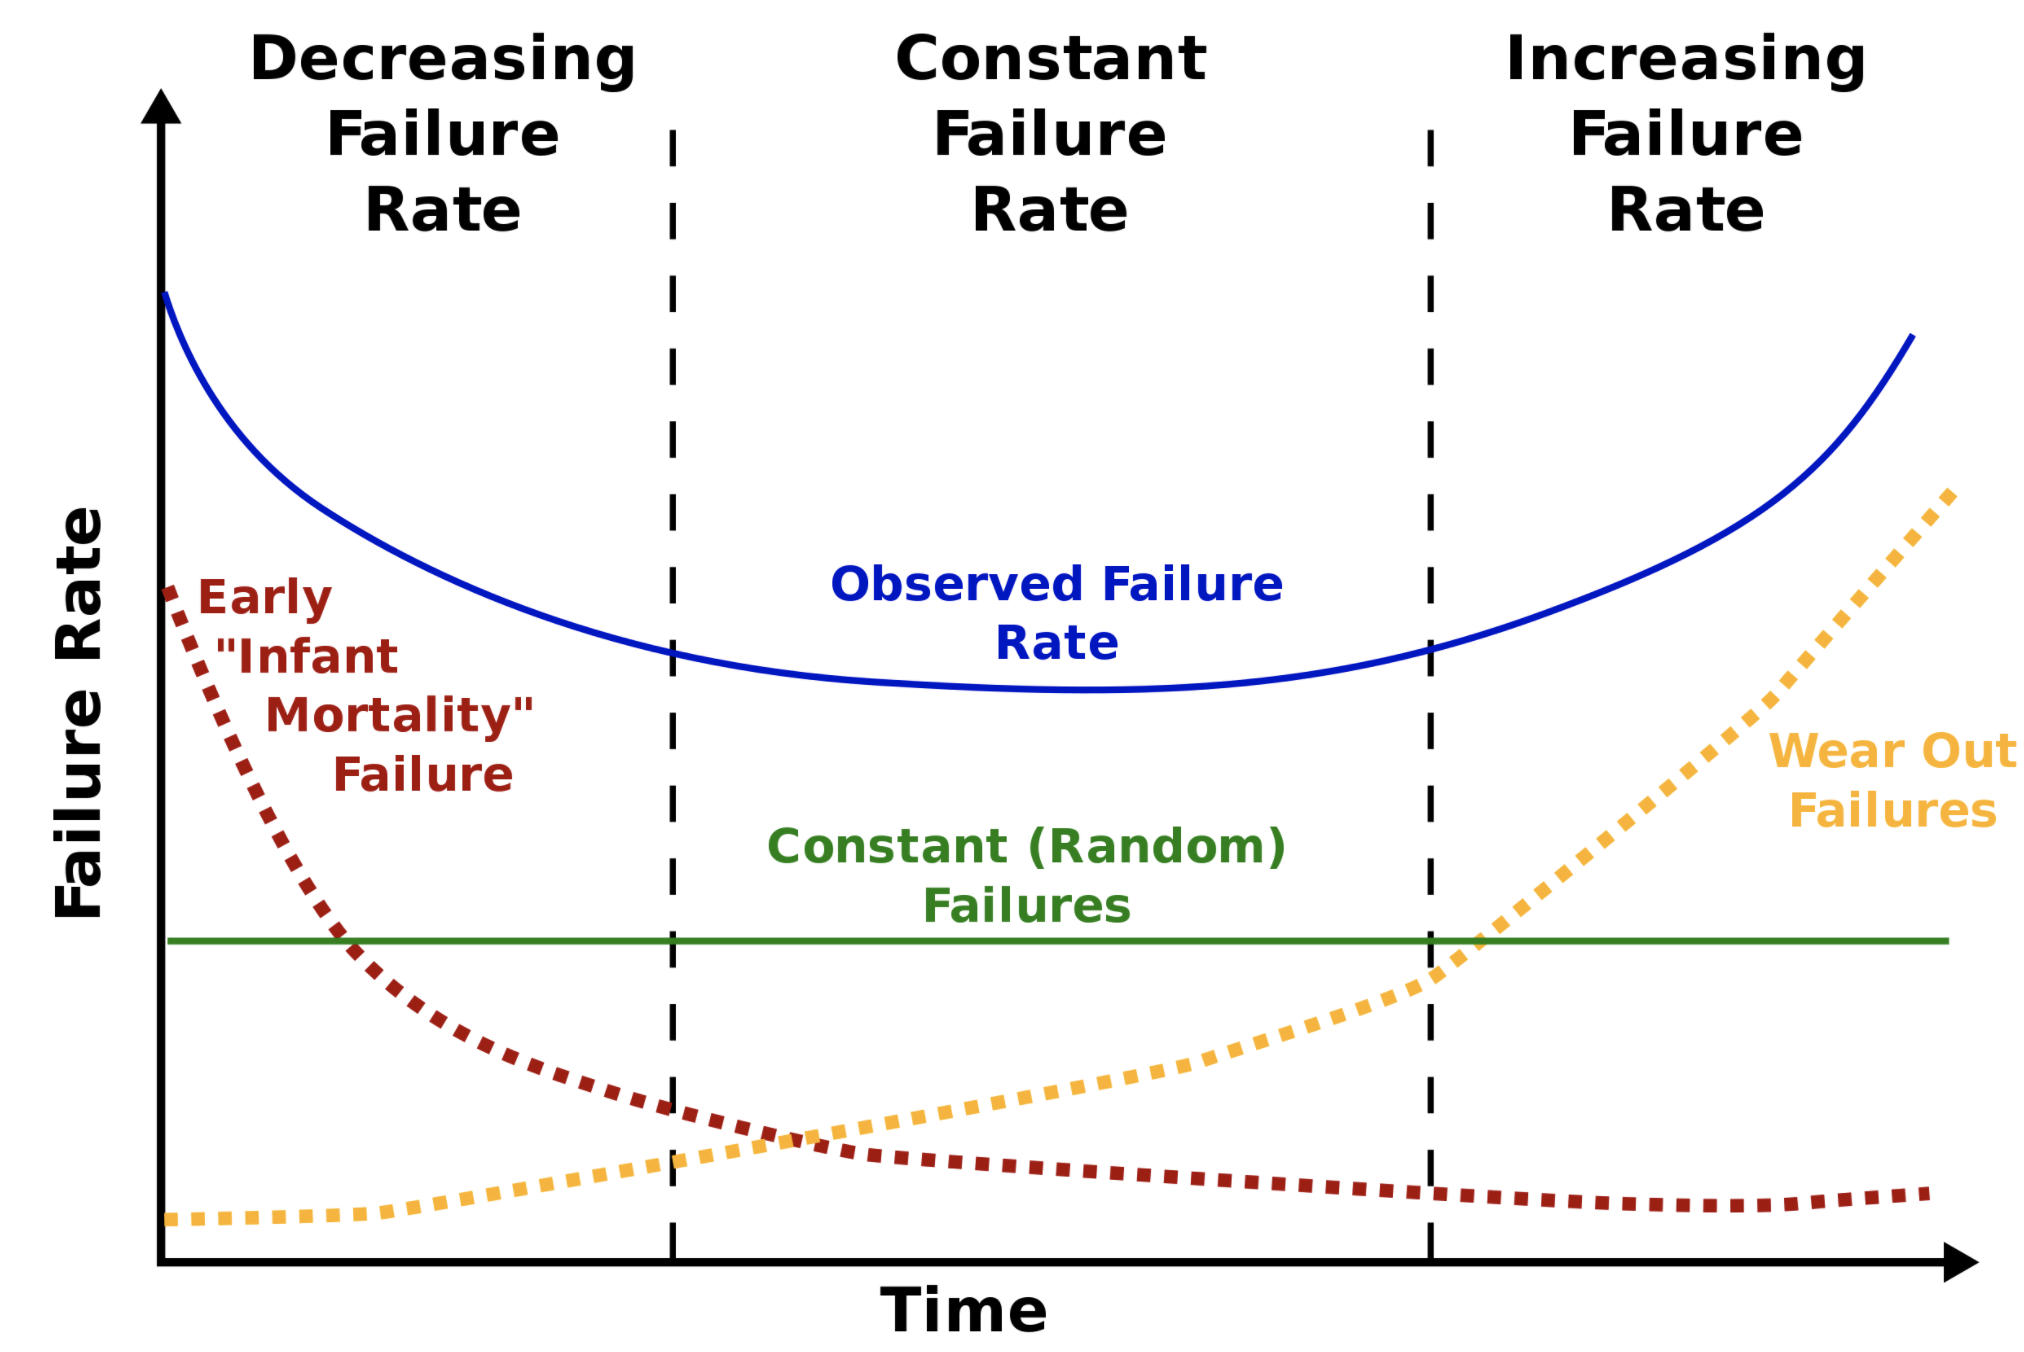
While the image above represents the hazard rate (not the cumulative one!), the shape of the Nelson–Aalen estimator’s curve gives us an idea of how the hazard rate changes over time.
虽然上面的图像代表了危险率(而不是累计危险率!),但尼尔森-阿伦估计量曲线的形状使我们了解了危险率如何随时间变化。
For example, the concave shape of the cumulative hazard function indicates that we are dealing with an “infant mortality” kind of event (dotted red line in the image), where the rate of failure is highest early on and decreases with time. On the other hand, the convex shape of the cumulative hazard function implies we are dealing with the “wear out” kind of event (dotted yellow line).
例如,累积危害函数的凹形表示我们正在处理“婴儿死亡”类事件(图像中的红色虚线),该事件的发生率在早期就最高,随着时间的推移而降低。 另一方面,累积危害函数的凸形意味着我们正在处理“磨损”事件(黄色虚线)。
I believe this is enough theory to understand the Nelson-Aalen estimator of the cumulative hazard function. It is time to code!
我相信这足以理解累积危险函数的Nelson-Aalen估计量。 是时候编写代码了!
2. Python示例 (2. Example in Python)
For consistency, we continue the example using the popular Telco Customer Churn dataset started in the previous article. For brevity’s sake, please refer to that article for a description of the dataset and the reasoning for the transformations applied to it. First, we load the required libraries.
为了保持一致性,我们使用上一篇文章中开始的流行的Telco客户流失数据集继续该示例。 为简便起见,请参考该文章以获取有关数据集的说明以及对其应用转换的原因。 首先,我们加载所需的库。
import pandas as pd
import matplotlib.pyplot as plt
import seaborn as sns


from lifelines import NelsonAalenFitter


plt.style.use('seaborn')
Then, we load the data:
然后,我们加载数据:
df = pd.read_csv('../data/telco_customer_churn.csv')
df['churn'] = [1 if x == 'Yes' else 0 for x in df['Churn']]
lifelines makes the process of calculating and plotting the Nelson-Aalen estimator very simple, we just need to run the following few lines of code to plot the cumulative hazard function.
lifelines使计算和绘制Nelson-Aalen估计量的过程非常简单,我们只需要运行以下几行代码来绘制累积危害函数。
T = df['tenure']
E = df['churn']


naf = NelsonAalenFitter()
naf.fit(T, event_observed=E)


naf.plot(at_risk_counts=True)
plt.title('Cumulative hazard function');
The code generates the following plot:
该代码生成以下图:
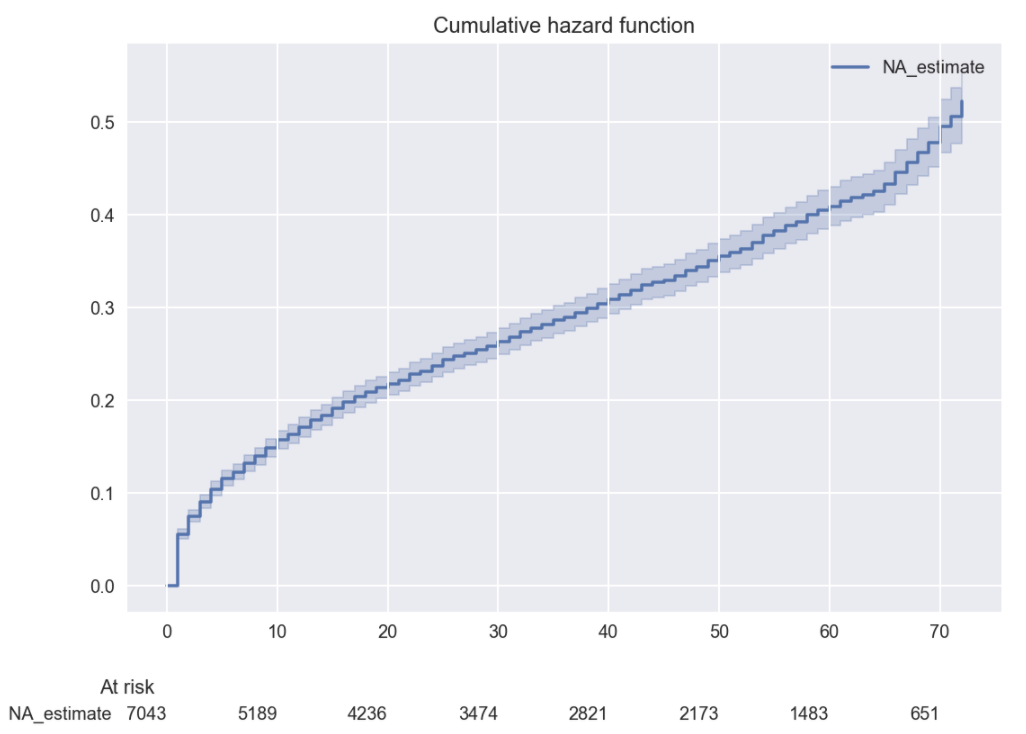
I would say that the shape of the cumulative hazard function based on the Nelson-Aalen’s estimator might indicate that we are dealing with the hazard function similar to the bathtub curve. The reason for this is that we see that both in the beginning and close to the end the rate of change is higher, while it more or less flattens out (stabilizes at a constant level) in the middle of the customers’ lifetime with the company.
我想说,基于Nelson-Aalen估计量的累积危害函数的形状可能表明我们正在处理类似于浴盆曲线的危害函数。 这样做的原因是,我们看到在开始和结束时变化率都较高,而在公司生命周期中,变化率或多或少趋于平稳(稳定在一个稳定的水平) 。
We can also easily access the cumulative hazard function by using the cumulative_hazard_ method of the fitted NelsonAalenFitter object.
我们还可以很容易地通过使用访问累积危险功能cumulative_hazard_拟合的方法NelsonAalenFitter对象。
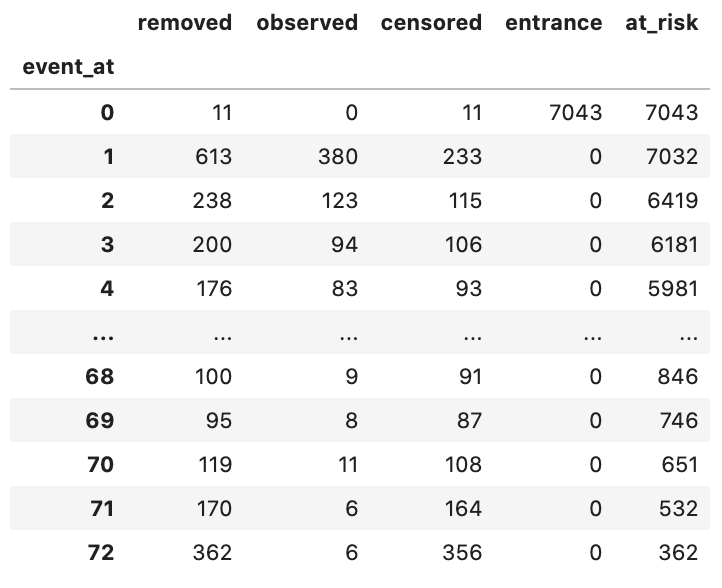
One more interesting functionality provided by the library is the events table, which summarizes what happened at each point of time. We can obtain it by running naf.event_table and the result looks as follows:
该库提供的另一个有趣的功能是事件表,该表汇总了每个时间点发生的情况。 我们可以通过运行naf.event_table获得它,结果如下所示:
Similarly to the Kaplan-Meier case, we will also plot the cumulative hazard function for each variant of the payment method. As lifelines provides a uniformed way of working with different tools used for survival analysis, the code requires only a few slight modifications.
与Kaplan-Meier情况类似,我们还将绘制每种付款方式的累积危害函数。 由于lifelines提供了与用于生存分析的不同工具一起使用的统一方式,因此该代码仅需进行少量修改。
ax = plt.subplot(111)


naf = NelsonAalenFitter()


for payment_method in df['PaymentMethod'].unique():

    flag = df['PaymentMethod'] == payment_method

    naf.fit(T[flag], event_observed=E[flag], label=payment_method)
    naf.plot(ax=ax)


plt.title('Cumulative hazard functions by payment method');
The shapes of the cumulative hazard functions are very similar for two automatic payment categories: bank transfer and credit card.
两种自动付款类别的累积危害函数的形状非常相似:银行转帐和信用卡。

Note: In the theoretical introduction, we mentioned that the reason for working with the cumulative hazard function instead of the hazard function is the higher accuracy of the former. However, lifelines provides a way of deriving the hazard function from the cumulative one by the means of applying a kernel smoother. So where is the catch? To do so, we need to specify the bandwidth parameter, and the shape of the resulting hazard function is highly dependent on the selected value. I will quote the author’s comment about this approach: “There is no obvious way to choose a bandwidth, and different bandwidths produce different inferences, so it’s best to be very careful here. My advice: stick with the cumulative hazard function.”. In case you are still interested, please check out the documentation.
注意 :在理论介绍中,我们提到使用累积危害函数而不是危害函数的原因是前者的准确性较高。 但是, lifelines提供了一种通过应用核平滑器来从累积函数推导危害函数的方法。 那么渔获量在哪里? 为此,我们需要指定带宽参数,并且所产生的危害函数的形状高度依赖于所选值。 我将引用作者对此方法的评论:“ 没有明显的方法来选择带宽,并且不同的带宽会产生不同的推论,因此最好在这里非常小心。 我的建议:坚持累积危害功能。” 如果您仍然有兴趣,请查阅文档 。
3.结论 (3. Conclusions)
In this article, I tried to provide an introduction to estimating the cumulative hazard function and some intuition about the interpretation of the results. While the Nelson-Aalen estimator is far less popular than the Kaplan-Meier survival curves, understanding it might be very helpful while working with more advanced methods of survival analysis, such as the Cox regression.
在本文中,我试图提供一个估计累积危害函数的介绍,以及对结果解释的一些直觉。 尽管Nelson-Aalen估算器不如Kaplan-Meier生存曲线流行,但了解它在使用更高级的生存分析方法(例如Cox回归)时可能会很有帮助。
You can find the code used for this article on my GitHub. As always, any constructive feedback is welcome. You can reach out to me on Twitter or in the comments.
您可以在我的GitHub上找到用于本文的代码。 一如既往,欢迎任何建设性的反馈。 您可以在Twitter或评论中与我联系。
In case you found this article interesting, you might also like the other ones in the series:
如果您发现本文有趣,您可能还会喜欢本系列中的其他文章:
4.参考 (4. References)
变量的作用域和生存期:


 2410
2410

 被折叠的 条评论
为什么被折叠?
被折叠的 条评论
为什么被折叠?
 到【灌水乐园】发言


