


 本文探讨了在训练数据中由于样本不足导致的偏差问题,揭示了这种偏差如何影响模型的准确性和泛化能力。通过翻译自的数据科学文章,深入理解训练数据不足如何产生意外偏差。
训练样本越少,偏差
Almost every week, the press highlights examples of machine learning models with biased outputs. With discrimination at the forefront of public discussion, how is social inequality reflected in the biased outputs of ML models? Decisions made at every step of a typical data science pipeline, from formulating questions to collecting data and training and deploying models can ultimately harm downstream users¹. Our goal is to achieve a practical understanding of how different sources of bias can be reflected in the data. To achieve this aim, we’ll build examples using synthetic data to illustrate how different sources of bias impact ML outputs and their underlying characteristics. The guiding principle is that a good way to understand something is to build it yourself!
几乎每周,新闻界都会重点介绍具有偏向输出的机器学习模型的示例。 随着歧视成为公众讨论的重头戏,社会不平等如何反映在机器学习模型有偏见的输出中? 从提出问题到收集数据以及培训和部署模型,在典型数据科学流程的每个步骤中做出的决定最终都会损害下游用户¹。 我们的目标是实际了解如何在数据中反映出不同的偏见来源。 为了实现这一目标,我们将使用综合数据构建示例,以说明不同的偏差源如何影响ML输出及其基本特征。 指导原则是,了解事物的好方法是自己构建事物!
We’ll think about biased datasets in the context of classification, the task of predicting a binary target outcome (the label): “Will the credit card offer be accepted or rejected?”, “Will the applicant pay back the loan or not?”. A predictive model uses the features of a particular application (what the bank knows about the applicant) to predict the associated label. The workflow for building predictive models is to put together a dataset with features that may be relevant to the predicted label and train a model that predicts with the highest accuracy the label on the training dataset.
我们将在分类的背景下考虑偏向数据集,即预测二进制目标结果(标签)的任务:“接受或拒绝信用卡要约吗?”,“申请人是否还贷? ”。 预测模型使用特定应用程序的特征(银行对申请人的了解)来预测相关标签。 建立预测模型的工作流程是将具有可能与预测标签相关的特征的数据集放在一起,并训练一个模型,该模型以最高准确度预测训练数据集上的标签。
For many data scientists, the goal when doing predictive modelling is to train a model of tolerable complexity that is sufficiently accurate at predicting the label. In recent years, many pointed out that this approach of optimizing model accuracy obfuscates the goal of building fair, equitable models for all users. There are many examples of models that are accurate but nevertheless lead to very harmful outcomes, especially against protected characteristics (for example, age or race) that have historically faced discrimination: from HR applications that invariably predict male applicants are more qualified for the job², to bail models that predict black persons are more likely to re-offend³, to health insurance models that recommend less sick white people compared to more sick black people for preventative care⁴. The law in many countries defines a person’s protected attributes as race, gender, age, sexual orientation, physical or mental disability, and marital status⁵ ⁶ . Discrimination appears between privileged (e.g., men) and unprivileged (e.g., women or LGBTQ) groups across a protected attribute (sexual orientation). It is important to also evaluate outcomes for groups at the intersection of several protected attributes, such as black LGBTQ individuals vs white men.
对于许多数据科学家而言,进行预测建模时的目标是训练一个可以在预测标签时足够准确的可容忍复杂性模型。 近年来,许多人指出,这种优化模型准确性的方法模糊了为所有用户建立公平,公正的模型的目标。 有许多准确的模型示例,但是仍然会导致非常有害的结果,尤其是针对历史上一直面临歧视的受保护特征(例如年龄或种族):从人力资源应用中,总是可以预测男性应聘者更适合这份工作²,保释能预测黑人更有可能再次犯罪的保释模型³,以及建议生病的白人比生病的黑人进行预防性护理的健康保险模型⁴。 许多国家/地区的法律将人的受保护属性定义为种族,性别,年龄,性取向,身体或精神残疾以及婚姻状况⁵。 在受保护的属性(性取向)上,特权(例如男人)和非特权(例如女人或LGBTQ)群体之间会出现歧视。 同样重要的是,还要评估处于多个受保护属性交集的组的结果,例如黑人LGBTQ个人与白人。
我们如何判断模型是否存在意料之外的偏差? (How can we tell if a model has unintended bias?)
Exploratory data analysis (EDA) and fairness metrics are important tools. EDA can warn us if there is a large disparity in the proportion of labels for a group (for example, only 10% of the positive labels are females), and motivate further investigations. Fairness metrics⁷ ⁹ allow us to set a desirable output for the model and check whether this output is achieved across groups. One word of caution worth noting here, fairness metrics cannot all be satisfied simultaneously⁷. We’ll use two commonly employed fairness metrics: demographic parity and equal opportunity. Demographic parity asks that assigned labels are independent of group membership. The metric is computed as the ratio of the labels for the unprivileged and privileged groups. Demographic parity is 1 when the probability is independent of group membership; a ratio of 0.8 is reasonable based on the generalization of the 80 percent rule advocated by US EEOC⁸, and smaller numbers are indicative of bias. The equal opportunity metric highlights the fact that a positive label is often a desirable outcome (“an opportunity” such as “the mortgage loan is approved”) and thus focuses on comparing the True Positive Rate (TPR) across groups: the rate at which positive labels are predicted correctly as positive. The TPR metric has the added benefit of accommodating different baseline rates for the compared groups, as it asks what percentage of the expected number of positive labels have been found.
探索性数据分析(EDA)和公平性指标是重要的工具。 如果某个组的标签比例差异很大(例如,阳性标签中只有10%是女性),那么EDA可以警告我们,并鼓励进行进一步的研究。 公平度量⁷允许我们为模型设置理想的输出,并检查是否在各个组之间实现了该输出。 值得一提的是,公平指标不能同时满足all。 我们将使用两个常用的公平性指标:人口均等和机会均等。 人口统计奇偶要求分配的标签与组成员身份无关。 度量标准计算为非特权和特权组的标签比率。 如果概率独立于组成员身份,则人口统计均等值为1;否则, 根据美国EEOC⁸倡导的80%规则的一般化,比率为0.8是合理的,而较小的数字表示偏差。 机会均等指标强调了一个事实,即积极的标签通常是理想的结果(“机会”,例如“抵押贷款得到批准”),因此着重于比较各组之间的真实正利率(TPR):阳性标签正确地预测为阳性。 TPR指标的另一个好处是,可以为被比较的人群提供不同的基准率,因为它询问已发现阳性标记的预期数量的百分比。
Consider the following example of male and female applicants evaluated for a loan application. Persons in green are approved, while those in red are rejected.
考虑以下示例,其中男性和女性申请人经过贷款申请评估。 绿色的人被批准,红色的人被拒绝。

Calculating the Demographic Parity (DP) metric for the predicted labels:
计算预测标签的人口统计奇偶性(DP)指标:
DP male = 4 / 6
DP公头= 4/6
DP female = 2 / 4
DP女= 2/4
True Positive Rate (TPR) metric:
真实正利率(TPR)指标:
TPR male = 3 / (3 + 1) = 3 / 4, that is, 3 x True Positive and 1 x False Negative
TPR男性= 3 /(3 +1)= 3/4,即3 x真阳性和1 x假阴性
TPR female = 1 / (1 + 1) = 1 / 2, whereas, 1 x True Positive and 1 x False Negative
女性TPR = 1 /(1 + 1)= 1/2,而1 x真阳性和1 x假阴性
偏见的常见原因是什么? (What are common sources of bias?)
The five we’ll dig into (based on⁹) are:
我们将基于(⁹)挖掘的五个是:
- Proxies 代理人
- Limited features 功能有限
- Skewed sample 倾斜的样本
- Tainted examples 受污的例子
- Sample size disparities 样本数量差异
Our starting point is a simple scenario. Imagine an HR company that is trying to predict an applicant’s salary when considering what offer to extend them. The company has collected around 100k data points. For each applicant, the company knows their previous job type (backend or frontend developer), years of work experience, gender, extra certifications and salary, which they threshold for simplicity to under or over 52k. We built this dataset using a simple linear regression model:
我们的出发点是一个简单的场景。 想象一下,一家人力资源公司在考虑提供什么扩展薪水时试图预测申请人的薪水。 该公司已经收集了大约10万个数据点。 对于每位申请者,公司都知道他们以前的工作类型(后端或前端开发人员),多年的工作经验,性别,额外的证书和薪水,为简化起见,这些门槛必须低于或低于52k。 我们使用简单的线性回归模型构建了该数据集:
Salary = c_exp * Years_experience + c_job * Job + c_cert * Cert + c_noise * Noise
薪水= c_exp *年经验+ c_job *工作+ c_cert *证书+ c_noise *噪声
Where c_exp, c_job, c_cert, c_noise are coefficients that determine the effect of each variable on the outcome Salary
其中c_exp , c_job , c_cert , c_noise是确定每个变量对结果薪资的影响的系数
Years_experience: applicants’ number of years of work experience
Years_experience :申请人的工作年限
Cert: binary feature encoding whether applicants have extra certifications
证书 :二进制特征编码,申请人是否具有额外的证书
Job: binary feature encoding whether applicants have a backend or frontend development job
Job :二进制特征编码,无论申请人有后端还是前端开发工作
Noise: a random number, capturing the idea that there are other aspects that determine Salary which we didn’t include
噪声 :一个随机数,反映出以下想法:确定工资的其他方面我们未包括在内
We start with a synthetic dataset of ~ 100K applicants. Here are the first few rows of the data:
我们从约10万名申请人的综合数据集开始。 以下是数据的前几行:

Initially, there’s no difference between salaries for men and women, while backend developers make on average slightly more than frontend engineers.
最初,男女之间的薪水没有区别,而后端开发人员的平均收入比前端工程师的平均收入略高。

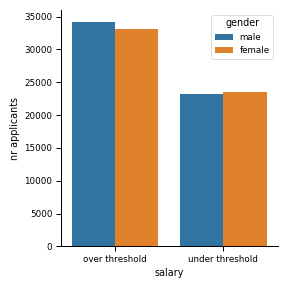
There isn’t an imbalance in the distribution of labels. The number of applicants with salaries over and under the threshold is comparable across genders.
标签的分布没有不平衡。 工资超过或低于阈值的申请人数量在不同性别之间是可比的。
代理人 (Proxies)
One source of bias that is very hard to avoid comes from features that are correlated with protected attributes like gender (proxies). In our dataset, there is a 0.7 correlation between gender and certifications. In a real dataset, most variables will have some correlation with gender (preferred sport, for example). Removing all the correlated variables would be impractical as we’d be left with no data to train the model. If features correlated with variables like gender are not removed, then the model can use them for classification, thus potentially leading to biased outputs. Simply removing the gender variable is ineffectual because the model will still use the gender information available in proxy variables to classify based on gender. Furthermore, removing the gender information from the dataset makes it impossible to evaluate the model by computing fairness metrics. Thus the more realistic setup is that the model is trained on features that are correlated with protected characteristics such as gender to various degrees, though perhaps not on gender information directly.
很难避免的一种偏见源是与与受保护的属性(例如性别)相关的功能。 在我们的数据集中, 性别与认证之间存在0.7的相关性。 在真实的数据集中,大多数变量与性别都有一定的相关性(例如,首选运动)。 删除所有相关变量将是不切实际的,因为我们没有任何数据可以训练模型。 如果未删除与诸如性别之类的变量相关的特征,则模型可以将其用于分类,从而可能导致输出有偏差。 简单地删除性别变量是无效的,因为该模型仍将使用代理变量中可用的性别信息基于性别进行分类。 此外,从数据集中删除性别信息使得无法通过计算公平性指标来评估模型。 因此,更现实的设置是,在与受保护的特征(例如,不同程度的性别)相关的特征上训练模型,尽管可能不直接基于性别信息。

功能有限 (Limited features)
One type of measurement bias common in models built for the entire population is a lack of informative features for minority groups. We illustrate this type of bias in the example below, where everybody’s salary is still a function of job type, years of work experience and certifications, but for a percentage of women who are backend developers, salary is determined by what software tools and frameworks they know (kubernetes!). Our example illustrates the scenario in which women are required to know more frameworks than their male counterparts as they are less likely to be hired on potential. We changed the salary of 70% of the women with 7 to 15 years of experience and backend jobs. Changing such a specific group of users allows us to check to what extent analysis tools can find them. For these women, we randomly pick their salary from a uniform distribution when in fact the salary would be fully specified had we collected information regarding software frameworks.
在为整个人口建立的模型中,常见的一种测量偏差是少数群体缺乏信息功能。 我们在下面的示例中说明了这种类型的偏见,其中每个人的薪水仍然取决于工作类型,工作年限和证书,但是对于作为后端开发人员的女性百分比而言,薪水取决于她们使用的软件工具和框架知道(kubernetes!)。 我们的示例说明了这样一种情况:女性比男性相对需要更多的框架,因为她们不太可能被潜在地雇用。 我们更改了拥有7至15年经验和后端工作的女性中70%的工资。 更改此类特定用户组使我们能够检查分析工具可以找到他们的程度。 对于这些女性,我们实际上是从统一分配中随机选择她们的薪水,而事实上,如果我们收集有关软件框架的信息,薪水将完全确定。

We learn from exploratory data analysis that after the change in salaries, the salary distributions across the different variables does not change significantly, apart from a small drop in mean salary for women.
我们从探索性数据分析中了解到,在薪资发生变化之后,除了女性平均薪资略有下降之外,不同变量之间的薪资分布没有显着变化。

Furthermore, the distribution of labels is similarly balanced across males and females (women have 42% of the salaries above the threshold, while men have 58%). This particular dataset is balanced in terms of the distributions of labels we are trying to predict, so we are not in the sample size disparity scenario which we’ll describe in more detail below. This is why using actual fairness metrics is an important step in the model building process.
此外,男性和女性之间的标签分配也类似地保持平衡(女性的工资水平高出门槛的比例为42%,男性为58%)。 这个特定的数据集在我们试图预测的标签分布方面是平衡的,因此我们不在样本量差异场景中,我们将在下面进行更详细的描述。 这就是为什么使用实际公平性度量标准是模型构建过程中的重要步骤。

With this dataset in hand, we’re now training a model to predict if applicants make under or over 52K (the threshold). We’re splitting our dataset into a training set and a test set, training the model on the training set and evaluating it on the test set. A minimally tuned XGBoost model trained on the modified dataset has a 86% accuracy in predicting whether the applicant’s salary is over or under the cutoff. Let’s compute the fairness metrics: demographic parity and equal opportunity.
有了这个数据集,我们现在正在训练一个模型,以预测申请人的收入是否低于或超过52K(阈值)。 我们将数据集分为一个训练集和一个测试集,在训练集上训练模型并在测试集上对其进行评估。 在修改后的数据集上训练的经过微调的XGBoost模型在预测申请人的工资超过或低于临界值时具有86%的准确性。 让我们计算公平性指标:人口均等和机会均等。

The equal opportunity metric highlights a gap between males and females with TPR=0.77. In the context of our modified dataset, as we’d expect from the linear model we used to generate the data, there’s a linear relationship between years of work experience and salary. After changing the salary of a portion of female applicants, the relationship between salary and years of experience changes. For applicants with 7 to 15 years of work experience, salary can take a larger range of values. The model will struggle to predict as accurately as before the outcomes for this group, making more errors, thus resulting in lower values for the equal opportunity metric which is the TPR.
机会均等指标突出显示了TPR = 0.77的男性和女性之间的差距。 在修改后的数据集的背景下,正如我们期望从用来生成数据的线性模型中得出的那样,工作年限和薪水之间存在线性关系。 在更改了一部分女性申请人的薪水之后,薪水和工作年限之间的关系发生了变化。 对于具有7至15年工作经验的申请人, 薪水可以采用更大的价值范围。 该模型将难以像该组的结果一样准确地进行预测,从而产生更多的错误,从而导致平等机会度量标准TPR的值降低。


Synthetic datasets such as the one we created above can be very helpful in testing different debiasing approaches. In the case above, of datasets with limited features for applicants from unprivileged groups, the standard exploratory data analysis was not as helpful as fairness metrics in identifying poor model performance. Once we used the additional metrics and identified the limited feature issue, the task ahead is how to improve prediction performance for this group of applicants. An added source of difficulty with real life datasets is that many sources of bias will be present simultaneously, thus making the task of building an equitable model difficult. Lastly, it is worth keeping in mind that the sources of bias we’ve explored so far are easier to diagnose because they cause models to predict outcomes less accurately for a particular group¹⁰. The most difficult task is to recognize when models make perfectly accurate predictions, but those predictions reflect the inequalities present in our society. Beyond the data itself there are many other sources of bias when it comes to machine learning. A diverse team evaluating model predictions and a critical attitude towards these predictions are absolutely needed to prevent automatic propagation of discrimination.
诸如我们上面创建的数据集之类的合成数据集对于测试不同的去偏方法很有帮助。 在上述情况下,对于非特权群体的申请人而言,功能有限的数据集,标准探索性数据分析在识别不良模型性能方面没有公平性指标那么有用。 一旦我们使用了其他指标并确定了功能受限的问题,接下来的任务就是如何提高这一组申请人的预测性能。 现实生活中的数据集的另一个困难源是同时会出现许多偏差源,因此使建立公平模型的任务变得困难。 最后,值得牢记的是,到目前为止,我们探究的偏差来源更易于诊断,因为它们会使模型无法准确地预测特定人群的结果。 最困难的任务是识别模型何时做出完全准确的预测,但是这些预测反映了我们社会中存在的不平等现象。 除了数据本身,在机器学习方面还有许多其他偏见。 绝对需要一支多元化的团队来评估模型预测以及对这些预测的批评态度,以防止歧视的自动传播。
In part 2, we’ll look at other sources of bias: skewed samples, sample size disparity and tainted examples.
在第2部分中,我们将研究其他偏差来源:偏斜样本,样本大小差异和受污染的示例。
[1] H. Suresh, J.V. Guttag, A Framework for Understanding Unintended Consequences of Machine Learning, https://arxiv.org/abs/1901.10002
[1] H. Suresh,合资公司Guttag,《理解机器学习意外后果的框架》, https://arxiv.org/abs/1901.10002
[2] Reuters, Amazon scraps secret AI recruiting tool that showed bias against women, https://www.reuters.com/article/us-amazon-com-jobs-automation-insight/amazon-scraps-secret-ai-recruiting-tool-that-showed-bias-against-women
[2]路透社,亚马逊报废了对妇女表现出偏见的秘密AI招聘工具, https://www.reuters.com/article/us-amazon-com-jobs-automation-insight/amazon-scraps-secret-ai-recruiting显示出反对女性偏见的工具
[3] ProPublica, Machine Bias, https://www.propublica.org/article/machine-bias-risk-assessments-in-criminal-sentencing
[3] ProPublica,机器偏见, https: //www.propublica.org/article/machine-bias-risk-assesssments-in-criminal-sentencing
[3] Z. Obermeyer, B. Powers, C. Vogeli, S. Mullainathan, Dissecting racial bias in an algorithm used to manage the health of populations, DOI: 10.1126/science.aax2342, https://science.sciencemag.org/content/366/6464/447
[3] Z. Obermeyer,B。Powers,C。Vogeli,S。Mullainathan,在用于管理人口健康的算法中剖析种族偏见,DOI:10.1126 / science.aax2342, https ://science.sciencemag.org / content / 366/6464/447
[4] A. Narayanan , Tutorial: 21 fairness definitions and their politics, https://www.youtube.com/watch?v=jIXIuYdnyyk
[4] A. Narayanan,教程:21种公平性定义及其政治意义, https://www.youtube.com/watch?v = jIXIuYdnyyk
[5] Equality Act 2010, https://www.citizensadvice.org.uk/law-and-courts/discrimination/about-discrimination/equality-act-2010-discrimination-and-your-rights/
[5]《 2010年平等法》, https://www.citizensadvice.org.uk/law-and-courts/discrimination/about-discrimination/equality-act-2010-discrimination-and-your-rights/
[6] S. Barocas, A.D. Selbst, Big data’s disparate impact, http://ssrn.com/abstract=2477899, 2014
[6] S. Barocas,AD Selbst,大数据的不同影响, http: //ssrn.com/abstract=2477899,2014年
[7] The The US Equal Employment Opportunity Commission (EEOC), Uniform guidelines on employee selection procedures, March 2, 1979
[7]美国平等就业机会委员会(EEOC),《员工选拔程序统一准则》,1979年3月2日
[8] M. Hardt, Fairness in machine learning, NIPS 2017 tutorial at https://mrtz.org/nips17/#/28
[8] M. Hardt, 机器学习的公平性 ,NIPS 2017教程, 网址为https://mrtz.org/nips17/#/28
[9] S. N. Goodman, S. Goel, M. R. Cullen, Machine Learning, Health Disparities, and Causal Reasoning, Annals of Internal Medicine, DOI:10.7326/M18–3297
[9] SN Goodman,S。Goel,MR Cullen,机器学习,健康差异和因果推理,《内科医学年鉴》,DOI:10.7326 / M18-3297
翻译自: https://towardsdatascience.com/sources-of-unintended-bias-in-training-data-be5b7f3347d0
训练样本越少,偏差


 2802
2802

 被折叠的 条评论
为什么被折叠?
被折叠的 条评论
为什么被折叠?
 到【灌水乐园】发言


