


 本文探讨了如何评估回归模型的性能,介绍了多种评估指标和方法,包括来自机器学习、Python编程、TensorFlow和深度学习领域的实践。
回归模型评估
Evaluation metrics;
评估指标;
- Mean/Median of prediction 预测的均值/中位数
- Standard Deviation of prediction 预测标准差
- Range of prediction 预测范围
Coefficient of Determination (R2)
测定系数(R2)
- Relative Standard Deviation/Coefficient of Variation (RSD) 相对标准偏差/变异系数(RSD)
- Relative Squared Error (RSE) 相对平方误差(RSE)
Mean Absolute Error (MAE)
平均绝对误差(MAE)
- Relative Absolute Error (RAE) 相对绝对误差(RAE)
- Mean Squared Error (MSE) 均方误差(MSE)
Root Mean Squared Error on Prediction (RMSE/RMSEP)
预测的均方根误差(RMSE / RMSEP)
- Normalized Root Mean Squared Error (Norm RMSEP) 归一化均方根误差(范数RMSEP)
- Relative Root Mean Squared Error (RRMSEP) 相对均方根误差(RRMSEP)
Let us consider an example of predicting Active Pharmaceutical Ingredients (API) concentration in a tablet. Using absorbance units from NIR spectroscopy we predict the API level in the tablet. The API concentration in a tablet can be 0.0, 0.1, 0.3, 0.5, 1.0, 1.5, 2.0, 2.5, 3.0. We apply PLS (Partial Least Square) and SVR (Support Vector Regressor) for the prediction of API level.
让我们考虑一个预测片剂中活性药物成分(API)浓度的示例。 使用NIR光谱中的吸光度单位,我们可以预测片剂中的API含量。 片剂中的API浓度可以是0.0、0.1、0.3、0.5、1.0、1.5、2.0、2.5、3.0。 我们将PLS(偏最小二乘)和SVR(支持向量回归)用于API级别的预测。
NOTE: The metrics can be used to compare multiple models or one model with different models
注意:指标可用于比较多个模型或一个模型与不同模型
预测的均值/中位数 (Mean/Median of prediction)
We can understand the bias in prediction between two models using the arithmetic mean of the predicted values.
我们可以使用预测值的算术平均值来理解两个模型之间的预测偏差。
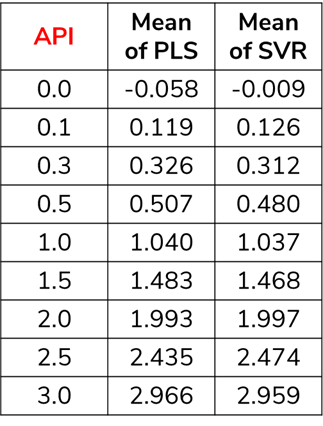
For example, The mean of predicted values of 0.5 API is calculated by taking the sum of the predicted values for 0.5 API divided by the total number of samples having 0.5 API.
例如,通过将0.5 API的预测值的总和除以具有0.5 API的样本总数来计算0.5 API的预测值的平均值。
np.mean(predictedArray)In Fig.1, We can understand how PLS and SVR have performed wrt mean. SVR predicted 0.0 API much better than PLS, whereas, PLS predicted 3.0 API better than SVR. We can choose the models based on the interest of the API level.
在图1中,我们可以了解PLS和SVR如何执行wrt意思。 SVR预测0.0 API优于PLS,而PLS预测3.0 API优于SVR。 我们可以根据API级别的兴趣来选择模型。
Disadvantage: Mean is affected by outliers. Use Median when you have outliers in your predicted values
缺点:中位数受异常值的影响。 当预测值中有异常值时,请使用“中位数”
预测标准差 (Standard Deviation of prediction)
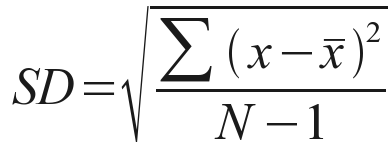
The standard deviation (SD) is a measure of the amount of variation or dispersion of a set of values. A low standard deviation indicates that the values tend to be close to the mean (also called the expected value) of the set,. In contrast, a high standard deviation indicates that the values are spread out over a broader range. The SD of predicted values helps in understanding the dispersion of values in different models.
标准偏差(SD)是一组值的变化或离散量的度量。 低标准偏差表示这些值趋于接近集合的平均值(也称为期望值)。 相反,高标准偏差表示这些值分布在较宽的范围内。 预测值的SD有助于理解不同模型中值的分散性。
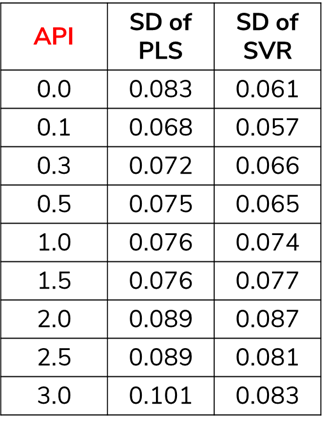
np.std(predictedArray)In Fig.2, The dispersion of predicted values is less in SVR compared to PLS. So, SVR performs better when we consider the SD metrics.
在图2中,与PLS相比,SVR中预测值的离散度较小。 因此,在考虑SD指标时,SVR的性能更好。
预测范围 (Range of prediction)
The range of the prediction is the maximum and minimum value in the predicted values. Even range helps us to understand the dispersion between models.
预测范围是预测值中的最大值和最小值。 偶数范围可以帮助我们了解模型之间的差异。
测定系数(R2) (Coefficient of Determination (R2))
R-squared (R2) is a statistical measure that represents the proportion of the variance for a dependent variable that’s explained by an independent variable or variables in a regression model. Whereas correlation explains the strength of the relationship between an independent and dependent variable, R-squared explains to what extent the variance of one var
 最低0.47元/天 解锁文章


 402
402

 被折叠的 条评论
为什么被折叠?
被折叠的 条评论
为什么被折叠?
 到【灌水乐园】发言


