


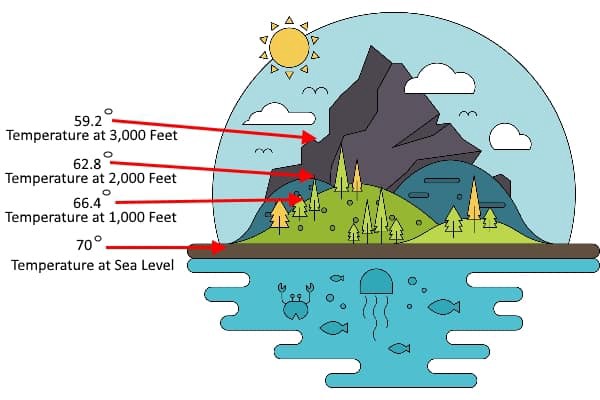
Regression — as fancy as it sounds can be thought of as a “relationship” between any two things. For example, imagine you are on the ground and the temperature is 30 ℃. You start climbing a hill and as you climb, you realize that you are feeling colder and the temperature is dropping. As you reach the hilltop you see that temperature has decreased to 20 ℃ and its much colder now. Using this data, we can conclude that there is a relationship between height and temperature. This is termed as “regression” in statistics.
回归-听起来很花哨,可以看作是任何两件事之间的“关系”。 例如,假设您在地面上且温度为30℃。 您开始爬山时,随着爬山,您会发现自己感觉越来越冷,温度正在下降。 当您到达山顶时,您会发现温度已降至20℃,并且现在温度更低。 使用此数据,我们可以得出结论,高度和温度之间存在关系。 这在统计中称为“ 回归 ”。
Regression analysis is a form of predictive modeling technique that investigates the relationship between a dependent (target) and independent variable (s) (predictor). In a regression problem, we try to map input variables to a continuous function.
回归分析是一种预测建模技术,用于研究因 变量(目标)与自变量 (预测变量)之间的关系 。 在回归问题中,我们尝试将输入变量映射到连续函数。
In the previously explained example, the temperature depends on height and hence is the “dependent” variable, whereas height is the “independent” variable. There may be various factors influencing the temperature such as humidity, pressure, even air pollution levels, etc. All such factors have a relationship with the temperature which can be written as a mathematical equation. We use this mathematical equation (cost function) to train the machine learning model on a given dataset so that our model can later predict the temperature at certain given conditions.
在前面所解释的例子中,温度取决于高度,并因此是“ 从属 ”变量,而高度是“ 独立 ”变量。 可能有多种影响温度的因素,例如湿度,压力,甚至空气污染水平等。所有这些因素都与温度有关系,可以用数学公式表示。 我们使用这个数学方程式( 成本函数 )在给定的数据集上训练机器学习模型,以便我们的模型以后可以预测在给定条件下的温度。
回归如何运作? (How does Regression work?)
Regression is a form of Supervised Machine Learning. We initially split the dataset into Training and Test set. Regression consists of a mathematical equation known as Cost Function. The cost function shows the relationship between independent and dependent variables. The objective of regression is to minimize this cost function which is achieved using optimization algorithms like Gradient Descent. The regression model is then trained on a training set to achieve ‘Line of Best Fit’. The below-given illustration shows how the line of best fit is found in linear regression.
回归是监督机器学习的一种形式。 我们最初将数据集分为训练和测试集。 回归包括一个称为成本函数的数学方程。 成本函数显示自变量和因变量之间的关系。 回归的目标是最小化使用优化算法(例如Gradient Descent )实现的成本函数。 然后在训练集上训练回归模型,以实现“ 最佳拟合线 ”。 下图显示了如何在线性回归中找到最佳拟合线。
Once trained and optimized, this model predicts outputs on a test set which is compared with observed output for accuracy.
经过训练和优化后,该模型将预测测试集上的输出,并与观察到的输出进行比较以确保准确性。
回归类型 (Types of regression)
线性回归 (Linear Regression)
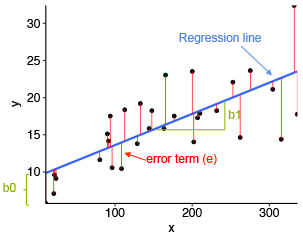
This is the most fundamental regression model which needs to be understood to know the basics of regression analysis. When we have one predictor variable ‘x’ for one dependent or response variable ‘y’ that are linearly related to each other, the model is called Simple Linear Regression model. In the case of more than one predictor present (multiple input variables), the model is called Multiple Linear Regression model. The relation is defined using the equation:-
这是最基本的回归模型,需要了解回归分析的基础知识。 当我们有一个线性相关的因变量或响应变量“ y”的预测变量“ x”时 ,该模型称为简单线性回归模型 。 在存在多个预测变量(多个输入变量)的情况下,该模型称为多元线性回归模型 。 该关系使用以下公式定义:
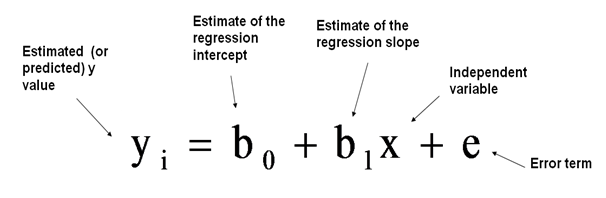
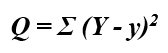
The line that best fits the model is determined by the values of parameters b0 and b1. The difference between the observed outcome Y and the predicted outcome y is known as a prediction error. Hence, the values of b0 and b1 should be such that they minimize the sum of the squares of the prediction error.
最适合模型的线由参数b0和b1的值确定。 观察到的结果Y与预测结果y之差称为预测误差 。 因此,b0和b1的值应使它们最小化预测误差的平方和。
Linear Regression does not perform well on large datasets as it assumes a linear relationship between dependent and independent variables. That means it assumes that there is a straight-line relationship between them. It assumes independence between attributes.
线性回归在大型数据集上表现不佳,因为它假设因变量和自变量之间存在线性关系。 这意味着它假定它们之间存在直线关系。 它假定属性之间的独立性。
多项式回归 (Polynomial Regression)
Polynomial regression is similar to Multiple Linear Regression. However, in this type of regression, the relationship between X and Y variables is defined by taking the nth degree polynomial in X. Polynomial regression fits a non-linear model to the data but as an estimator, it is a linear model.
多项式回归类似于多元线性回归。 但是,在这种类型的回归中,X和Y变量之间的关系通过采用X中的n次多项式来定义。多项式回归将非线性模型拟合到数据中,但作为估计量,它是线性模型。
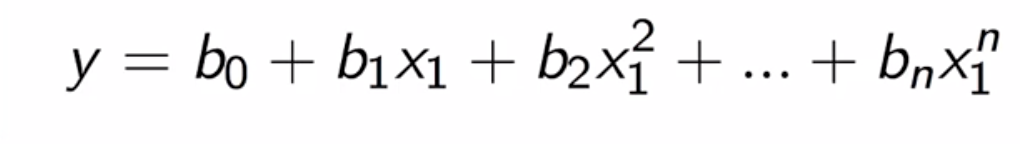
Polynomial regression models are analyzed for accuracy similar to Linear regression models but are slightly difficult to interpret as the input variables are highly correlated. The estimated value of the dependent variable Y is modeled with the equation (for the nth-order polynomial):
与线性回归模型相似,对多项式回归模型进行准确性分析,但由于输入变量高度相关,因此难以解释。 因变量Y的估计值用以下公式建模(对于n阶多项式):
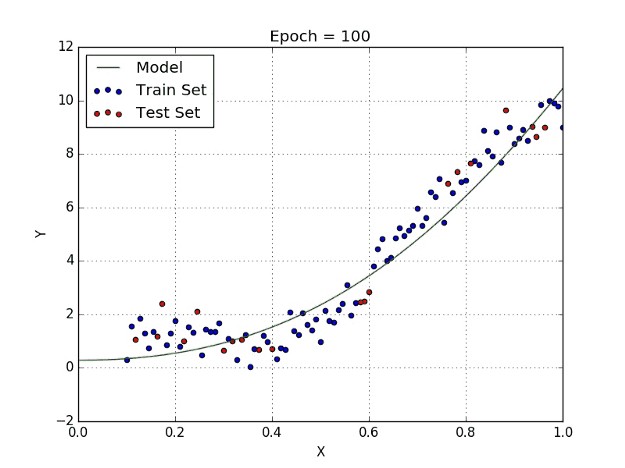
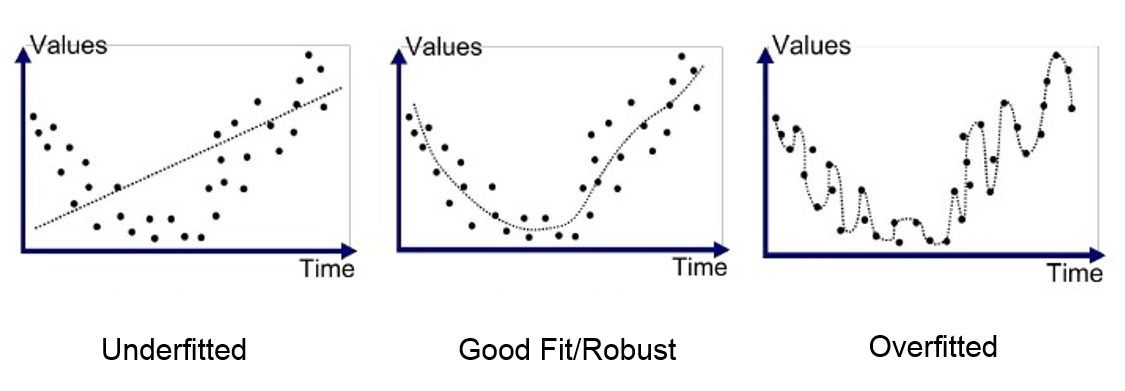
The line that passes through the points will not be a straight line but a curved one depending on the power of X. High-degree polynomials are observed to induce more oscillations in the observed curve and have poor interpolator properties. See the illustration below to understand how polynomial regression works.
穿过点的线将不是直线,而是取决于X的幂的弯曲曲线。观察到高阶多项式会在观察到的曲线中引起更多的振荡,并且插值器的性能也很差。 请参阅下图以了解多项式回归的工作原理。
岭回归 (Ridge Regression)
A standard linear or polynomial regression will fail in the case where there is high collinearity among the feature variables. Collinearity is the existence of near-linear relationships among the independent variables.
在特征变量之间存在高共线性的情况下,标准线性或多项式回归将失败。 共线性是自变量之间存在近线性关系。
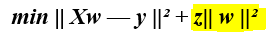
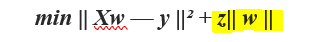
We can first look at the optimization function of a standard linear regression to gain some insight as to how ridge regression can help:
我们首先可以查看标准线性回归的优化功能,以了解岭回归如何提供帮助:
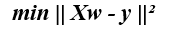
Where X represents the feature/input variables, w represents the weights, and y represents the observed output.
其中X代表特征/输入变量, w代表权重, y代表观察到的输出。
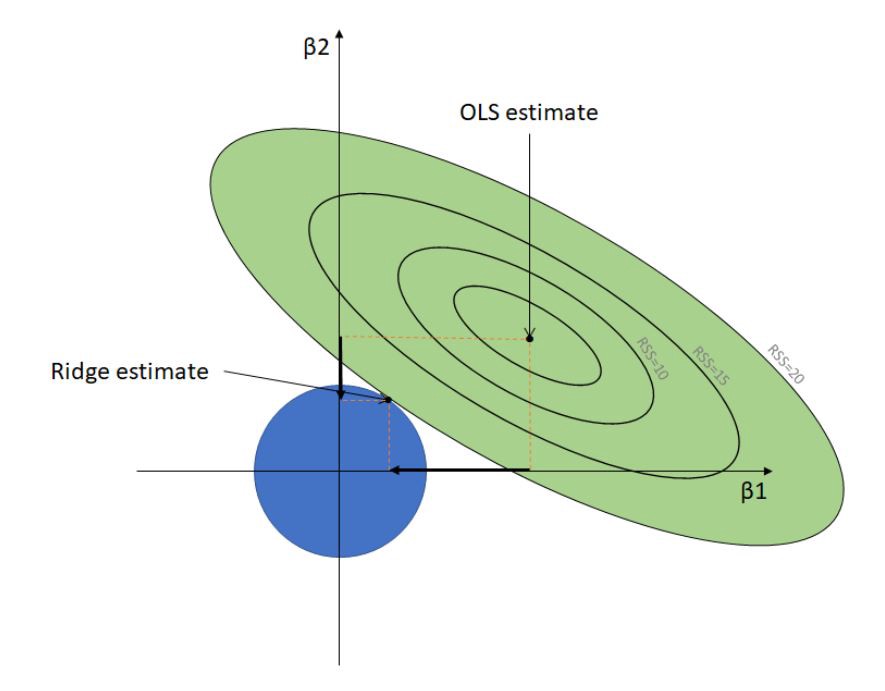
Ridge Regression is a measure taken to reduce collinearity amongst regression predictor variables in a model. If the feature variables are correlated, the final regression model will be restricted and rigid in its approximation i.e it has high variance and will result in overfitting.
岭回归是一种用于减少模型中回归预测变量之间的共线性的措施。 如果特征变量相关,则最终回归模型将受到限制且近似逼近,即具有高方差并会导致过度拟合 。
Overfitting refers to a model that models the training data too well. Overfitting happens when a model learns the detail and noise in the training data to the extent that it negatively impacts the performance of the model on new data.
过度拟合是指对训练数据建模得太好的模型。 当模型学习训练数据中的细节和噪声时,就会过度拟合,从而对模型在新数据上的性能产生负面影响。
To solve this issue, Ridge Regression adds a small squared bias value to the variables:
为了解决这个问题,Ridge Regression向变量添加了一个小的平方偏差值:
Such a squared bias factor pulls the feature variable coefficients away from this rigidness, introducing a small amount of bias into the model but greatly reducing the variance.
这样的平方偏差因子使特征变量系数远离此刚度,在模型中引入了少量偏差,但大大减小了方差。
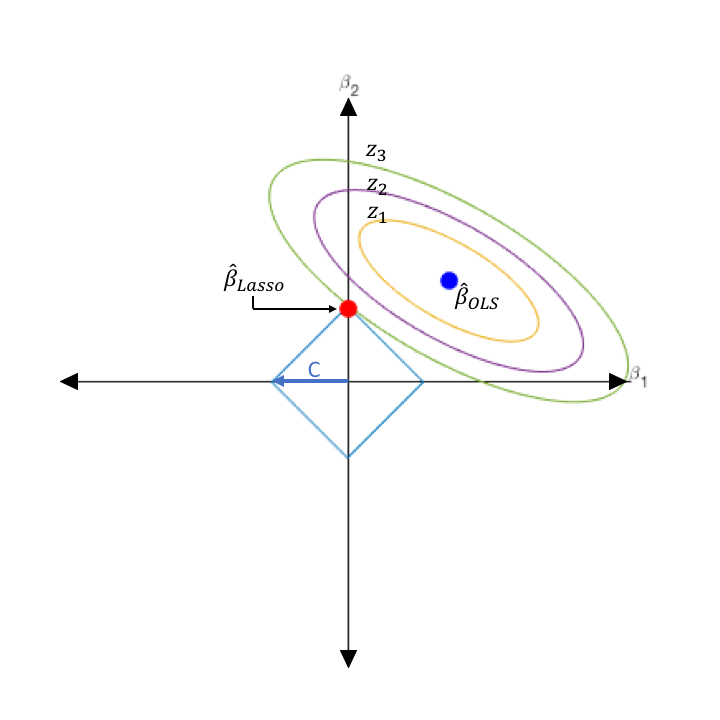
套索回归 (Lasso Regression)
Lasso Regression is quite similar to Ridge Regression but the only difference is that it penalizes the absolute size of the regression coefficients instead of squared bias.
Lasso回归与Ridge回归非常相似,但唯一的区别是,它惩罚了回归系数的绝对大小而不是平方偏差。
By penalizing the absolute values, the estimated coefficients shrink more towards zero which could not be possible using ridge regression. This method makes it useful for feature selection where a set of variables and parameters are picked for model construction. LASSO takes the relevant features and zeroes the irrelevant values such that overfitting is avoided and also makes the learning faster.
通过对绝对值进行惩罚,估计的系数将更趋近于零,这是使用岭回归无法实现的。 这种方法对于特征选择很有用,在特征选择中选择一组变量和参数以进行模型构建。 LASSO具有相关特征并将不相关的值归零,从而避免了过拟合,并且使学习速度更快。
结论 (Conclusion)
Regression Analysis is a very interesting machine learning technique that can be applied in different areas to predict numerical values such as predicting the price of a product/house, predicting the number of goals soccer players score in a season, and predicting the BMI of people. I have covered four basic regression models in this blog. The rest require intensive knowledge of mathematics to understand. Hope you like this blog and find it informative!
回归分析是一种非常有趣的机器学习技术,可以应用于不同领域来预测数值,例如预测产品/房屋的价格,预测足球运动员在一个赛季中进球的数量以及预测人的BMI。 我在此博客中介绍了四个基本的回归模型。 其余的需要深入的数学知识才能理解。 希望您喜欢这个博客,并从中获得启发!


 2万+
2万+

 被折叠的 条评论
为什么被折叠?
被折叠的 条评论
为什么被折叠?
 到【灌水乐园】发言


