


机器学习 可视化
机器学习导论 (Introduction to machine learning)
In the traditional hard-coded approach, we program a computer to perform a certain task. We tell it exactly what to do when it receives a certain input. In mathematical terms, this is like saying that we write the f(x) such that when users feed the input x into f(x), it gives the correct output y.
在传统的硬编码方法中,我们对计算机进行编程以执行特定任务。 我们确切地告诉它在收到某个输入时该怎么做。 用数学术语来说,这就像说我们写f(x) 这样,当用户将输入x馈入f(x)时 ,它会给出正确的输出y 。
In machine learning, however, we have a large set of inputs x and corresponding outputs y but not the function f(x). The goal here is to find the f(x) that transforms the input x into the output y. Well, that’s not an easy job. In this article, we will learn how this happens.
但是,在机器学习中,我们有大量的输入x和对应的输出y,但没有函数f(x) 。 这里的目标是找到将输入x转换为输出y的f(x) 。 好吧,这不是一件容易的事。 在本文中,我们将学习如何发生这种情况。
数据集 (Dataset)
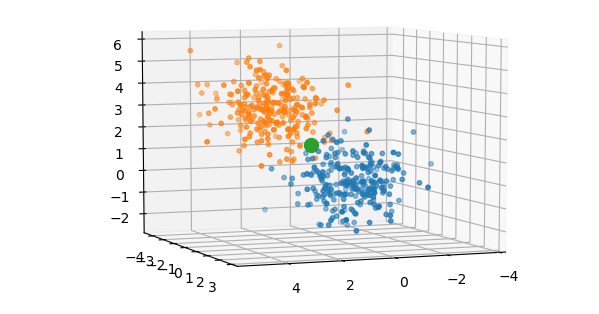
To visualize the dataset, let’s make our synthetic dataset where each data point (input x) is 3 dimensional, making it suitable to be plotted on a 3D chart. We will generate 250 points (cluster 0) in a cluster centered at the origin (0, 0, 0). A similar cluster of 250 points (cluster 1) is generated but not centered at the origin. Both clusters are relatively close but there is a clear separation as seen in the image below. These two clusters are the two classes of data points. The big green dot represents the centroid of the whole dataset.
为了可视化数据集,让我们制作合成数据集,其中每个数据点(输入x )都是3维的,使其适合绘制在3D图表上。 我们将在以原点(0,0,0 )为中心的群集中生成250个点(群集 0)。 生成了一个类似的250点群集(群集1) ,但未将其原点居中。 两个群集都相对较近,但存在明显的分离,如下图所示。 这两个群集是两类数据点。 大绿点代表整个数据集的质心。
After generating the dataset, we will normalize it by subtracting the mean and dividing by the standard deviation. This is done to zero-center the data and map values in each dimension in the dataset to a common scale. This speeds up the learning.
生成数据集后,我们将通过减去平均值并除以标准差来对其进行归一化。 这样做是为了使数据零中心并将数据集中每个维度的值映射到一个公共比例。 这样可以加快学习速度。
The data will be saved in an array X containing the 3D coordinates of normalized points. We will also generate an array Y with the value either 0 or 1 at each index depending on which cluster the 3D point belongs.
数据将保存在包含归一化点的3D坐标的数组X中。 我们还将根据3D点所属的簇,在每个索引处生成一个值为0或1的数组Y。
易学的功能 (Learnable Function)
Now that we have our data ready, we can say that we have the x and y. We know that the dataset is linearly separable implying that there is a plane that
 最低0.47元/天 解锁文章


 245
245


 被折叠的 条评论
为什么被折叠?
被折叠的 条评论
为什么被折叠?
 到【灌水乐园】发言


