


詹金斯搭建
Hola everyone,
大家好,
Today, I have a great setup of Automation for you. From the Last couple of weeks, I am showing you some great setups of Kubernetes and Jenkins. But maybe you have not seen my all this setup till yet as because I uploaded on different platforms. But don’t worry I will guide you. Today, I Integrate all of my previous setups and create an advanced CI/CD setup. If I give you high-level-idea so we are going to integrate Git, GitHub, Docker, Advance Jenkins (Job-DSL) , Kubernetes, Prometheus and Grafana.
今天,我为您准备了一套很棒的自动化程序。 从最后几周开始,我将向您展示Kubernetes和Jenkins的一些出色设置。 但是也许您还没有看到我的所有设置,因为我在不同的平台上载了。 但是不用担心,我会指导您。 今天,我集成了以前的所有设置,并创建了高级CI / CD设置。 如果我给您高层的想法,那么我们将集成Git,GitHub, Docker ,Advantage Jenkins(Job-DSL) ,Kubernetes, Prometheus和Grafana 。
Before, I give you today’s agenda. I want to tell you something about Jenkins Job-DSL.
以前,我给您今天的议程。 我想告诉您一些有关Jenkins Job-DSL的信息。
那么,什么是Jenkins Job-DSL? (So, What is Jenkins Job-DSL?)
Jenkins is a wonderful system for managing builds, and people love using its UI to configure jobs. Job DSL was one of the first popular plugins for Jenkins which allows managing configuration as code.The Jenkins Job DSL enables the programmatic creation of Jenkins jobs using Groovy code. You can store this code in your Git repository and thus make changes traceable and generate Jenkins jobs automatically. The DSL is provided via the Job DSL Plugin and is documented in detail in the Job DSL API Viewer.
Jenkins是用于管理版本的绝佳系统,人们喜欢使用其UI来配置作业。 Job DSL是Jenkins最早的流行插件之一,它允许将配置作为代码进行管理。 Jenkins Job DSL支持使用Groovy代码以编程方式创建Jenkins作业。 您可以将此代码存储在Git存储库中,从而使更改可追溯并自动生成Jenkins作业。 DSL通过Job DSL插件提供,并在Job DSL API Viewer中详细记录。
Agenda!!!
一个源田!
As Developer pushes the code in GitHub. So, It automatically deploys our full flesh Web Server ready. It’s not just a normal server. It’s a great setup which has fault tolerance capacity, Autoscaling capacity, and Monitoring also available.
随着开发人员在GitHub中推送代码。 因此,它会自动部署完整的Web服务器。 这不仅仅是普通的服务器。 这是一个伟大的设置具有容错能力, 自动扩充容量,同时还可以监控 。
涉及的步骤 (Steps Involved)
Create a Jenkins Seed job
创建詹金斯种子工作
From Git Push upload code in GitHub and Triggers Seed job.
从GitHub中的 Git Push上传代码和Triggers Seed作业。
Jenkins Dynamic cluster runs the Jenkins jobs.
Jenkins Dynamic集群运行Jenkins作业。
Kubernetes launch the web server.
Kubernetes启动Web服务器 。
Prometheus monitor the things from getting metrics.
普罗米修斯通过获取指标来监控事情。
Grafana visualize the metrics properly.
Grafana可以正确地可视化指标。
我们走吧 (Let’s Go)
First, set up our lab. So, In single shot our whole Environment ready.
首先,建立我们的实验室。 因此,单枪匹马就可以准备好整个环境。
It’s a one-time setup you do. If you do this first time then maybe it’s a little bit painful but if you go through the right approach then its very simple.
这是一次设置。 如果您是第一次这样做,那么可能会有些痛苦,但是如果您采用正确的方法,那么它非常简单。
First, Setup a Kubernetes. Here, I am using Minikube(Single-node cluster) for this. I install this on the top of Windows but the same configuration you can also do on Linux or Mac.
首先,设置一个Kubernetes。 在这里,我为此使用Minikube (单节点群集)。 我将其安装在Windows的顶部,但与Linux或Mac上的配置相同。
After install Minikube you need to monitor that. As because our web server launch inside it. For Monitoring here, I am using Prometheus and we need to collect the metrics of minikube. But, First I tell you it’s very painful for me to do this as because of nowhere available this thing on the google. For metrics collection, you need a node_exporter for Linux program because behind the scene minikube also based on Linux distribution. For this, you can go manually inside the minikube and download or through SSH you put this node_exporter on that. But, you can’t put this anywhere on the minikube.
安装Minikube之后,您需要对其进行监视。 因为我们的Web服务器在其中启动。 对于此处的监视,我正在使用Prometheus ,我们需要收集minikube的指标。 但是, 首先,我告诉您,这样做对我来说非常痛苦,因为在Google上无处可用。 对于指标收集,您需要一个用于Linux程序的node_exporter ,因为在后台迷你库也基于Linux发行版。 为此,您可以手动进入minikube并下载或通过SSH将node_exporter放在其上。 但是,您不能将其放在minikube上的任何位置。
但为什么??? (But why???)
Because After reboot maybe you not find your node exporter. Not every path is persistent in minikube. There are some limited paths which is persistent in minikube. I want to tell one them which is /data.
因为重启后可能找不到节点导出器。 并非每条路径在minikube中都是持久的 。 在minikube中存在一些有限的路径。 我想告诉他们一个是/ data。
If you put anything inside the /data folder so it will be persistent in minikube. Now you put your software inside this and unzip this folder using the command :
如果将任何东西放在/ data文件夹中,那么它将在minikube中保持不变。 现在,将软件放入其中,并使用以下命令将该文件夹解压缩:
tar -xzf node_exporter-1.0.1.linux-amd64.tar.gzAfter that, you see a folder of the same name is generated there. Now, just come back from there. Now, you only need to just run the exporter program but you also face a great challenge as It’s not a good practise to go inside and run that program after every reboot. So what we do??? There is a path in minikube (/var/lib/boot2docker/bootlocal.sh). If you write any Script inside this file so it runs at the time of boot in minikube. Right now, Our need is to start the node_exporter after every reboot so we write the script to start this node exporter. Script is:
之后,您会看到在其中生成了一个同名文件夹。 现在,从那里回来。 现在,您只需要运行导出程序,但同时也面临着巨大的挑战,因为在每次重新启动后进入内部并运行该程序并不是一个好习惯。 那么我们该怎么办??? minikube中有一个路径( /var/lib/boot2docker/bootlocal.sh)。 如果您在此文件中写入任何脚本,那么它将在minikube中启动时运行。 现在,我们需要在每次重新启动后启动node_exporter,因此我们编写脚本来启动此节点导出器。 脚本是:
#!bin/bashcd /data/node_exporter-1.0.0.linux-amd64;nohup ./node_exporter &Now If you also want to monitor docker in minikube. But here is some challenge comes up. I will tell you. what challenge you face. So for getting metrics of docker we need to write/add the script in daemon file:
现在,如果你也想监视 码头工人 在minikube。 但是,这里出现了一些挑战。 我会告诉你。 您面临什么挑战。 因此,为了获取docker的指标,我们需要在守护程序文件中编写/添加脚本:
{
  "metrics-addr" : "0.0.0.0:9323",
  "experimental" : true
}
This on the docker daemon file(/etc/docker/daemon.json). But here, another challenge comes up. As minikube doesn’t store this data persistent on this file. After reboot, everything goes down. So, we need to make this file permanent. For keeping this file permanent there is a way in minikube. You can put this file on the $MINIKUBE_HOME/files. but it only syncs when minikube start is run, though before Kubernetes is started.
这在docker守护程序文件( /etc/docker/daemon.json )上。 但是在这里,另一个挑战出现了。 由于minikube不会将该数据持久存储在该文件中。 重新启动后,一切都会消失。 因此,我们需要将该文件永久化。 为了使该文件永久存在,在minikube中有一种方法。 您可以将此文件放在$ MINIKUBE_HOME / files上。 但它只会在运行minikube start时minikube start同步,尽管会在Kubernetes启动之前进行同步。
Like that we also need to put the above script file also in the same path. So after every reboot file will be present there. Like this
这样,我们还需要将上述脚本文件也放在同一路径中。 因此,每次重新启动文件后,该文件都会存在。 像这样

Now Your main setup is configured. You can start the minikube from command minikube start. After that, you can see the metrics of minikube in the browser. But you have not seen metics of docker. why???
现在,您的主要设置已配置。 您可以从命令minikube start启动minikube。 之后,您可以在浏览器中查看minikube的指标。 但是您还没有看到docker的工具。 为什么???
Because our new daemon file is updated after docker services are started. To solve this issue there is no automated way is available. Believe me, I try every possible way. The only way to get the metrics of docker is to go inside the minikube and run command sudo systemctl restart docker .
因为我们的新守护程序文件是在docker服务启动后更新的。 要解决此问题,没有自动方法可用。 相信我,我会尽一切可能。 获取docker指标的唯一方法是进入minikube并运行命令sudo systemctl restart docker docker。
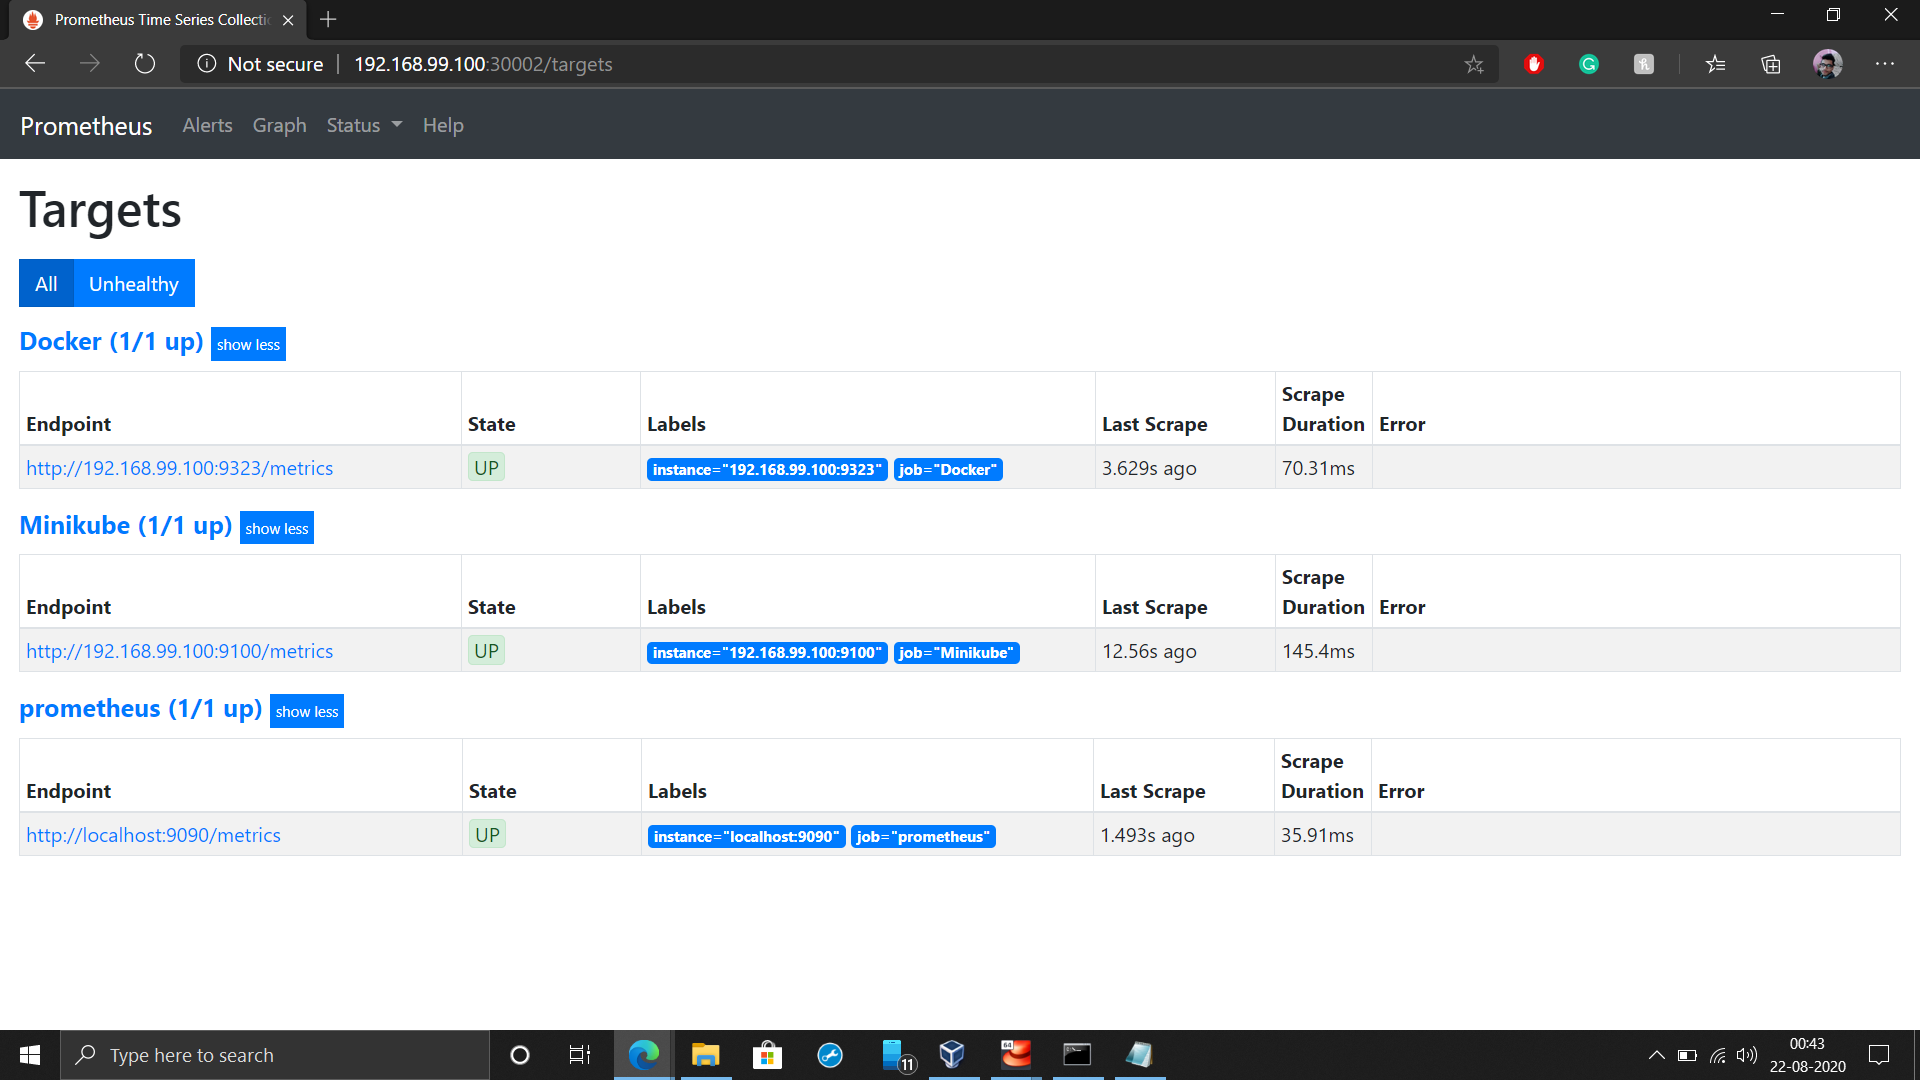
Now, you can see the metrics of docker also. For see, the metrics need a Prometheus server. For setup Prometheus in Kubernetes, you can click here.
现在,您还可以查看docker的指标。 可见,指标需要Prometheus服务器。 要在Kubernetes中设置Prometheus,请单击此处 。
After that you see like this :
之后,您将看到以下内容:
Now, you also need your Jenkins Dynamic cluster be ready for this you can take reference from here. Here, I guide you how you can create your cluster in Jenkins.
现在,您还需要为Jenkins Dynamic集群做好准备,您可以从此处参考。 在这里,我指导您如何在Jenkins中创建集群。
Finally, our setup is ready for work. Let’s quickly do the things.
最后,我们的设置已准备就绪。 让我们快速做事。
第1步: (Step 1:)
Create a Jenkins Seed job which create our other Jenkins job and also create a pipeline.
创建一个Jenkins Seed作业,该作业将创建我们的其他Jenkins作业,并创建一个管道 。


Here, you see for triggering this job I use two ways:
在这里,您看到触发该作业的方式有两种:
- GitHub Hook Triggers: As when someone upload the code on GitHub repository so this job will triggers. GitHub Hook触发器:就像有人将代码上传到GitHub存储库上一样,因此此作业将被触发。
- Trigger Build Remotely: As when someone wants to trigger this job so they can trigger through URL. 远程触发构建:就像有人要触发此作业一样,以便他们可以通过URL触发。
第2步: (Step 2:)
As Developer Commit the code from Git. So, it upload the code on GitHub and also triggers Seed job.
作为开发人员从Git提交代码。 因此,它将代码上传到GitHub并触发Seed作业。
For doing this I use Post-Hooks in Git
为此,我在Git中使用Post-Hooks

After creating post-commit in git. It automatically push and trigger the seed job as when you commit the code.
在git中创建后提交后。 当您提交代码时,它将自动推送并触发种子作业。
第三步: (Step 3:)
This is the main process step in our task. It create the whole setup of our web server. As developer commit the code and seed job runs. They create Jobs in Jenkins. In this step I show you the jobs which Jenkins runs.
这是我们任务中的主要流程步骤。 它创建了我们的Web服务器的整个设置。 开发人员提交代码后,种子作业就会运行。 他们在詹金斯创建了乔布斯。 在这一步中,我向您展示Jenkins所从事的工作。
Job 1
工作1
Download code from GitHub and make a docker image of our latest web server and also upload on docker registry. Intresting things is we create our jobs from Groovy language code.
从GitHub下载代码,并制作我们最新的 Web服务器的docker映像,并上传到docker Registry 。 有趣的是,我们使用Groovy语言代码创建了工作。
job('job1') {
    description('Copy the code from github and also create and push an image in dockerHub')
    label('rhel')
    scm {
        git {
            remote {
                url('https://github.com/Harshetjain666/DevopsTask-6.git')
            }
            branch('*/' + 'master')
        }
    }
    steps{
        shell('mkdir /root/workspace ; cp -rf * /root/workspace/')
        dockerBuilderPublisher {
            dockerFileDirectory('/root/workspace/')
            cloud('')
            fromRegistry {
                credentialsId('')
                url('')
            }
            pushOnSuccess(true)
            cleanImages(false)
            cleanupWithJenkinsJobDelete(false)
            pushCredentialsId('424dca0c-5cf9-4bee-ae01-0d373301bf14')
            tagsString('harshetjain/html-environment')
        }
    }
}
Job 2
工作2
This is very significant job. This made our web server ready and also do Autoscaling. So, as load increase behind the scene launch more servers.
这是非常重要的工作。 这使我们的Web服务器准备就绪,并且也可以进行自动缩放 。 因此,随着负载的增加,在后台启动了更多的服务器。
job('job2') {
    description('Make Environment Ready And Updated')
    label('rhel')
    scm {
        git {
            remote {
                url('https://github.com/Harshetjain666/DevopsTask-6.git')
            }
            branch('*/' + 'master')
        }
    }
    triggers {
        upstream('job1', 'SUCCESS')
    }
    steps {
        shell('''mkdir /root/workspace ; cp -rf * /root/workspace/
            deployname=$(kubectl get deployment --selector=type=html --output=jsonpath={.items..metadata.name})
            if [ $deployname =="" ]
            then
            kubectl create -f /root/workspace/html.yml
            else
            echo "Environment updating ..."
            fi
            kubectl set image deployment  *=harshetjain/html-environment --selector=type=html --record''')
    }
}
Job 3
工作3
This job checks our web server is perfectly working or not. If they find any unstability so it contact to developer and also trigger other job to update the web server.
这项工作检查我们的Web服务器是否正常工作。 如果他们发现任何不稳定的情况,那么它将与开发人员联系并触发其他作业来更新Web服务器。
job('job3') {
    description('Test the webpage and send mail if job fails')
    label('rhel')
    triggers {
        upstream('job2', 'SUCCESS')
        pollSCM {
            scmpoll_spec(* * * * *)
        }
    }
    steps {
        shell('''status=$(curl -o /dev/null -s -w "%{http_code}" http://192.168.99.100:31000)
            if [ $status == 200 ]
            then
            exit 0
            else
            exit 1
            fi''')
    }
    publishers {
        mailer('hjain8620.hj@gmail.com', false, false)
        downstreamParameterized {
            trigger('job4') {
                condition('UNSTABLE')
            }
        }
    }
}
Job 4
工作4
This job is only run when if job 3 find our server not works good. If they find some issues in our updated web server so it automatically rollback our web server and change to the default one.
仅当作业3发现我们的服务器运行不正常时,才运行此作业。 如果他们在我们更新的Web服务器中发现一些问题,那么它将自动回滚我们的Web服务器并更改为默认服务器。
job('job4') {
    description('Run Over Old Setup')
    label('rhel')
    steps {
        shell('''kubectl set image deployment  *=harshetjain/html-environment:v1 --selector=type=html --record''')
    }
}
You can also create a Pipeline view so we can see what’s going on
您还可以创建管道视图,以便我们查看发生了什么
buildPipelineView('Pipeline') {
    filterBuildQueue(true)
    filterExecutors(false)
    displayedBuilds(1)
    selectedJob('job1')
    alwaysAllowManualTrigger(true)
    showPipelineParameters()
    refreshFrequency(3)
}
Now we only need to start the job 1 for this use queue('job1')
现在,我们只需要为此使用queue('job1')启动作业1
Bang on!!! Your work is nearly completed.
砰! 您的工作即将完成。
第4步: (Step 4:)
You can see a very powerful and fault tolerance setup is ready in Kubernetes. If anything is goes down within a second new one is created with all configuration and same old data available.
您可以在Kubernetes中看到一个功能强大且具有容错能力的设置。 如果在第二次发生任何故障,则将使用所有配置和相同的旧数据创建新的。

步骤5: (Step 5:)
I integrate both steps 5 and 6 in there as because for monitoring we need metrics and I also use here Grafana so we can visualize properly and also behind the scene Grafana get the metrics from Prometheus. For showing you this visualization I use a simple query process_cpu_seconds_total. This showing us the CPU utilization of servers.
我将第5步和第6步集成到了那里,因为为了进行监视,我们需要度量,并且我在这里也使用了Grafana,因此我们可以正确地进行可视化,并且在后台Grafana从Prometheus获取度量。 为了向您展示这种可视化效果,我使用一个简单的查询process_cpu_seconds_total。 这向我们显示了服务器的CPU利用率 。

Now, At the end I would like to show you the web page of our web server. This is just a testing page which I made for testing.
现在,最后我想向您展示我们的Web服务器的网页 。 这只是我用于测试的测试页面。

This is Automation. Finally, you seen a very great CI/CD setup as if you again put the updated code on GitHub so within some seconds you see your server is updated. It’s not just only updates. Lots of things also done to make this setup very unique.
这是自动化 。 最后,您看到了非常出色的CI / CD设置,就好像您将更新的代码再次放在GitHub上一样,因此在几秒钟内您就看到了服务器已更新。 不只是更新。 为了使此设置非常独特,还做了很多事情。
For your reference I upload my codes in my GitHub repository.
供我参考,我将代码上传到GitHub 存储库中 。
Thank you for reading …
谢谢您的阅读……
Connect with me On Linkedin For FurThur Queries Or Suggestion’s if u Have Any !!!
在Linkedin上与我联系 对于FurThur查询或建议,如果您有任何建议!
詹金斯搭建


 760
760

 被折叠的 条评论
为什么被折叠?
被折叠的 条评论
为什么被折叠?
 到【灌水乐园】发言


