


一、主题式网络爬虫设计方案(15分)
1.主题式网络爬虫名称
名称:爬取马蜂窝泉州景点数据信息
2.主题式网络爬虫爬取的内容与数据特征分析
本次爬虫主要爬取马蜂窝在泉州地区的景点票价和游玩地点信息
3.主题式网络爬虫设计方案概述(包括实现思路与技术难点)
本次设计方案主要使用request库和beautifulSoup库对网站访问,最后将数据以表格的形式输出。
技术难点主要包括对马蜂窝页面的采集和数据清洗。
二、主题页面的结构特征分析(15分)
1.主题页面的结构特征

2.Htmls页面解析


3.节点(标签)查找方法与遍历方法
(必要时画出节点树结构)
查找用find函数,遍历用for循环。
三、网络爬虫程序设计(60分)
爬虫程序主体要包括以下各部分,要附源代码及较详细注释,并在每部分程序后面提供输出结果的截图。
1.数据爬取与采集
2.对数据进行清洗和处理


3.文本分析(可选):jieba分词、wordcloud可视化


4.数据分析与可视化
(例如:数据柱形图、直方图、散点图、盒图、分布图、数据回归分析等)
importmatplotlib.pyplot as plt
plt.rcParams['font.sans-serif']=['SimHei'] #用来正常显示中文标签
plt.rcParams['axes.unicode_minus']=False #用来正常显示负号
Type= ['108~138', '59.9~119.5', '2470~7500','119', '108~158','61~183','2720~7320','100~2550','518~618']
Data= [130, 75, 60, 12,3,69,13,45,2]#cols = ['r','g','y','coral']#绘制饼图
plt.pie(Data ,labels=Type, autopct='%1.1f%%')#设置显示图像为圆形
plt.axis('equal')
plt.title('各个价格段的销售比重')
plt.show()

importmatplotlib.pyplot as plt
plt.rcParams['font.family'] = ['sans-serif']
plt.rcParams['font.sans-serif'] = ['SimHei']
plt.figure(figsize=(10,6))#价格
prices = ['108~138', '59.9~119.5', '2470~7500','119', '108~158','61~183','2720~7320','100~2550','518~618']#月售,选择,评分
undergraduate_enrollment = [130, 75, 60, 12,3,69,13,45,2]
secondary_vocational_enrollment= [310, 26,373,764,270,66,62,36,72]
high_school_enrollment= [4.9,4.7,5.0,4.9,5.0,4.7,5.0,4.5,4.0]
x=list(range(len(undergraduate_enrollment)))#设置间距
total_width, n = 0.8, 3width= total_width /n#在偏移间距位置绘制柱状图1
for i inrange(len(x)):
x[i]-=width
plt.bar(x, undergraduate_enrollment, width=width, label='月售', fc='teal')#设置数字标签
for a, b inzip(x, undergraduate_enrollment):
plt.text(a, b, b, ha='center', va='bottom', fontsize=10)#在偏移间距位置绘制柱状图2
for i inrange(len(x)):
x[i]+=width
plt.bar(x, secondary_vocational_enrollment, width=width, label='选择', tick_label=prices, fc='darkorange')#设置数字标签
for a, b inzip(x, secondary_vocational_enrollment):
plt.text(a, b, b, ha='center', va='bottom', fontsize=10)#在偏移间距位置绘制柱状图3
for i inrange(len(x)):
x[i]+=width
plt.bar(x, high_school_enrollment, width=width, label='评分', fc='lightcoral')#设置数字标签
for a, b inzip(x, high_school_enrollment):
plt.text(a, b, b, ha='center', va='bottom', fontsize=10)
plt.title("不同价位的月售、选择及各自的评分情况统计")
plt.ylabel("数量")
plt.legend(loc='lower right')
plt.show()

5.数据持久化

6.附完整程序代码
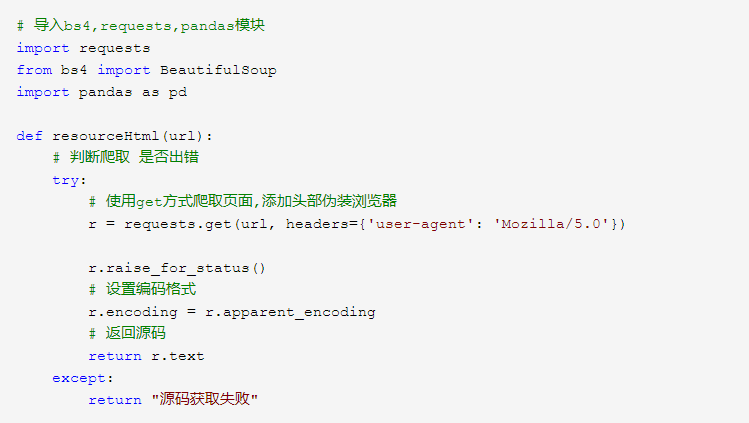
#导入bs4,requests,pandas模块
importrequestsfrom bs4 importBeautifulSoupimportpandas as pddefresourceHtml(url):#判断爬取 是否出错
try:#使用get方式爬取页面,添加头部伪装浏览器
r = requests.get(url, headers={'user-agent': 'Mozilla/5.0'})
r.raise_for_status()#设置编码格式
r.encoding =r.apparent_encoding#返回源码
returnr.textexcept:return "源码获取失败"
defhemlparser(item, resourcetext,urls):
soup= BeautifulSoup(resourcetext, "html.parser")
ul= soup.select("div.exe-packg02>ul>li")for li inul:
h3= li.find("h3") #h3标签
h3text= h3.text.strip() #标题
href= h3.find_all("a", "_j_search_link")[0].attrs["href"] #地址
p= li.find_all("p", "seg-desc")[0].text.strip() #内容
solenum= li.find_all("li")[0].text.strip() #已售数量
price= li.select("li>a._j_search_link")[0].text.strip() #价格
item.append([h3text, href, p, solenum, price])
urls.append(href)#链接集合
#数据持久化
S = pd.ExcelWriter("JingDianList.xlsx")
pf= pd.DataFrame( item, columns=["h3text", "href", "p", "solenum", "price"])
pf.to_excel(S)
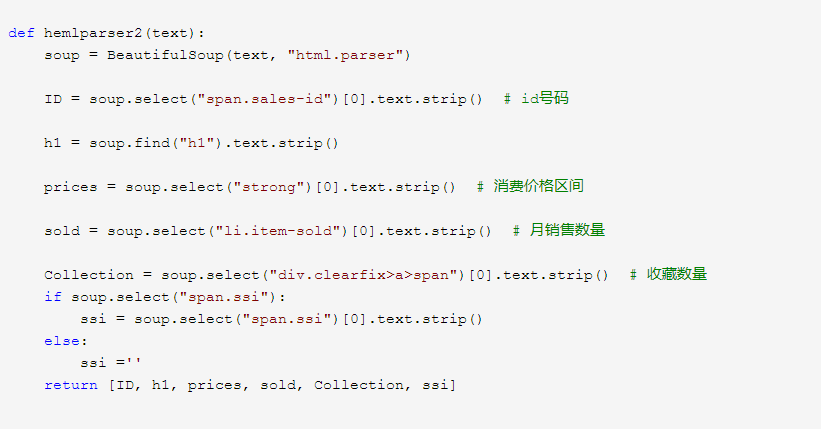
S.save()defhemlparser2(text):
soup= BeautifulSoup(text, "html.parser")
ID= soup.select("span.sales-id")[0].text.strip() #id号码
h1= soup.find("h1").text.strip()
prices= soup.select("strong")[0].text.strip() #消费价格区间
sold= soup.select("li.item-sold")[0].text.strip() #月销售数量
Collection= soup.select("div.clearfix>a>span")[0].text.strip() #收藏数量
if soup.select("span.ssi"):
ssi= soup.select("span.ssi")[0].text.strip()else:
ssi=''
return[ID, h1, prices, sold, Collection, ssi]if __name__ == "__main__":
item=[]
urls=[]
List=[]#泉州地区链接
url = "http://www.mafengwo.cn/search/q.php?t=sales&q=%E6%B3%89%E5%B7%9E"resourcetext=resourceHtml(url)#print(resourcetext)
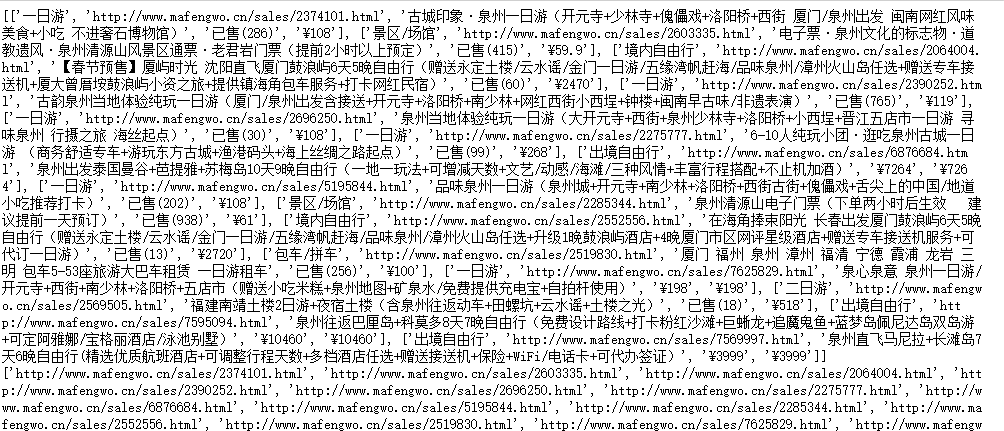
hemlparser(item, resourcetext, urls)#保存列表数据
#print(item)
#print(urls)
for url inurls:
text=resourceHtml(url)
List.append(hemlparser2(text))#数据持久化
S = pd.ExcelWriter("JingDian.xlsx")
pf= pd.DataFrame(List, columns=["ID", "h1", "prices", "sold", "Collection", "ssi"])
pf.to_excel(S)#保存详细数据
S.save()
四、结论(10分)
1.经过对主题数据的分析与可视化,可以得到哪些结论?
通过马蜂窝泉州景点的数据分析和可视化,可以发现景点选择票价在108到138的占比最大,而59到110多的人反而才占第二,令人惊讶的是2千到7千的占百分之14,说明大多数人都是来玩几天的,而非短暂的旅行,而消费高的评分往往也不低。
2.对本次程序设计任务完成的情况做一个简单的小结。
通过这次对马蜂窝景点数据信息的爬取,我明确意识到自己还有极大的知识缺漏,在学习过程中,我求助同学,上网查找资料,及时解决问题,先理清思路,清楚自己到底做什么,下一步应该如何,循序渐进,虽然代码非常粗糙,但是我对python的知识又更进了一步,我会继续学习的。


 371
371


 被折叠的 条评论
为什么被折叠?
被折叠的 条评论
为什么被折叠?
 到【灌水乐园】发言


