![7ba1023e1fd922eb2496cb0283ca838a.png](https://img-blog.csdnimg.cn/img_convert/7ba1023e1fd922eb2496cb0283ca838a.png)
----------1992年-2008年----------
按下市时间排序
![c0ce13e0cedad5b663cbda83b49d45f5.png](https://img-blog.csdnimg.cn/img_convert/c0ce13e0cedad5b663cbda83b49d45f5.png)
![47ac08edc0d7429fcd839f71cf59471c.png](https://img-blog.csdnimg.cn/img_convert/47ac08edc0d7429fcd839f71cf59471c.png)
![d11a5a94eb61c6d04090dd14aee62eeb.png](https://img-blog.csdnimg.cn/img_convert/d11a5a94eb61c6d04090dd14aee62eeb.png)
从1992年-2008年,59只可转债,宝安转债为特殊历史条件造成的特例,不具备普遍性。剩余58只,有25只曾经跌破面值100元,占比43.1%。強赎转股51只,占比86%。
1、最低价低于面值统计:
以上可转债中最低价,南山转债82.7元;其余最低价大多在95元以上。
2、最低价高于面值统计:
最低价高于面值的,占比56.9%。105元以上的有13只,110元以上的有5只,129元以上的有2只。
——数据来源于《可转债投资魔法书——安道全》
----------2008年-2020年----------
按发行时间排序
![b85451875458e1d217d4aed5f0050d7d.png](https://img-blog.csdnimg.cn/img_convert/b85451875458e1d217d4aed5f0050d7d.png)
![564bf4fc598992e18f97f5c37397c62f.png](https://img-blog.csdnimg.cn/img_convert/564bf4fc598992e18f97f5c37397c62f.png)
![fd270aa64122b89841f41c89bf69fefd.png](https://img-blog.csdnimg.cn/img_convert/fd270aa64122b89841f41c89bf69fefd.png)
![310941612681a059bd2fc9ff4fb8b74a.png](https://img-blog.csdnimg.cn/img_convert/310941612681a059bd2fc9ff4fb8b74a.png)
![c8e77e3a7372ec7494ca5b69427c687c.png](https://img-blog.csdnimg.cn/img_convert/c8e77e3a7372ec7494ca5b69427c687c.png)
![80e4e640c9c82c8916c186a397e13664.png](https://img-blog.csdnimg.cn/img_convert/80e4e640c9c82c8916c186a397e13664.png)
![075b58a0ba6718c665331902acad5595.png](https://img-blog.csdnimg.cn/img_convert/075b58a0ba6718c665331902acad5595.png)
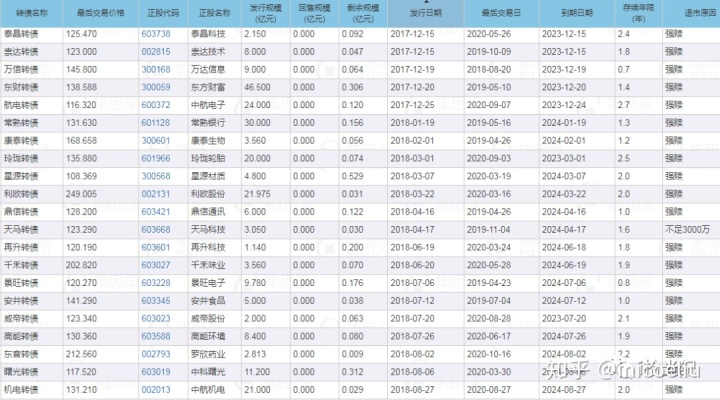
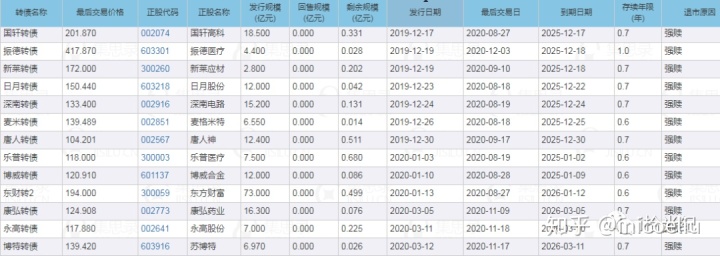
从2008年-2020年,126只可转债(里边名字带小写数字的可以自行忽略)。3只到期,5只剩余规模低于约定強赎,118只強赎转股,占比93%。
——数据来源集思录
如果看K线,历史数据中妖股无数,风起云涌,那真是风景这边大好!
以上数据可能有遗漏,不完全代表所有历史数据。可分析指标也非常多,仅供参考。