


前言
常用地图底图的绘制一般由basemap或者cartopy模块完成,由于basemap库是基于python2开发的一个模块,目前已经不开发维护。故简单介绍cartopy模块的一些基础操作。 一、基础介绍
首先导入相关模块。
import numpy as np
import matplotlib.pyplot as plt
import cartopy.crs as ccrs
import cartopy.feature as cfeature
from cartopy.mpl.ticker import longitudeformatter, latitudeformatter
首先介绍参数projection,该命令可以配合ccrs设置投影类型,此处以方形投影命令为示例。其中central_longitude参数为投影中心位置。其中心设置与basemap设置规则一样,详情可以看上一篇文章。
ax=plt.axes(projection=ccrs.platecarree(central_longitude=0))
在设置好绘制类型后,绘制地图各特征量。其代码如下:
#ax.add_feature(cfeature.lakes.with_scale(scale))
ax.add_feature(cfeature.ocean.with_scale(scale))
#ax.add_feature(cfeature.rivers.with_scale(scale))
#ax.add_feature(cfeature.land.with_scale(scale),lw=0.5)
ax.add_feature(cfeature.coastline.with_scale(scale),lw=2)
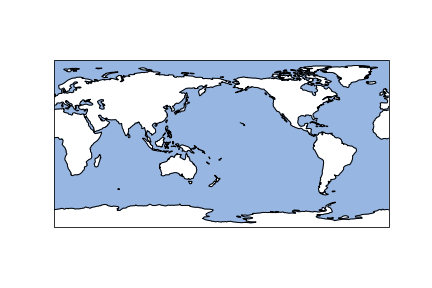
参数scale为地图分辨率,目前支持10m,50m,110m,参数lw为线条粗细。此处绘制海岸线和海洋,效果图如下:
在绘制结束后,作为地图。经纬度自然是必不可少的,在该模块中,引进同时设置坐标轴标签改变该标签刻度的表示,具体形式如下:
ax.set_xticks(np.arange(0,361,40), crs=ccrs.platecarree())
ax.set_yticks(np.arange(-90,90+30,30), crs=ccrs.platecarree())
#zero_direction_label用来设置经度的0度加不加e和w
lon_formatter = longitudeformatter(zero_direction_label=false)
lat_formatter = latitudeformatter()
ax.xaxis.set_major_formatter(lon_formatter)
ax.yaxis.set_major_formatter(lat_formatter)
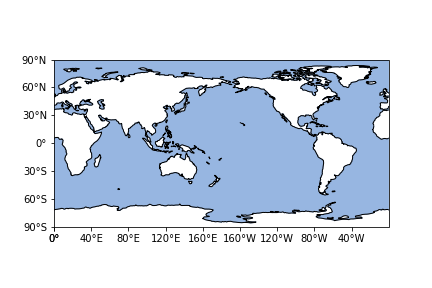
可以看到效果图如下:
当然如果想对坐标轴粗细变化可以引入一下命令。
ax.outline_patch.set_visible(false)
ax.spines['bottom'].set_visible(true)
ax.spines['left'].set_visible(true)
ax.spines['right'].set_visible(true)
ax.spines['top'].set_visible(true)
ax.spines['bottom'].set_linewidth(2.5);###设置底部坐标轴的粗细
ax.spines['left'].set_linewidth(2.5);####设置左边坐标轴的粗细
ax.spines['right'].set_linewidth(2.5);###设置右边坐标轴的粗细
ax.spines['top'].set_linewidth(2.5);####设置上部坐标轴的粗细
应该在该模块下,控制坐标轴的命令已经和常规不一样。因此先关闭该控制,然后开启常规坐标轴设置。
二、区域地图的绘制
当我们在某一小块区域研究时,需要绘制区域地图。此时我们可以引入命令:
ax.set_extent(box,crs=ccrs.platecarree())
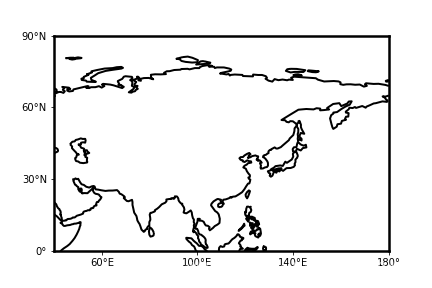
其中box为绘制区域,crs为投影类型。其他命令基本不变。设置box为[40,180,0,90],可得到效果图如下:
总结
为方便各位读者,我书写了绘制地图的函数,大家在使用时可直接调用。此处示例为方形投影,若希望绘制其他投影。只需要修改函数部分参数即可。代码如下:
def map_make(scale,box,xstep,ystep):
ax=plt.axes(projection=ccrs.platecarree(central_longitude=180))
a = (box[1]-box[0])//xstep
x_start = box[1] - a*xstep
a = (box[3]-box[2])//ystep
y_start = box[3] - a*ystep
ax.set_extent(box,crs=ccrs.platecarree())
#ax.add_feature(cfeature.lakes.with_scale(scale))
#ax.add_feature(cfeature.ocean.with_scale(scale))
#ax.add_feature(cfeature.rivers.with_scale(scale))
#ax.add_feature(cfeature.land.with_scale(scale),lw=0.5)
ax.add_feature(cfeature.coastline.with_scale(scale),lw=2)
ax.set_xticks(np.arange(x_start,box[1]+xstep,xstep), crs=ccrs.platecarree())
ax.set_yticks(np.arange(y_start,box[3]+ystep,ystep), crs=ccrs.platecarree())
#zero_direction_label用来设置经度的0度加不加e和w
lon_formatter = longitudeformatter(zero_direction_label=false)
lat_formatter = latitudeformatter()
ax.xaxis.set_major_formatter(lon_formatter)
ax.yaxis.set_major_formatter(lat_formatter)
#添加网格线
ax.grid()
ax.outline_patch.set_visible(false)
ax.spines['bottom'].set_visible(true)
ax.spines['left'].set_visible(true)
ax.spines['right'].set_visible(true)
ax.spines['top'].set_visible(true)
ax.spines['bottom'].set_linewidth(2.5);###设置底部坐标轴的粗细
ax.spines['left'].set_linewidth(2.5);####设置左边坐标轴的粗细
ax.spines['right'].set_linewidth(2.5);###设置右边坐标轴的粗细
ax.spines['top'].set_linewidth(2.5);####设置上部坐标轴的粗细
return ax
到此这篇关于python cartopy的基础使用详解的文章就介绍到这了,更多相关python cartopy内容请搜索萬仟网以前的文章或继续浏览下面的相关文章希望大家以后多多支持萬仟网!
希望与广大网友互动??
点此进行留言吧!


 986
986


 被折叠的 条评论
为什么被折叠?
被折叠的 条评论
为什么被折叠?
 到【灌水乐园】发言


