


A speech recording includes an echo caused by reflection off a wall. Use the real cepstrum to filter it out.
In the recording, a person says the word MATLAB®. Load the data and the sample rate, Fs=7418Hz.
load mtlb
% To hear, type soundsc(mtlb,Fs)
Model the echo by adding to the recording a copy of the signal delayed by Δ samples and attenuated by a known factor α: y(n)=x(n)+αx(n-Δ). Specify a time lag of 0.23 s and an attenuation factor of 0.5.
timelag = 0.23;
delta = round(Fs*timelag);
alpha = 0.5;
orig = [mtlb;zeros(delta,1)];
echo = [zeros(delta,1);mtlb]*alpha;
mtEcho = orig + echo;
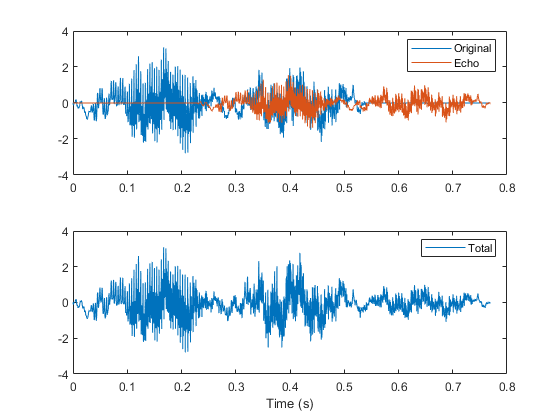
Plot the original, the echo, and the resulting signal.
t = (0:length(mtEcho)-1)/Fs;
subplot(2,1,1)
plot(t,[orig echo])
legend('Original','Echo')
subplot(2,1,2)
plot(t,mtEcho)
legend('Total')
xlabel('Time (s)')
% To hear, type soundsc(mtEcho,Fs)
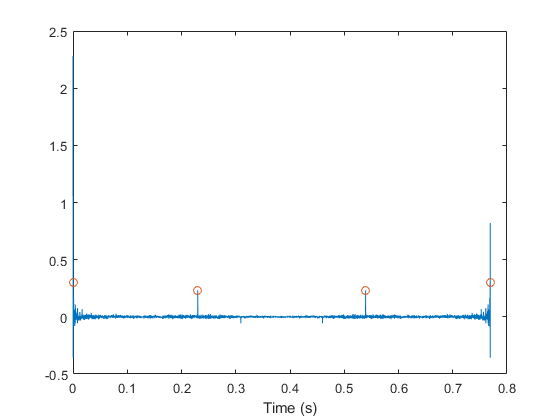
Compute the real cepstrum of the signal. Plot the cepstrum and annotate its maxima. The cepstrum has a sharp peak at the time at which the echo starts to arrive.
c = rceps(mtEcho);
[px,locs] = findpeaks(c,'Threshold',0.2,'MinPeakDistance',0.2);
clf
plot(t,c,t(locs),px,'o')
xlabel('Time (s)')
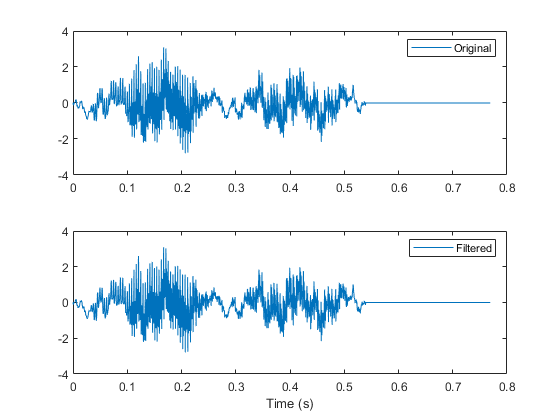
Cancel the echo by filtering the signal through an IIR system whose output, w, obeys w(n)+αw(n-Δ)=y(n). Plot the filtered signal and compare it to the original.
dl = locs(2)-1;
mtNew = filter(1,[1 zeros(1,dl-1) alpha],mtEcho);
subplot(2,1,1)
plot(t,orig)
legend('Original')
subplot(2,1,2)
plot(t,mtNew)
legend('Filtered')
xlabel('Time (s)')
% To hear, type soundsc(mtNew,Fs)


 4万+
4万+


 被折叠的 条评论
为什么被折叠?
被折叠的 条评论
为什么被折叠?
 到【灌水乐园】发言


