


import vincent
world_countries = r'world-countries.json'
world = vincent.Map(width=1200, height=1000)
world.geo_data(projection='winkel3', scale=200, world=world_countries)
world.to_json(path)
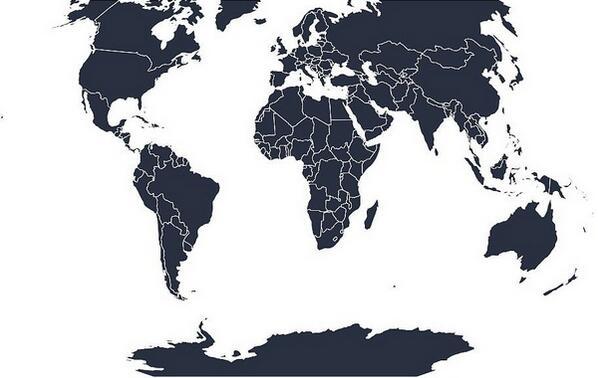
当我开始建造Vincent时, 我的一个目的就是使得地图的建造尽可能合理化. 有一些很棒的python地图库-参见Basemap 和 Kartograph能让地图更有意思. 我强烈推荐这两个工具, 因为他们都很好用而且很强大. 我想有更简单一些的工具,能依靠Vega的力量并且允许简单的语法点到geoJSON文件,详细描述一个投影和大小/比列,***输出地图.
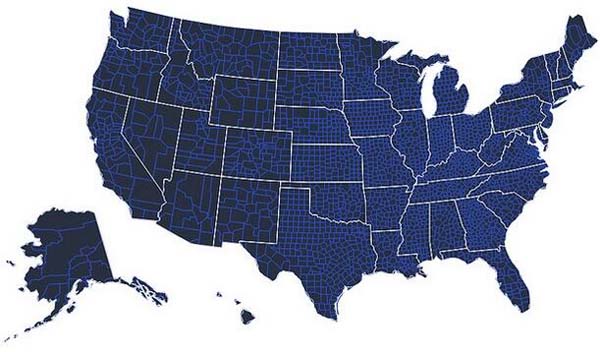
例如, 将地图数据分层来建立更复杂的地图:
vis = vincent.Map(width=1000, height=800)
#Addthe US county dataanda new line color
vis.geo_data(projection='albersUsa', scale=1000, counties=county_geo)
vis + ('2B4ECF','marks', 0,'properties','enter','stroke','value')
#Addthe state data, remove the fill, write Vega specoutputtoJSON
vis.geo_data(states=state_geo)
vis - ('fill','marks', 1,'properties','enter')
vis.to_json(path)
加之,等值线地图需绑定Pandas数据,需要数据列直接映射到地图要素.假设有一个从geoJSON到列数据的1:1映射,它的语法是非常简单的:
#'merged'isthe Pandas DataFrame
vis = vincent.Map(width=1000, height=800)
 最低0.47元/天 解锁文章


 1万+
1万+


 被折叠的 条评论
为什么被折叠?
被折叠的 条评论
为什么被折叠?
 到【灌水乐园】发言


