


A) c++ memory/heap corrupt debug 技巧
1. catch first exception
2. data breakpoint
VC tell us some address is corrupt when free some pointer
Check which pointer it is
Set break point when malloc the pointer
Set data breakpoint at the corrupt address after the pointer is malloc
VC will break at the place which corrupts memory
3. application verifier heap check 功能
4.
B) c++ memory leakage
注:需要管理员权限(gflags需要),能上网(会自动下载symbols)
主要有几个需求
一是dump leakage,可以用1,3实现
二是显示leakage的call stack,可以用1,2实现
而2的用法是比较两次快照,1可以在程序退出时做
1. windbg
set _NT_SYMBOL_PATH=SRV*C:\MyLocalSymbols*http://msdl.microsoft.com/download/symbols
run gflags to enable the stack trace of the program
start the program
start windbg and attach to the program
bm wineagle!_CrtDumpMemoryLeaks
make the program leak memory
exit program
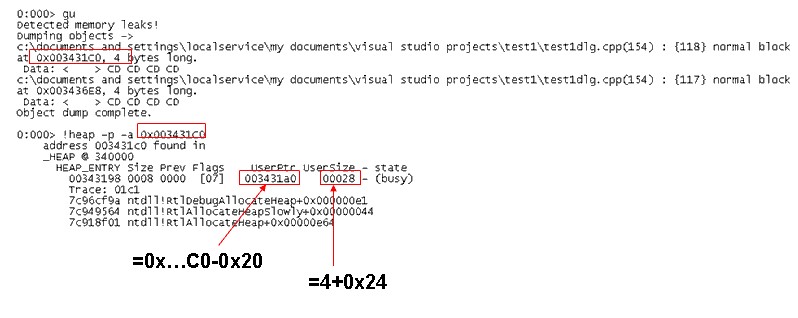
the program will break into windbg
step out by gu command
!heap -p -a <ADDR> where ADDR is the dumped leakage address
2. umdh
set _NT_SYMBOL_PATH=SRV*C:\MyLocalSymbols*http://msdl.microsoft.com/download/symbols
Gflags to enable OS log stack trace
restart the debugee program
-1- umdh.exe -pn:application_name.exe -f:FirstDump.txt
-2- ... exercise the application
-3- umdh.exe -pn:application_name.exe -f:SecondDump.txt
-4- umdh.exe FirstDump.txt SecondDump.txt -f:Result.txt
Compares allocations from the two dumps.
3. vc crt lib dump leakage
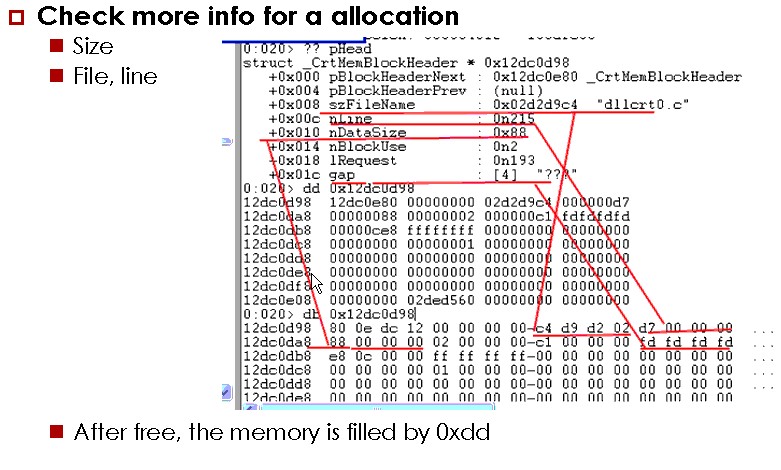
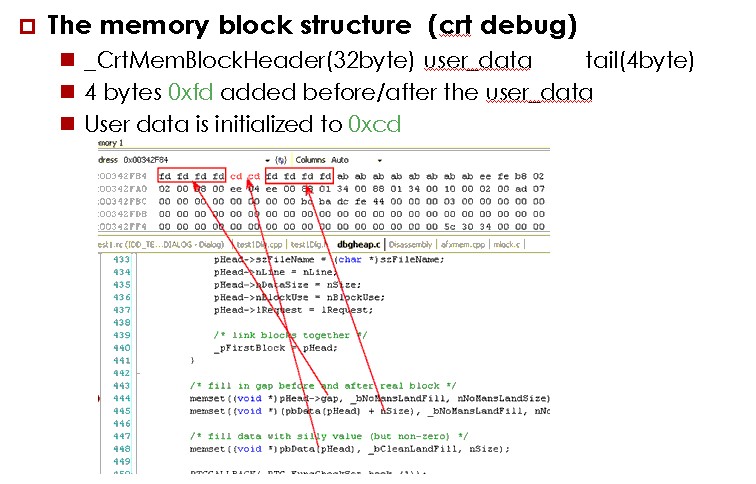
C) crt内存结构
Crt: _CrtSetDbgFlag, _CrtCheckMemory
D)关于gflags的heap类型
Gflags:
Full-page heap: placing a non-accessible page at the end of the allocation
Normal page heap: It checks fill patterns when a heap block is freed
Advantage: reduces memory consumption
Disadvantage
E) windbg extension
http://www.codeproject.com/Articles/6522/Debug-Tutorial-Part-4-Writing-WINDBG-Extensions
http://www.haogongju.net/art/1428822
??Debugging Tools for Windows, ?%programfiles%\ Debugging Tools for Windows (x86)\sdk????.
??:
Sdk\inc: ?????
??Dump???Callstack,??windbg???????
Sdk\lib:?????,dbghelp.lib,dbgeng.lib,engextcpp.lib,??????????
??Dump???Callstack,??windbg???????
Sdk\samples: samples(???????)
??Dump???Callstack,??windbg???????
Sdk\help:????
F)
Windows Performance Analyzer
http://msdn.microsoft.com/en-us/library/windows/desktop/ff190971%28v=vs.85%29.aspx
Write a debugger
http://social.msdn.microsoft.com/Forums/en-US/netfxbcl/thread/90770a1c-7f83-4f81-864f-e64f3e17d02b
You can use mdbg as a model for a debugger implementation, it comes with source code and you will find a lot of references about it . Depending on the type of debugging you want to do there are two APIs you can use: - for native applications you should use the native debugging API :爃ttp://msdn.microsoft.com/en-us/library/ms679304(VS.85).aspx
- for managed applications the managed debugging API :爃ttp://msdn.microsoft.com/en-us/library/ms404520.aspx
Both come with samples, for example this (http://msdn.microsoft.com/en-us/library/ms679288(VS.85).aspx) is an example of building a basic debugger using the native API. I also recommend Mike Stall's debugging blog爃ttp://blogs.msdn.com/jmstall/default.aspx.
Creating a Basic Debugger
http://msdn.microsoft.com/en-us/library/ms679288%28VS.85%29.aspx
Sample code for PDB 2 XML tool
http://blogs.msdn.com/b/jmstall/archive/2005/08/25/sample-pdb2xml.aspx
Tool to get snapshot of managed callstacks
http://blogs.msdn.com/b/jmstall/archive/2005/11/28/snapshot.aspx


 5370
5370


 被折叠的 条评论
为什么被折叠?
被折叠的 条评论
为什么被折叠?
 到【灌水乐园】发言


