[ASP.NET Debugging BuggyBits读书笔记] Lab03 Memory

原文来自:http://blogs.msdn.com/b/tess/archive/2008/02/20/net-debugging-demos-lab-3-memory-review.aspx

1. 打开Performance Monitor。在Counter Logs里添加New Log Settings,命名为Lab3-Mem。添加的Log对象为.NET CLR Memory和Process。

2. 使用TinyGet执行命令个 tinyget –srv:localhost –uri:/buggybits/links.aspx –loop:4000

3. 命令执行以后,可以看到w3wp.exe进程的大小持续增长,并且在tinyeget命令结束以后,程序所站大小仍然不减:

image

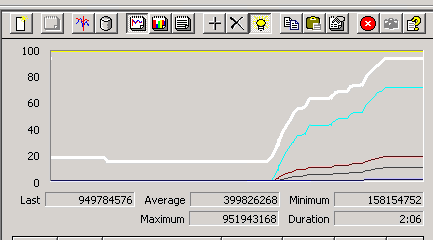
4. 等待一段时间以后,在Performance monitor里面打开刚才存储的日志,添加Process对象的Virtual bytes和Private Bytes计数器,添加.NET CLR Memory对象的Bytes in all Heaps计数器,将他们的scale调整为0.00000001:

03114219_1PTw.png

可见随着Bytes in All heaps(紫红)的增长,进程的virtual bytes(白色)和Private Bytes(青色)也在增长。因此可以判定是.NET进程的heap的增长带来了内存消耗的增长,并且内存增长之后没有回收。

5.  切换到WinDbg目录在命令行执行 adplus –hang –pn w3wp.exe –quiet 注意此时应该将应用程序池的各种Recycle选项全部关闭。否则可能因为抓取时间太长,w3wp.exe进程关闭,hang dump抓取失败。

6. 使用WinDbg打开刚才得到的dump文件。执行 .loadby sos.dll mscorwks

7. 执行 !eeheap -gc查看GC的情况,可见有一个heap,因为是单核。如果是双核,则会有两个heap。Heap大小为700多兆,可见是heap出问题了。

image

image

8. 执行 !dumpheap –stat:

image

可见System.String占据了大部分的内存空间。

9. 执行 !dumpheap –type Link并终止输出。找到其中一个object的地址02eab13c,执行 !do 02eab13c:可以发现Stringbuilder和System.String都是包含在Link类型中的类型。

image

这就解释了!dumpheap –stat中看到的占据heap最多的对象的类型的内存占用情况。

10. 执行 !dumpheap –type System.String 并强行终止输出。以其中一个对象的地址 027da238为例,执行 !do 027da238,可以找到这个string对象存储的值。

image

11. 为了找到为什么该对象没有被回收,查看哪些线程对它还有root,因此执行命令 !gcroot 027da238:

image

可见Finalizer queue对其有引用,因此可以推断Finalizer queue还没有对这个对象执行Finalize方法。

12. 执行 !threads找到Finalize queue的线程是 17:

image

13. 执行 ~17s切换到该线程。执行 !clrstack:

image

可见这就是Finalize queue上对该对象的root一直保持着的原因:线程休眠了。

14. 在App_Code文件夹里找到哦啊Link.cs:

image

可见该对象规定了Finalize方法,因此会被放到Finalize queue上去。而这个方法里面,导致执行该方法的Finalize线程休眠了,所以对象一直有引用,内存得不到释放。

20110218添加:

一、本例被判定为High Memory的问题。这样的问题有三种情况,一是Manged Memory泄漏,二是Native Memory泄漏,第三是Load Library出问题。对于这三种情况,可以通过Performance Monitor来进行基本判定。其中.NET CLR Memory object的#bytes in all heaps 这个counter,Process Object的Virutual Bytes和Private bytes这两个counter。

  1. 如果是Managed Memory泄漏,那么bytes in all heaps,private bytes和virtual bytes会同市上升。

  2. 如果是Native Memory泄漏,那么bytes in all heaps不会上升,但是private bytes和virtual bytes都会上升。

  3. 如果是Load Library的问题,那么bytes in all heaps和private bytes都不会上升,但是virutal bytes会上升。

二、本例debug时首先执行了!address -summary 命令,得到如下结果:


0:000> !address -summary
-------------------- Usage SUMMARY --------------------------
    TotSize (      KB)   Pct(Tots) Pct(Busy)   Usage
   373b7000 (  904924) : 21.58%    85.85%    : RegionUsageIsVAD
   bfa89000 ( 3140132) : 74.87%    00.00%    : RegionUsageFree
    76e6000 (  121752) : 02.90%    11.55%    : RegionUsageImage
     67c000 (    6640) : 00.16%    00.63%    : RegionUsageStack
          0 (       0) : 00.00%    00.00%    : RegionUsageTeb
    144a000 (   20776) : 00.50%    01.97%    : RegionUsageHeap
          0 (       0) : 00.00%    00.00%    : RegionUsagePageHeap
       1000 (       4) : 00.00%    00.00%    : RegionUsagePeb
       1000 (       4) : 00.00%    00.00%    : RegionUsageProcessParametrs
       2000 (       8) : 00.00%    00.00%    : RegionUsageEnvironmentBlock
       Tot: ffff0000 (4194240 KB) Busy: 40567000 (1054108 KB)

-------------------- Type SUMMARY --------------------------
    TotSize (      KB)   Pct(Tots)  Usage
   bfa89000 ( 3140132) : 74.87%   :834e000 (  134456) : 03.21%   : MEM_IMAGE
     95a000 (    9576) : 00.23%   : MEM_MAPPED
   378bf000 (  910076) : 21.70%   : MEM_PRIVATE

-------------------- State SUMMARY --------------------------
    TotSize (      KB)   Pct(Tots)  Usage
   34bea000 (  864168) : 20.60%   : MEM_COMMIT
   bfa89000 ( 3140132) : 74.87%   : MEM_FREE
    b97d000 (  189940) : 04.53%   : MEM_RESERVE

Largest free region: Base 80010000 - Size 7fefa000 (2096104 KB)

从这里面可以得到的信息由:

  1. RegionUsageIsVAD占有最多的内存份额,它与GCHeap相关。

  2. Pct(Tots)指的是该部分memory占总共的virtual memory的比例,而Pct(Busy)指的是该部分memory占Private memory的比例。

三、由于已经能够判定是Managed Memory有问题,我们需要进一步查看是Managed Memory的哪一步有问题,因此执行!eeheap -gc 对GC占有的memory进行enumerate:


0:000> !eeheap -gc Number of GC Heaps: 2 ------------------------------
Heap 0 (001aa148)
generation 0 starts at 0x32f0639c
generation 1 starts at 0x32ae3754
generation 2 starts at 0x02eb0038
ephemeral segment allocation context: none
 segment    begin allocated     size
001bfe10 7a733370  7a754b98 0x00021828(137256)
001b0f10 790d8620  790f7d8c 0x0001f76c(128876)
02eb0000 02eb0038  06eacb28 0x03ffcaf0(67095280)
100b0000 100b0038  140a4a08 0x03ff49d0(67062224)
18180000 18180038  1c15c650 0x03fdc618(66962968)
20310000 20310038  242eb99c 0x03fdb964(66959716)
28310000 28310038  2c2f04cc 0x03fe0494(66978964)
31190000 31190038  33185ff4 0x01ff5fbc(33513404)
Large object heap starts at 0x0aeb0038
 segment    begin allocated     size
0aeb0000 0aeb0038  0aec0b28 0x00010af0(68336)
Heap Size  0x15fd1310(368907024)
------------------------------
Heap 1 (001ab108)
generation 0 starts at 0x36e665bc
generation 1 starts at 0x36a28044
generation 2 starts at 0x06eb0038
ephemeral segment allocation context: none
 segment    begin allocated     size
06eb0000 06eb0038  0aea58d4 0x03ff589c(67066012)
14180000 14180038  1817eda8 0x03ffed70(67104112)
1c310000 1c310038  202f0550 0x03fe0518(66979096)
24310000 24310038  28304ca8 0x03ff4c70(67062896)
2c310000 2c310038  2fd62a48 0x03a52a10(61155856)
35190000 35190038  372253f4 0x020953bc(34165692)
Large object heap starts at 0x0ceb0038
 segment    begin allocated     size
0ceb0000 0ceb0038  0ceb0048 0x00000010(16)
Heap Size  0x15ab1570(363533680)
------------------------------ GC Heap Size  0x2ba82880(732440704)

 四、执行!dumpheap -stat查看heap中各种类型占用的内存的大小。这里原文重点解释了Size的意义,用!dumpheap -stat 得到的类型的size值得话并不真实,因为有的对象只是包含了一个别的对象的引用而已,因而计算大小的话只会计算指针大小。需要使用!objsize才能计算出真正的大小。

五、由于对象没有被回收,是因为他们的引用没有得到释放。因此执行!gcroot <address of an object>查看可以的对象的引用情况。

六、在得知对象没有被引用的原因是对象正在被Finalize的过程中时,可以执行!FinalizeQueue查看这个queue引用了哪些对象。这里原文强调了为什么对象会被FinalizeQueue引用:只有默认具有析构函数的系统类型或者显式定义了析构函数的类型的对象,才会在Garbage Collect的时候,被Finalize Queue引用执行其Destructor的方法。

转载于:https://my.oschina.net/u/587236/blog/119552

  • 0
    点赞
  • 0
    收藏
    觉得还不错? 一键收藏
  • 0
    评论
Introduction The usual implementation of malloc and free are unforgiving to errors in their callers' code, including cases where the programmer overflows an array, forgets to free memory, or frees a memory block twice. This often does not affect the program immediately, waiting until the corrupted memory is used later (in the case of overwrites) or gradually accumulating allocated but unused blocks. Thus, debugging can be extremely difficult. In this assignment, you will write a wrapper for the malloc package that will catch errors in the code that calls malloc and free. The skills you will have learned upon the completion of this exercise are pointer arithmetic and a greater understanding of the consequences of subtle memory mistakes. Logistics Unzip debugging_malloc.zip into an empty directory. The files contained are as follows: File(s): Function: debugmalloc.c Contains the implementation of the three functions you will be writing. This is the one file you will be editing and handing in. debugmalloc.h Contains the declaration of the functions, as well as the macros that will call them. driver.c Contains main procedure and the code that will be calling the functions in the malloc package dmhelper.c, dmhelper.h Contain the helper functions and macros that you will be calling from your code grader.pl Perl script that runs your code for the various test cases and gives you feedback based on your current code debugmalloc.dsp Exercise 3 project file debugmalloc.dsw Exercise 3 workspace file tailor.h, getopt.c, getopt.h Tools that are used only by the driver program for I/O purposes. You will not need to know what the code in these files do. Others Required by Visual C++. You do not need to understand their purpose Specification Programs that use this package will call the macros MALLOC and FREE. MALLOC and FREE are used exactly the same way as the malloc() and free() functions in the standard C malloc package. That is, the line void *ptr = MALLOC ( n ) ;will allocate a payload of at least n bytes, and ptr will point to the front of this block. The line FREE(ptr);will cause the payload pointed to by ptr to be deallocated and become available for later use. The macros are defined as follows: #define MALLOC(s) MyMalloc(s, __FILE__, __LINE__) #define FREE(p) MyFree(p, __FILE__, __LINE__) The __FILE__ macro resolves to the filename and __LINE__ resolves to the current line number. The debugmalloc.c file contains three functions that you are required to implement, as shown: void *MyMalloc(size_t size, char *filename, int linenumber); void MyFree(void *ptr, char *filename, int linenumber); int AllocatedSize(); Using the macros above allow MyMalloc and MyFree to be called with the filename and line number of the actual MALLOC and FREE calls, while retaining the same form as the usual malloc package. By default, MyMalloc and MyFree() simply call malloc() and free(), respectively, and return immediately. AllocatedSize() should return the number of bytes currently allocated by the user: the sum of the requested bytes through MALLOC minus the bytes freed using FREE. By default, it simply returns 0 and thus is unimplemented. The definitions are shown below: void *MyMalloc(size_t size, char *filename, int linenumber) { return (malloc(size)); } void MyFree(void *ptr, char *filename, int linenumber) { free(ptr); } int AllocatedSize() { return 0; } Your job is to modify these functions so that they will catch a number of errors that will be described in the next section. There are also two optional functions in the debugmalloc.c file that you can implement: void PrintAllocatedBlocks(); int HeapCheck(); PrintAllocatedBlocks should print out information about all currently allocated blocks. HeapCheck should check all the blocks for possible memory overwrites. Implementation Details To catch the errors, you will allocate a slightly larger amount of space and insert a header and a footer around the "requested payload". MyMalloc() will insert information into this area, and MyFree() will check to see if the information has not changed. The organization of the complete memory block is as shown below: Header Checksum ... Fence Payload Footer Fence Note:MyMalloc() returns a pointer to the payload, not the beginning of the whole block. Also, the ptr parameter passed into MyFree(void *ptr) will point to the payload, not the beginning of the block. Information that you might want to store in this extra (header, footer) area include: a "fence" immediately around the requested payload with a known value like 0xCCDEADCC, so that you can check if it has been changed when the block is freed. the size of the block a checksum for the header to ensure that it has not been corrupted (A checksum of a sequence of bits is calculated by counting the number of "1" bits in the stream. For example, the checksum for "1000100010001000" is 4. It is a simple error detection mechanism.) the filename and line number of the MALLOC() call The errors that can occur are: Error #1: Writing past the beginning of the user's block (through the fence) Error #2: Writing past the end of the user's block (through the fence) Error #3: Corrupting the header information Error #4: Attempting to free an unallocated or already-freed block Error #5: Memory leak detection (user can use ALLOCATEDSIZE to check for leaks at the end of the program) To report the first four errors, call one of these two functions: void error(int errorcode, char *filename, int linenumber); errorcode is the number assigned to the error as stated above. filename and linenumber contain the filename and line number of the line (the free call) in which the error is invoked. For example, call error(2, filename, linenumber) if you come across a situation where the footer fence has been changed. void errorfl(int errorcode, char *filename_malloc, int linenumber_malloc, char *filename_free, int linenumber_free); This is the same as the error(), except there are two sets of filenames and line numbers, one for the statement in which the block was malloc'd, and the other for the statement in which the block was free'd (and the error was invoked). The fact that MyMalloc() and MyFree() are given the filename and line number of the MALLOC() and FREE() call can prove to be very useful when you are reporting errors. The more information you print out, the easier it will be for the programmer to locate the error. Use errorfl() instead of error() whenever possible. errorfl() obviously cannot be used on situations where FREE() is called on an unallocated block, since it was not ever MALLOC'd. Note: You will only be reporting errors from MyFree(). None of the errors can be caught in MyMalloc() In the case of memory leaks, the driver program will call AllocatedSize(), and the grader will look at its return value and possible output. AllocatedSize() should return the number of bytes currently allocated from MALLOC and FREE calls. For example, the code segment: void *ptr1 = MALLOC(10), *ptr2 = MALLOC(8); FREE(ptr2); printf("%d\n", AllocatedSize()); should print out "10". Once you have gotten to the point where you can catch all of the errors, you can go an optional step further and create a global list of allocated blocks. This will allow you to perform analysis of memory leaks and currently allocated memory. You can implement the void PrintAllocatedBlocks() function, which prints out the filename and line number where all currently allocated blocks were MALLOC()'d. A macro is provided for you to use to print out information about a single block in a readable and gradeable format: PRINTBLOCK(int size, char *filename, int linenumber) Also, you can implement the int HeapCheck() function. This should check all of the currently allocated blocks and return -1 if there is an error and 0 if all blocks are valid. In addition, it should print out the information about all of the corrupted blocks, using the macro #define PRINTERROR(int errorcode, char *filename, int linenumber), with errorcode equal to the error number (according to the list described earlier) the block has gone through. You may find that this global list can also allow you to be more specific in your error messages, as it is otherwise difficult to determine the difference between an overwrite of a non-payload area and an attempted FREE() of an unallocated block. Evaluation You are given 7 test cases to work with, plus 1 extra for testing a global list. You can type "debugmalloc -t n" to run the n-th test. You can see the code that is being run in driver.c. If you have Perl installed on your machine, use grader.pl to run all the tests and print out a table of results. There are a total of 100 possible points. Here is a rundown of the test cases and desired output (do not worry about the path of the filename): Test case #1 Code char *str = (char *) MALLOC(12); strcpy(str, "123456789"); FREE(str); printf("Size: %d\n", AllocatedSize()); PrintAllocatedBlocks(); Error # None Correct Output Size: 0 Points worth 10 Details 10 points for not reporting an error and returning 0 in AllocatedSize() Test case #2 Code char *str = (char *) MALLOC(8); strcpy(str, "12345678"); FREE(str); Error # 2 Correct Output Error: Ending edge of the payload has been overwritten. in block allocated at driver.c, line 21 and freed at driver.c, line 23 Points worth 15 Details 6 pts for catching error 3 pts for printing the filename/line numbers 6 pts for correct error message Test case #3 Code char *str = (char *) MALLOC(2); strcpy(str, "12"); FREE(str); Error # 2 Correct Output Error: Ending edge of the payload has been overwritten. in block allocated at driver.c, line 28 and freed at driver.c, line 30 Points worth 15 Details 6 pts for catching error 3 pts for printing the filename/line numbers 6 pts for correct error message Test case #4 Code void *ptr = MALLOC(4); *ptr2 = MALLOC(6); FREE(ptr); printf("Size: %d\n", AllocatedSize()); PrintAllocatedBlocks(); Error # None Correct Output Size: 6 Currently allocated blocks: 6 bytes, created at driver.c, line 34 Points worth 15 Details 15 pts for not reporting an error and returning 6 from AllocatedSize Extra for printing out the extra block Test case #5 Code void *ptr = MALLOC(4); FREE(ptr); FREE(ptr); Error # 4 Correct Output Error: Attempting to free an unallocated block. in block freed at driver.c, line 43 Points worth 15 Details 15 pts for catching error Extra for correct error message Test case #6 Code char *ptr = (char *) MALLOC(4); *((int *) (ptr - 8)) = 8 + (1 << 31); FREE(ptr); Error # 1 or 3 Correct Output Error: Header has been corrupted.or Error: Starting edge of the payload has been overwritten. in block allocated at driver.c, line 47 and freed at driver.c, line 49 Points worth 15 Details 9 pts for catching error 6 pts for a correct error message Test case #7 Code char ptr[5]; FREE(ptr); Error # 4 Correct Output Error: Attempting to free an unallocated block. in block freed at driver.c, line 54 Points worth 15 Details 15 pts for recognizing error Extra for printing correct error message Test case #8 (Optional) Code int i; int *intptr = (int *) MALLOC(6); char *str = (char *) MALLOC(12); for(i = 0; i < 6; i++) { intptr[i] = i; } if (HeapCheck() == -1) { printf("\nCaught Errors\n"); } Error # None Correct Output Error: Ending edge of the payload has been overwritten. Invalid block created at driver.c, line 59 Caught Errors Points worth Extra Details "Caught Errors" indicates that the HeapCheck() function worked correctly. Extra points possible. Your instructor may give you extra credit for implementing a global list and the PrintAllocatedBlocks() and HeapCheck() functions.
评论
添加红包

请填写红包祝福语或标题

红包个数最小为10个

红包金额最低5元

当前余额3.43前往充值 >
需支付:10.00
成就一亿技术人!
领取后你会自动成为博主和红包主的粉丝 规则
hope_wisdom
发出的红包
实付
使用余额支付
点击重新获取
扫码支付
钱包余额 0

抵扣说明:

1.余额是钱包充值的虚拟货币,按照1:1的比例进行支付金额的抵扣。
2.余额无法直接购买下载,可以购买VIP、付费专栏及课程。

余额充值