


In [2]:
from sklearn.datasets import load_iris

iris = load_iris()
iris.keys()
Out[2]:
In [3]:
n_sample, n_feature = iris.data.shape
n_sample, n_feature
Out[3]:
In [4]:
iris.target.shape
Out[4]:
In [5]:
iris.feature_names
Out[5]:
In [6]:
iris.target_names
Out[6]:
In [9]:
iris.data
Out[9]:
In [10]:
import matplotlib.pyplot as plt

x_index = 0
y_index = 1
plt.scatter(iris.data[:, x_index], iris.data[:,y_index], c=iris.target)
plt.xlabel = iris.feature_names[x_index]
plt.ylabel = iris.feature_names[y_index]

In [11]:
from sklearn.datasets import load_digits

digits = load_digits()
digits.keys()
Out[11]:
In [13]:
digits.data.shape
Out[13]:
In [14]:
digits.images.shape
Out[14]:
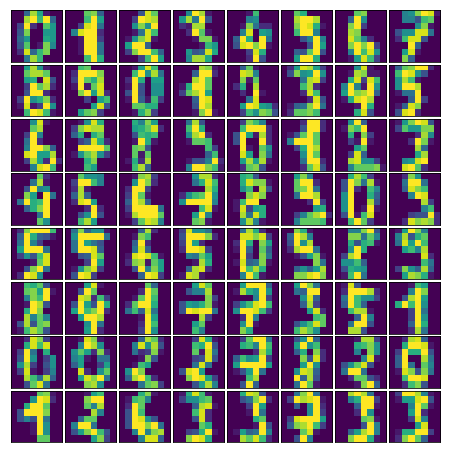
In [15]:
fig = plt.figure(figsize=(6, 6))
fig.subplots_adjust(left=0, right=1, bottom=0, top=1, hspace=0.05, wspace=0)
for i in range(64):
    ax = fig.add_subplot(8, 8, i + 1, xticks=[], yticks=[])
    ax.imshow(digits.images[i])
In [16]:
digits.target_names
Out[16]:


 1079
1079


 被折叠的 条评论
为什么被折叠?
被折叠的 条评论
为什么被折叠?
 到【灌水乐园】发言


