


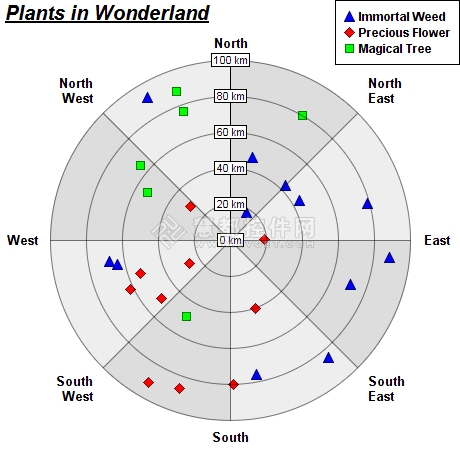
在这个例子中讲述了如何在ChartDirector中创建极地散点图,同时还演示了如何沿着角度的方向交替使用背景颜色。
这样的极地散点图可以使用创建极线图加数据符号来绘制,线条的宽度设置为0,这样擦可以只看见数据符号,出现散点图的效果。
详细的步骤如下:
- 使用PolarChart.addLineLayer创建一个极线图
- 使用PolarLayer.setDataSymbol启动数据符号
- 使用PolarLayer.setLineWidth设置线条的宽度为0
在这个例子中,值得注意的是这个图表的背景色是沿着角度的方向使用了两种交互的颜色而这个效果呢就是使用PolarChart.setPlotAreaBg实现的。
具体的代码如下:
// ChartDirector for ColdFusion API Access Point
cd = CreateObject("java", "ChartDirector.CFChart");

// A utility to allow us to create arrays with data in one line of code
function Array() {
    var result = ArrayNew(1);
    var i = 0;
    for (i = 1; i LTE ArrayLen(arguments); i = i + 1)
        result[i] = arguments[i];
    return result;
}

// The data for the chart
data0 = Array(43, 89, 76, 64, 48, 18, 92, 68, 44, 79, 71, 85);
angles0 = Array(45, 96, 169, 258, 15, 30, 330, 260, 60, 75, 110, 140);

data1 = Array(50, 91, 26, 29, 80, 53, 62, 87, 19, 40);
angles1 = Array(230, 210, 240, 310, 179, 250, 244, 199, 89, 160);

data2 = Array(88, 65, 76, 49, 80, 53);
angles2 = Array(340, 310, 340, 210, 30, 300);

// The labels on the angular axis (spokes)
labels = Array("North", "North<*br*>East", "East", "South<*br*>East", "South",
    "South<*br*>West", "West", "North<*br*>West");

// Create a PolarChart object of size 460 x 460 pixels
c = cd.PolarChart(460, 460);

// Add a title to the chart at the top left corner using 15pts Arial Bold Italic font
c.addTitle2(cd.TopLeft, "<*underline=2*>Plants in Wonderland", "Arial Bold Italic",
    15);

// Set center of plot area at (230, 240) with radius 180 pixels
c.setPlotArea(230, 240, 180);

// Use alternative light grey/dark grey sector background color
c.setPlotAreaBg("0xdddddd", "0xeeeeee", False);

// Set the grid style to circular grid
c.setGridStyle(False);

// Add a legend box at the top right corner of the chart using 9 pts Arial Bold font
c.addLegend(459, 0, True, "Arial Bold", 9).setAlignment(cd.TopRight);

// Set angular axis as 0 - 360, either 8 spokes
c.angularAxis().setLinearScale2(0, 360, labels);

// Set the radial axis label format
c.radialAxis().setLabelFormat("{value} km");

// Add a blue (0xff) polar line layer to the chart using (data0, angle0)
layer0 = c.addLineLayer(data0, "0x0000ff", "Immortal Weed");
layer0.setAngles(angles0);

layer0.setLineWidth(0);
layer0.setDataSymbol(cd.TriangleSymbol, 11);

// Add a red (0xff0000) polar line layer to the chart using (data1, angles1)
layer1 = c.addLineLayer(data1, "0xff0000", "Precious Flower");
layer1.setAngles(angles1);

// Disable the line by setting its width to 0, so only the symbols are visible
layer1.setLineWidth(0);

// Use a 11 pixel diamond data point symbol
layer1.setDataSymbol(cd.DiamondSymbol, 11);

// Add a green (0x00ff00) polar line layer to the chart using (data2, angles2)
layer2 = c.addLineLayer(data2, "0x00ff00", "Magical Tree");
layer2.setAngles(angles2);

// Disable the line by setting its width to 0, so only the symbols are visible
layer2.setLineWidth(0);

// Use a 9 pixel square data point symbol
layer2.setDataSymbol(cd.SquareSymbol, 9);

// Output the chart
chart1URL = c.makeSession(GetPageContext(), "chart1");

// Include tool tip for the chart
imageMap1 = c.getHTMLImageMap("", "",
    "title='{dataSetName} at ({value} km, {angle} deg)'");

</cfscript>
<html>
<body style="margin:5px 0px 0px 5px">
<div style="font-size:18pt; font-family:verdana; font-weight:bold">
    Polar Scatter Chart
</div>
<hr style="border:solid 1px #000080" />
<cfoutput>
<div style="font-size:9pt; font-family:verdana; margin-bottom:1.5em">
    <a href='viewsource.cfm?file=#CGI.SCRIPT_NAME#'>View Source Code</a>
</div>
<img src="getchart.cfm?#chart1URL#" usemap="##map1" border="0" />
<map name="map1">#imageMap1#</map>
</cfoutput>
</body>
</html>


 259
259

 被折叠的 条评论
为什么被折叠?
被折叠的 条评论
为什么被折叠?
 到【灌水乐园】发言


