


NetScaler + Wireshark = A Perfect Combination!
https://www.citrix.com/blogs/2014/05/03/netscaler-wireshark-a-perfect-combination/
Supercharge your Wireshark!
Troubleshooting many of the issues that occur in TCP networks can be rather challenging if you don’t leverage the correct tools. Fortunately the wise folk at Citrix have integrated excellent tracing capabilities into the NetScaler appliance.
This tutorial is not specifically focused on how to use the NetScaler tracing tool, but instead it’s focused on how to empower your default Wireshark configuration with simple customizations to help you diagnose a variety of TCP-related issues much more efficiently. That being said, here are a few CTX articles that will provide you guidance in taking a NetScaler trace:
How to Capture an Nstrace from the Command Line Interface of Netscaler Appliance:
http://support.citrix.com/article/CTX120941
How to Record Network Packet Trace on NetScaler Appliance:
http://support.citrix.com/article/CTX128655
Download Wireshark at your own risk:
You can download the latest stable copy of Wireshark at the following URL: http://www.wireshark.org/
I personally like to keep up-to-date on the bleeding edge versions of Wireshark, so I navigate to the developers section to find the very latest builds: http://www.wireshark.org/download/automated/
There are two key modifications that I make to my default Wireshark configuration.
- I add select columns to the default view
- I create custom filter menu buttons
Let’s first take a look at how I create custom columns.
Custom Columns
You can see in the following graphic that I’ve added a few different columns to my configuration. I’ve added PCBDev, Link PCBDev, TCP Strm and TCP Delta as column options. I actually have quite a few more custom columns defined.

Adding custom columns to the default Wireshark view can provide very quick insight without having to navigate into the packet details section to hunt for the desired details. In the example provided above, the PCBDev column will show the front-end TCP connection detail (client <> NetScaler) and the Link PCBDev column will show the back-end TCP connection detail.
The TCP Strm column will show you the packet communication within one specific TCP connection. Having this particular column on your Wireshark configuration will help you to isolate specific source-to-destination TCP communication, preventing you from potentially confusing different TCP conversations in the traffic that you’re interested in analyzing.
During the initial three-way handshake, there won’t be any detail in the two PCBDev columns other than zeroes, as a TCP connection has not yet been established and memory allocation for the TCP connection won’t be reserved just yet.
HOT TIP: One excellent plus with leveraging NetScaler traces is that the NetScaler will inject proprietary header information that can be extremely helpful when troubleshooting. You’ll see NIC, VLAN and PE details, as referenced below:

To add new columns, click on the “Edit preferences…” menu option in the toolbar and select Columns from the menu tree on the left:

If you haven’t already made changes to your Wireshark configuration, you’ll see the default columns identified. You can see from this example that I have added quite a few different columns in my configuration; some checked and others not. The columns which are not checked will not show in the actual presentation view when examining packets in the trace.
Click the ‘Add’ option and select the appropriate ‘Field type’ (there are numerous built-in options). I’ve chosen ‘Custom’ in this example, as I want to create a non-built-in option. I also completed the ‘Field name’ with tcp.stream, as I want to see what TCP stream a particular packet is associated with.

You will also need to add a name for ‘Title’ of the new custom column. Once you’ve created the new column option, click OK and the new column will be displayed appropriately.
NOTE: If you want to find out the time delta between each respective packet (I highly encourage you to do such as it will tell if you if there is latency in request vs. response packets in a TCP stream), you will need to enable TCP time stamps. You can do such by right-clicking the TCP row in the packet details view, selecting ‘Protocol Preferences’, then selecting ‘Calculate conversation timestamps’. IMHO this is a must have for every Wireshark configuration.

So I’ve shown you how to easily add new columns to your Wireshark configuration via the menu option. You can also add columns really quickly by right-clicking an element in the packet detail view and selecting ‘Apply as a Column’. You may need to shift the layout of the columns with a click-n-drag of the mouse.

Let’s now shift our focus on creating custom filter menu buttons.
Open a Wireshark trace and enter the following expression in the filter box:
tcp.analysis.flags && !tcp.analysis.window_update

Click ‘Save’ and you’ll be presented with the following dialogue box:

Enter the name “BadTCP” and click the ‘OK’ button. The new BadTCP button will be visible on the menu area of Wireshark.
Now anytime that you open a new trace, you can simply click the ‘BadTCP’ button and the filter will be instantly applied to the trace file, showing you if there are any TCP packets that you should inspect for issues.

I’m sure that you can now see the value of creating very complex filters that can be saved to the Wireshark menu area, which can be applied at the click of a button, with the results yielded. No longer will you have to remember what a particular filter is to troubleshoot packets.
Here are a few helpful filters that I use daily and the condensed names for each respective menu button:
DNS Errors
Name: DNSErr
Filter Expression: dns.flags.rcode > 0
HTTP Errors
Name: HTTPErr
Filter Expression: http.response.code > 399
General TCP Errors
Name: GenErr
Filter Expression: (dns.flags.rcode > 0) || (http.response.code > 399) || (smb.nt_status > 0 || smb2.nt_status > 0)
TCP Delay
Name: TCPDelay.3 (will find packets with a time delta from the previous packet greater than 300ms)
Filter Expression: ((tcp.time_delta >.3) && (tcp.flags.fin == 0)) && (tcp.flags.reset==0)
SYN Packets
Name: Syn (will show the first packet in a TCP three-way handshake)
Filter Expression: tcp.flags.syn == 1
GET and POST
Name: GET/POST
Filter Expression: http.request.method == “GET” or http.request.method == “POST”
Zero Windows
Name: ZeroWin (will find packets where the TCP buffer is full, potentially causing significant application delay)
Filter Expression: tcp.analysis.zero_window
TCP Window Full
Name: WindFull
Filter Expression: tcp.analysis.window_full
GET’s and RESPONSES
Name: GetnResponse (will show all of the GET’s and their associated responses)
Filter Expression: http.request or http.response
========================= End
https://support.citrix.com/article/CTX120941
How to Capture an nstrace from the Command Line Interface of NetScaler Appliance
Applicable Products
- NetScaler
Objective
This article explains how to capture a NetScaler network trace using the command line interface of NetScaler appliance.
Background
With NetScaler you can set filters to capture a specific client transaction or back-end server communication. This provides a greater flexibility to capture a trace from front-end (client to virtual server) or back-end (NetScaler appliance to server) or both.
Instructions
To capture a NetScaler network trace, complete the following steps:
-
Log on to the NetScaler appliance through PuTTY, or Secure Console.
-
Run the start nstrace command to capture the network trace on the NetScaler appliance in native format with the extension .cap.
-
To stop the trace after capturing the required information, press Ctrl+C.
-
Download the trace file through the GUI or through SFTP or WinSCP. The trace files are stored in the /var/nstrace directory.
-
The trace files captured can be viewed with the Wireshark application.
Operations Supported by nstrace Command
For the complete list of arguments supported by nstrace Command, refer to Citrix Documentation - nstrace
Filter Qualifiers
| Qualifier | Value |
| SRCIP | IP Address |
| SRCPORT | Port Number |
| DSTIP | IP Address |
| DSTPORT | Port Number |
| SVCNAME | Service Name |
| CS_VSERVER/LB_VSERVER | Vserver Name |
| TCPSTATE | CLOSE_WAIT, CLOSED, CLOSING, ESTABLISHED, FIN_WAIT_1, FIN_WAIT_2, LAST_ACK, LISTEN, SYN_RECEIVED, SYN_SENT, TIME_WAIT |
Filter Operators
==, eq, !=, neq, >, gt, <, lt, >=, ge, <=, le, BETWEEN
Compound Expressions can be configured with filters &&, ||.
nstrace Examples
-
start nstrace -filter "CONNECTION.DSTIP.EQ(10.1.1.1)" -link ENABLED -size 0
This command captures the trace with the IP address (in this example, the IP address of the VIP) and also the back-end connection because the link option is enabled. The size is 0.
-
start nstrace -filter "CONNECTION.SRCIP.EQ(10.1.1.1)" -time 10 -fileName sample_trace
This command captures the trace with the source IP address of the client with the duration of each trace as 10 seconds and the name of the file is sample_trace.
-
start nstrace -filter "CONNECTION.DSTIP.EQ(10.1.1.1) || CONNECTION.SRCIP.EQ(10.1.1.2)" -size 0
This command captures the trace with the source IP address of the client (10.1.1.2) or with a specific server/destination IP address (10.1.1.1).
-
start nstrace -filter "CONNECTION.DSTIP.EQ(10.1.1.1) || CONNECTION.SRCIP.EQ(10.1.1.2)" -size 0 -nf 24 -time 30
This command captures the trace with the source IP address of the client (10.1.1.1) or with a specific server IP address (10.1.1.2). This command can be used in case of intermittent connection failure issues. This will enable cyclic capture of trace on the NetScaler and captures a new trace every 30 seconds. This process will continue for the next 24 (nf) files and after that it will start rewriting the old files. The advantage of this command is that it will only consume space for 24 trace files at any given time and will keep the memory from running out.
Additional Resources
Citrix Documentation - Tracing the Packets of a NetScaler Cluster
Citrix Documentation - nstrace
========================= End
https://support.citrix.com/article/CTX128655
How to Record Network Packet Trace on NetScaler Appliance
Applicable Products
- NetScaler
Objective
This article describes how to record network packet trace using the Graphical User Interface (GUI) of a NetScaler appliance.
Instructions
Points to Note
-
Citrix recommends the use of recent Wireshark version from the "automated build section" of the following web link: http://www.wireshark.org/download/automated.
-
In NetScaler software release 10.5 and later, to decrypt the capture, ensure that ECC (Elliptic Curve Cryptography), Session Reuse and DH Param are disabled/removed from the virtual server before the trace is captured. Refer to the Additional Resources section of this article before making these changes
To record the network packet trace on a NetScaler appliance, complete the following procedure based on the NetScaler firmware:
NetScaler 11.1
-
Expand the System node of the navigation pane on the appliance.
-
Select the Diagnostics node.
-
Click the Start new trace link in the Diagnostics page, as shown in the following screenshot:

-
Update the packet size to 0 in the Packet size field.

-
Click Start to start recording the network packet trace.
-
Click Stop and Download to stop recording the network packet trace after the test is complete.

An nstrace.cap file is generated, which contains the network packet trace.
-
Select the required file and click Select and click Download.

-
Open the network packet trace file with the Wireshark utility to display the content of the file.
NetScaler 10.5 and Later
-
Expand the System node of the navigation pane on the appliance.
-
Select the Diagnostics node.
-
Click the Start new trace link under Technical Support Tools as shown in the following screen shot:

-
Update the packet size to 0 in the Packet Size field.

Note: If NetScaler headers are not required then select Capture trace in .pcap format.
-
Click Start to start recording the network packet trace.
-
Click OK to stop recording the network packet trace after the test is complete.
An nstrace.cap file is generated, which contains the network packet trace.
-
Highlight the required file and click Download.

-
Specify a destination and save the packet trace.
-
Open the network packet trace file with the Wireshark utility to display the content of the file.
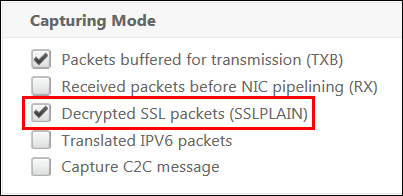
Note: Select Decrypted SSL packets (SSLPLAIN) to decrypt the packet trace without the private key.
Capturing SSL master keys
In the latest 11.0 and 11.1 version and above there is an option to capture the session keys which will be valid for only for that particular session/nstrace and this option can be used if you donot want to share the private key or use SSLPLAIN mode. For more information please refer to
How to use the new "capsslkeys" option when trying to capture nstrace on Netscaler
Exporting Session Keys without sharing Private key
In most of the scenarios the private key is not available or shared. In such scenarios we can suggest to export the SSL session keys instead of the private key. Please refer to the below article for more information.
How to Export and Use SSL Session Keys to Decrypt SSL Traces Without Sharing the SSL Private Key
Using Filters
Additionally, it is always recommended to add IP based filters while taking traces. This will ensure that you will capture only interested traffic which will further ease your troubleshooting. Adding filters will also decrease the load on NetScaler while taking traces.
You will find the option to configure filters on the same page: 
Simple IP based filters are enough to get the right captures. For a detailed list of filters and examples, refer to Citrix Documentation - nstrace.
Example: Capturing a trace with VServer IP filter (both frontend and backend)
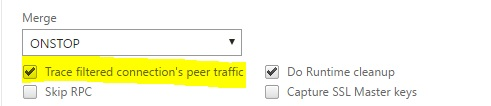
With a filter of the Vserver IP address and enabling the option “–link” in CLI or select the option "Trace filtered connection peer traffic" in GUI (available 10.1 and above), you will be able to capture both the front end and backend traffic for that particular IP address. With this option it is not recommended to mention a source IP or destination IP filter.
start nstrace -size 0 -filter "CONNECTION.IP.EQ(1.1.1.1)" -link ENABLED
show nstrace
State: RUNNING Scope: LOCAL TraceLocation: "/var/nstrace/24Mar2017_16_00_19/..." Nf: 24 Time: 3600 Size: 0 Mode: TXB NEW_RX
Traceformat: NSCAP PerNIC: DISABLED FileName: 24Mar2017_16_00_19 Filter: "CONNECTION.IP.EQ(1.1.1.1)" Link: ENABLED Merge: ONSTOP Doruntimecleanup: ENABLED
TraceBuffers: 5000 SkipRPC: DISABLED Capsslkeys: DISABLED InMemoryTrace: DISABLED
Capturing Cyclic traces
It is always challenging to troubleshoot an intermittent issue. Cyclic tracing is best suited for issues which are intermittent. These traces can be run over a span of few hours or days based on the occurance of the issue. Also a specific filter can be used as mentioned above. Please evaluate the size of the trace files that are being generated before running it for a longer time (as this can fill up the var space)
Run the following command from CLI
start nstrace -nf 60 -time 30 -size 0
This particular trace will create 60 files each of them for 30 sec. This means the files will start getting overwritten after 60 trace files or 30 mins
Show nstrace à To check the status of the nstrace
Stop nstrace à To stop the nstrace.
Best Practices
On a unit handling gigabytes of traffic per second, capturing traffic is a very resource intensive process. The impact to resources is mainly in terms of CPU and Disk Space. Disk Space impact can be reduced by using filtering expressions (capturing traffic only related to a particular IP). However the impact on CPU remains despite using expressions and in some cases might cause a slight further increase as NetScaler now needs to process packets according to the filter before capturing them.
The best practice with regards to tracing are:
- The duration for which the trace is run should be as limited as possible while still ensuring the packets of interest are captured.
- Schedule the tracing activity to happen at a time when the number of users (and hence the traffic) is greatly reduced, such as during off hours.
Additional Resources
Disable Session Reuse on Virtual Server from NetScaler GUI
Session reuse is disabled while capturing a trace in order to capture a complete SSL handshake in the trace. When it is enabled it is likely that you will only capture a partial handshake in the trace. Ensure to enable the option after trace collection.Do not disable SSL session reuse when the persistence method is sslsession, as it will break the persistence for existing connections. For more information refer to CTX121925- SSL Renegotiation Process and Session Reuse on NetScaler Appliance
-
Open the virtual server and navigate to SSL Parameters.
-
Disable Enable Session Reuse if enabled.
Disable Session Reuse on Virtual Server from NetScaler CLI
-
SSH to the NetScaler.
-
Run the following command to disable DH Param from the virtual server:
set ssl vserver "vServer_Name" -sessReuse DISABLED
Disable DH Param on Virtual Server from NetScaler GUI
Refer to CTX213335 - How do I setup a Diffie-Hellman key on NetScaler? to understand about DH Parameter.-
Open the virtual server and navigate to SSL Parameters.
-
Disable DH Param if enabled.
Disable DH Param on Virtual Server from NetScaler CLI
-
SSH to the NetScaler.
-
Run the following command to disable DH Param from the virtual server:
set ssl vserver "vServer_Name" -dh DISABLED
Disable ECC Curve on Virtual Server from NetScaler GUI
ECC curve are disabled in order to decrypt the captured SSL trace with private key. These keys should not be disabled if the related SSL ciphers are used. For more information on ECC curve refer to CTX205289 - How Do I Setup ECC on NetScaler?-
Open the virtual server and navigate to ECC Curve.

-
If no ECC Curve is bound to the virtual server then no other action is required.

-
If any ECC Curve is bound to the virtual server then click the ECC Curve and Unbind it from the virtual server.

Disable ECC Curve on Virtual Server from NetScaler CLI
-
SSH to the NetScaler.
-
Run the following command for each ECC Curve bound to the virtual server:
unbind ssl vserver "vServer_Name" -eccCurveName "ECC_Curve_Name"
========================== End


 205
205

 被折叠的 条评论
为什么被折叠?
被折叠的 条评论
为什么被折叠?
 到【灌水乐园】发言


