


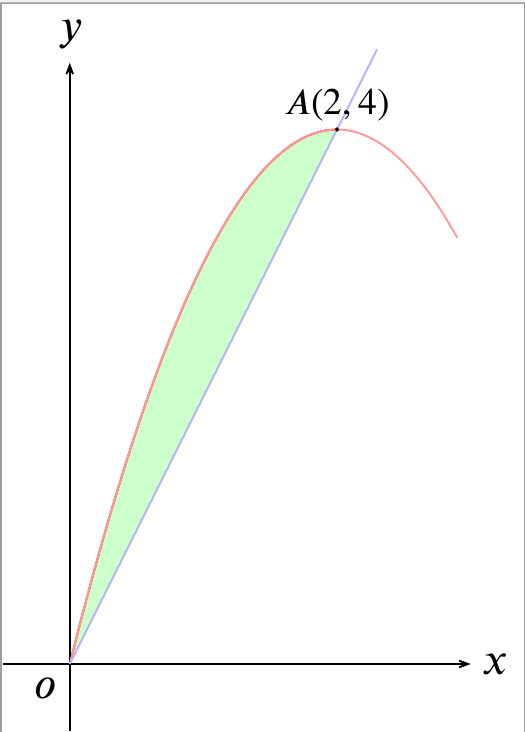
% 例1
\documentclass[10pt]{standalone}
\usepackage{tikz}
\usetikzlibrary{arrows.meta}
\usepackage{unicode-math}
\setmainfont{XITS}
\setmathfont{XITS Math}
\usepackage{scalerel} %\scaleobj{1.5}{} 缩放公式大小
\begin{document}
\begin{tikzpicture}[smooth]
\draw[arrows={-Stealth[length=5pt, inset=3.5pt]}] (-0.5,0) -- (3.0,0)node (xaxis) [right=-1pt] {$x$};
\draw[arrows={-Stealth[length=5pt, inset=3.5pt]}] (0,-0.5) -- (0,4.5)node (yaxis) [above=-0.6pt] {$y$};
\draw  (-0.18,-0.18) node {$o$};
\draw[color=red,domain=0:2.0,fill=green!20] plot (\x,4*\x-\x*\x);
\draw[color=red!40,domain=0:2.90] plot (\x,4*\x-\x*\x)  ;
\draw[color=blue!30,domain=0:2.3] plot (\x,2*\x)  ;
\draw[fill=black] (2,4) circle [radius=0.2pt] node[above=-1.8pt] {$\scaleobj{0.8}{A(2,4)}$};
\end{tikzpicture}
\end{document}
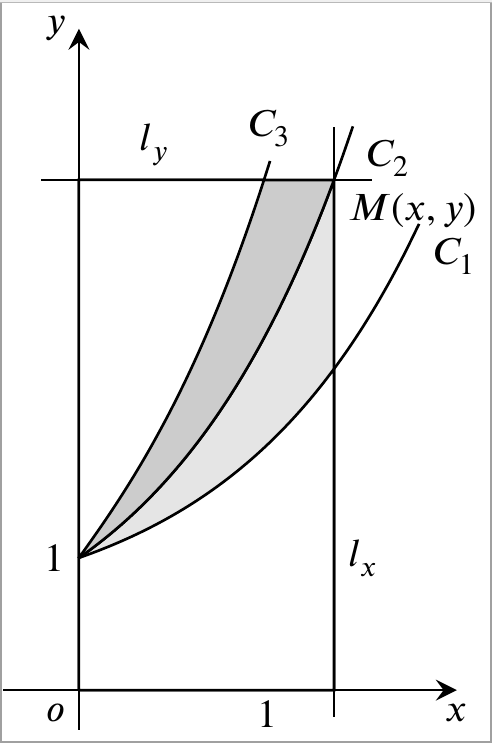
% 例2
\documentclass[10pt]{standalone}
\usepackage{tikz}
\usetikzlibrary{arrows.meta}
\usepackage{unicode-math}
\setmainfont{XITS}
\setmathfont{XITS Math}
\begin{document}
\begin{tikzpicture}[yscale=0.7]
\draw[-stealth] (-0.4,0)--(2,0) node[below,scale=0.6]{$x$};
\draw[-stealth] (0,-0.3)--(0,5) node[left,scale=0.6]{$y$};
\draw (0,0) node [below left,scale=0.6] {$o$};
\foreach \i in {1}{\draw (\i,0)--node [below,scale=0.6] {$1$}(\i,0.05);}
\draw (0,1) node [left,scale=0.6] {$1$};
\draw (1.35,1) node [right,scale=0.6] {$l_x$};
\draw (0.4,3.85742) node [above,scale=0.6] {$l_y$};
\draw (1.35,-0.2) -- (1.35,4.25519);
\draw (-0.2,3.85742) -- (1.55,3.85742);
\draw (1.35,3.85742) node [below right,scale=0.6] {$M(x,y)$};
%\clip (-1,-1) rectangle (5,5);%只在这个区域内画图
\draw[domain=1:4,smooth,variable=\t] plot ({ln(\t)+1/(2*\t)-0.5},\t)node[above,scale=0.6] {$C_3$};
\draw[domain=0:1.8,smooth] plot (\x,{0.5*1+0.5*exp(\x)}) node[below right,scale=0.6] {$C_1$};
\draw[domain=0:1.45,smooth] plot (\x,{exp(\x)}) node[below right,scale=0.6] {$C_2$};
\filldraw [fill=gray!20] (0,0) -- plot [domain=0:1.35,smooth] (\x,{exp(\x)}) -- (1.35,0) -- (0,0);
\filldraw [fill=white] (0,0) -- plot [domain=0:1.35,smooth] (\x,{0.5*1+0.5*exp(\x)}) -- (1.35,0) -- (0,0);
\filldraw [fill=gray!40] (0,1) -- plot [domain=0:1.35,smooth] (\x,{exp(\x)}) -- (0,3.85742) -- (0,1);
\filldraw [fill=white] (0,1) -- plot [domain=1:3.85742,smooth,variable=\t] ({ln(\t)+1/(2*\t)-0.5},\t) -- (0,3.85742) -- (0,1);
\end{tikzpicture}
\end{document}
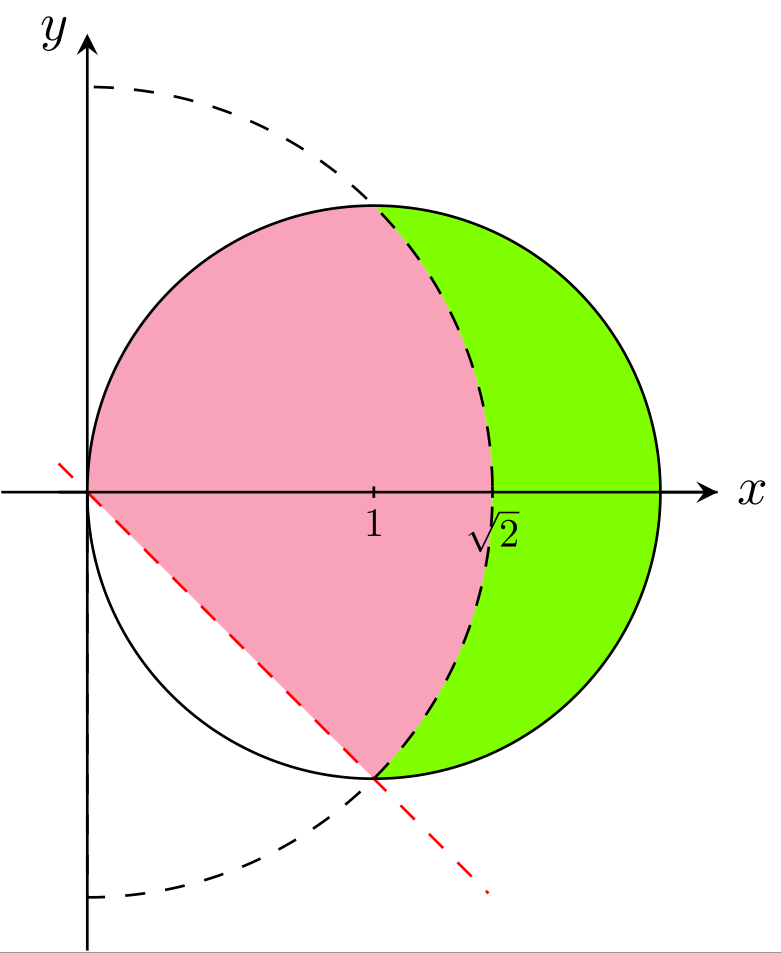
% 例3
\documentclass[tikz,border=0pt,10pt]{standalone}
\usetikzlibrary{arrows.meta}
\usetikzlibrary{patterns}
\definecolor{pink}{RGB}{249,164,186}
\definecolor{grassgreen}{RGB}{128,255,0}
\usepackage{scalerel} %\scaleobj{1.5}{} 缩放公式大小
\begin{document}
\begin{tikzpicture}[scale=1.5]
\draw[-stealth] (-0.3,0) -- (2.2,0)node (xaxis) [right,scale=0.8] {$x$};
\draw[-stealth] (0,-1.6) -- (0,1.6)node (yaxis) [left,scale=0.8] {$y$};
\fill[pink!] (0,0) -- (1,-1) arc [start angle=315, end angle=405, radius=1.414] -- (0,0);
\fill[pink!] (1,0) -- (1,1) arc [start angle=90, end angle=180, radius=1] -- (0,0);
\fill[grassgreen] (0,0) -- (1,-1) arc [start angle=315, end angle=360, radius=1.414] -- (1.414,0)--(2,0) arc [start angle=360, end angle=270, radius=1] -- (1,-1);
\fill[grassgreen] (0,0) -- (1,1) arc [start angle=45, end angle=0, radius=1.414] -- (1.414,0)--(2,0) arc [start angle=0, end angle=90, radius=1] -- (1,1);
\draw (1,-0.02)--(1,0.02) node[below] {$\scaleobj{0.6}{1}$};
\draw (1.414,-0.02)--(1.414,0.02) node[below] {$\scaleobj{0.6}{\sqrt{2}}$};
\draw[style=dashed,color=red,domain=-0.1:1.4] plot(\x,-\x);
\draw[color=black,domain=-0.1:2.2] plot(\x,0);
\draw[style=dashed] (0,0)--(0,-1.414) arc [start angle=270, end angle=450, radius=1.414];
\draw (1,0) circle [radius=1];
%\fill[pattern=north west lines](0,0)--(-2,0)--(-2,2)--(0,2)arc(90:270:0.8);
%\fill[pattern=north west lines]arc(-45:0:1);
\end{tikzpicture}
\end{document}
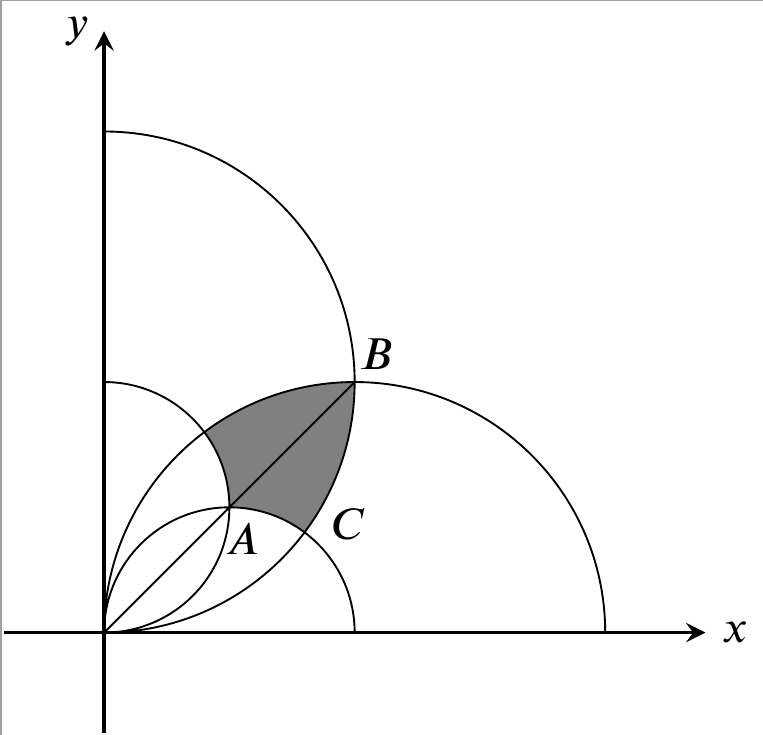
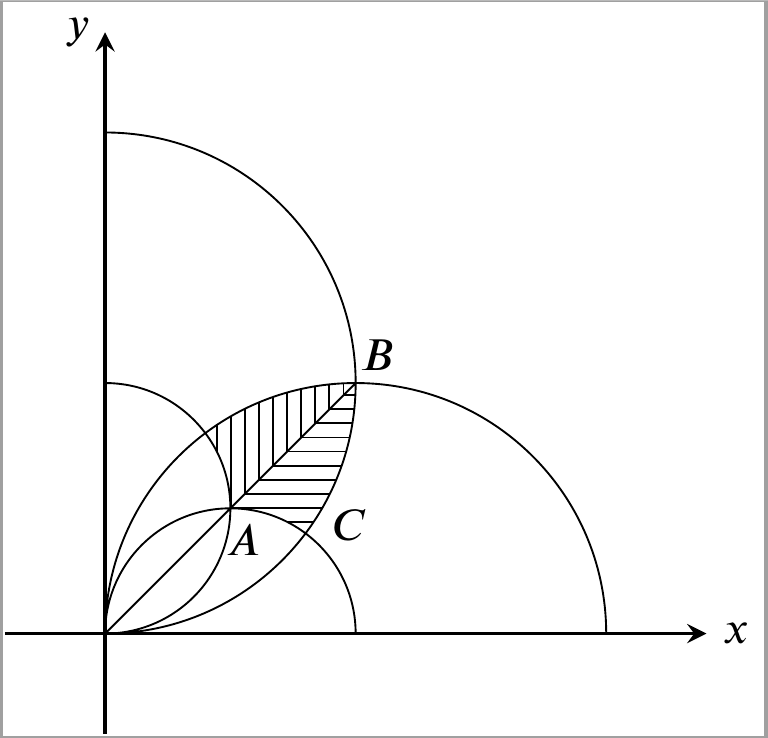
例4.(by kuing) 选自怎么填充图中的阴影部分
% 例4-1
\documentclass[10pt]{standalone}
\usepackage{tikz}
\usetikzlibrary{arrows.meta}
\usepackage{unicode-math}
\setmainfont{XITS}
\setmathfont{XITS Math}
\begin{document}
\begin{tikzpicture}[scale=15]
\begin{scope}
\clip (0,0) arc (-90:0:1/8) arc (90:180:1/8);
\fill[gray,even odd rule] (0,0) arc (-90:0:1/8) arc (90:180:1/8)
arc (-90:270:1/16) arc (-180:180:1/16) arc (-90:0:1/16) arc (90:180:1/16);
\end{scope}
\draw [-stealth,thick](-0.05,0)--(0.3,0);
\draw [-stealth,thick](0,-0.05)--(0,0.3);
\node[right]at(0.3,0){$x$};
\node[left]at(0,0.3){$y$};
\draw (0,0) arc (-90:90:1/8) (0,0) arc (-90:90:1/16)
(0,0) arc (180:0:1/8) (0,0) arc (180:0:1/16) (0,0)--(1/8,1/8);
\node [below]at(0.069,0.0627){$A$};
\node [above]at(0.136,0.123){$B$};
\node [right]at(0.105,0.0541){$C$};
\end{tikzpicture}
\end{document}
% 例4-2
\documentclass[10pt]{standalone}
\usepackage{tikz}
\usetikzlibrary{arrows.meta}
\usetikzlibrary{patterns}
\usepackage{unicode-math}
\setmainfont{XITS}
\setmathfont{XITS Math}
\begin{document}
\begin{tikzpicture}[scale=15]
\begin{scope}
\clip (0,0) arc (-90:0:1/8) arc (90:180:1/8);
\fill[pattern=horizontal lines]
(0,0) arc (-90:0:1/8) --(1/16,1/16) arc (90:0:1/16);
\fill[pattern=vertical lines]
(0,0) arc (180:90:1/8) --(1/16,1/16) arc (0:90:1/16);
\end{scope}
\draw [-stealth,thick](-0.05,0)--(0.3,0);
\draw [-stealth,thick](0,-0.05)--(0,0.3);
\node[right]at(0.3,0){$x$};
\node[left]at(0,0.3){$y$};
\draw (0,0) arc (-90:90:1/8) (0,0) arc (-90:90:1/16)
(0,0) arc (180:0:1/8) (0,0) arc (180:0:1/16) (0,0)--(1/8,1/8);
\node [below]at(0.069,0.0627){$A$};
\node [above]at(0.136,0.123){$B$};
\node [right]at(0.105,0.0541){$C$};
\end{tikzpicture}
\end{document}
% 例5
\documentclass{standalone}
\usepackage{tikz}
\usetikzlibrary{arrows.meta}
\usetikzlibrary{patterns}
\usepackage{unicode-math}
\setmainfont{XITS}
\setmathfont{XITS Math}
\begin{document}
\begin{tikzpicture}[scale=1.5]
\begin{scope}
\draw[-stealth] (-0.25,0) -- (3.35,0) node (xaxis) [below] {$x$};
\draw[-stealth] (0,-0.25) -- (0,1.35) node (yaxis) [left] {$y$};
\draw (3,0.025)--(3,-0.025) node[below=-0.5mm] {3};
\draw (0.025,1) -- (-0.025,1) node[left=-0.75mm] {1};
\end{scope}
\draw (-0.15,-0.15) node {$o$};
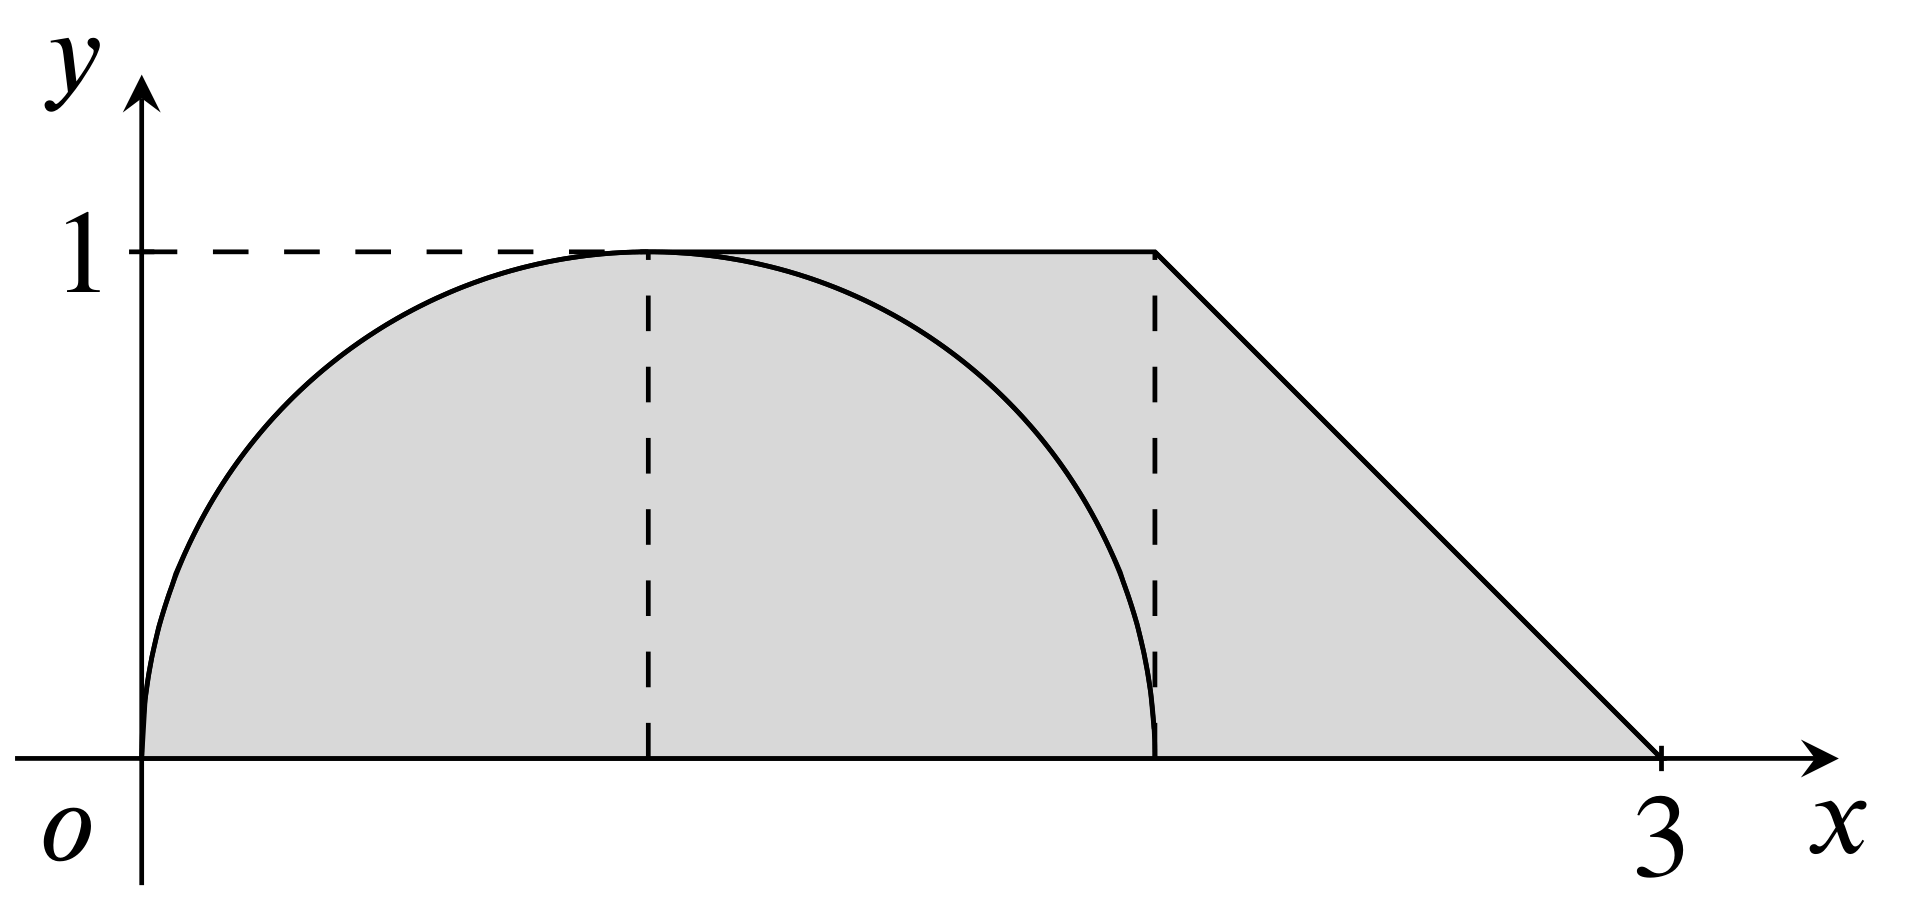
\draw[fill=gray!30] (2,0) arc [start angle=0, end angle=180, radius=1] -- (3,0) -- (2,1) -- (1,1); %,pattern=dots,even odd rule
\draw[domain=2:3,fill=green!20] plot (\x,3-\x);
\draw[samples=300,domain=0:2.0] plot (\x,{(1-(1-\x)^2)^(1/2)});
\draw[dashed] (0,1) -- (1,1);
\draw[dashed] (2,0) -- (2,1);
\draw[dashed] (1,0) -- (1,1);
\end{tikzpicture}
\end{document}


 2444
2444


 被折叠的 条评论
为什么被折叠?
被折叠的 条评论
为什么被折叠?
 到【灌水乐园】发言


