


Compute and plot the binomial probability density function for the specified range of integer values, number of trials, and probability of success for each trial.
In one day, a quality assurance inspector tests 200 circuit boards. 2% of the boards have defects. Compute the probability that the inspector will find no defective boards on any given day.
binopdf(0,200,0.02)
ans = 0.0176
Compute the binomial probability density function values at each value from 0 to 200. These values correspond to the probabilities that the inspector will find 0, 1, 2, ..., 200 defective boards on any given day.
defects = 0:200;
y = binopdf(defects,200,.02);
Plot the resulting binomial probability values.
plot(defects,y)
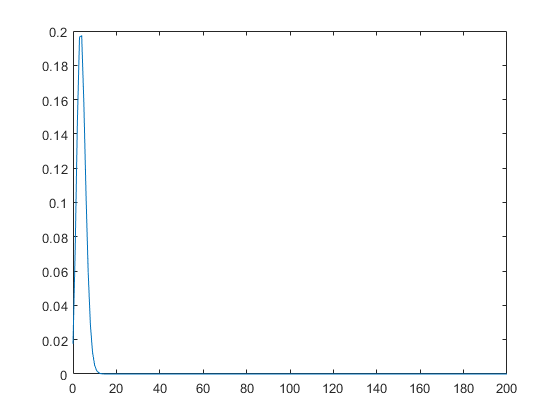
Compute the most likely number of defective boards that the inspector finds in a day.
[x,i] = max(y);
defects(i)
ans = 4


 631
631


 被折叠的 条评论
为什么被折叠?
被折叠的 条评论
为什么被折叠?
 到【灌水乐园】发言


