xrd精修教程_最简单!Origin快速绘制XRD精修后的Bragg position竖线图

0d2d57188193258b857f9c5cce5ecc43.png

来源丨萤火科研 ← 关注TA

今天小编教大家用最简单最快捷的方法画XRD精修后数据的Bragg position竖线图。其实关于这种图怎么画,网上已经有很多教程了,方法主要是通过将柱状图或者条形图宽度改细,设置起来有点麻烦。 今天小编给大家说的这个方法呢跟快捷,更简单。(教程使用Origin 8.0 所以使用8.0及以上所有版本)

具体教程如下:

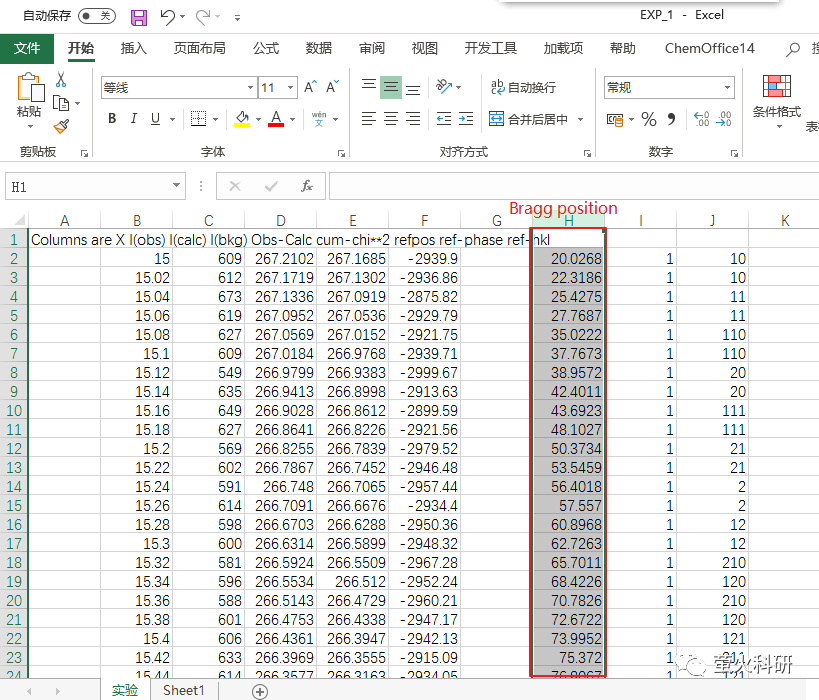
首先,你精修完将数据导出到Excel表格中,倒数第三列就是Bragg position数据,也就是出峰的位置。

4fc4e23b221a96e0b4b16a332a71f3a4.png

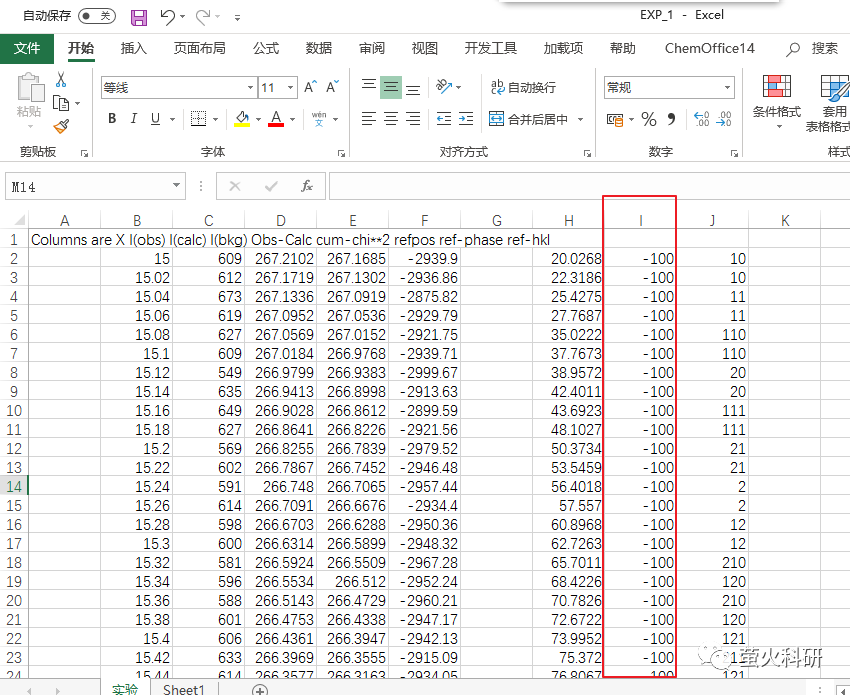
我们将倒数第二列的1全都改成一个负数,这个大小自己决定,后面可以改。

67cce04fe9aa361e022fe9b460d2a1df.png

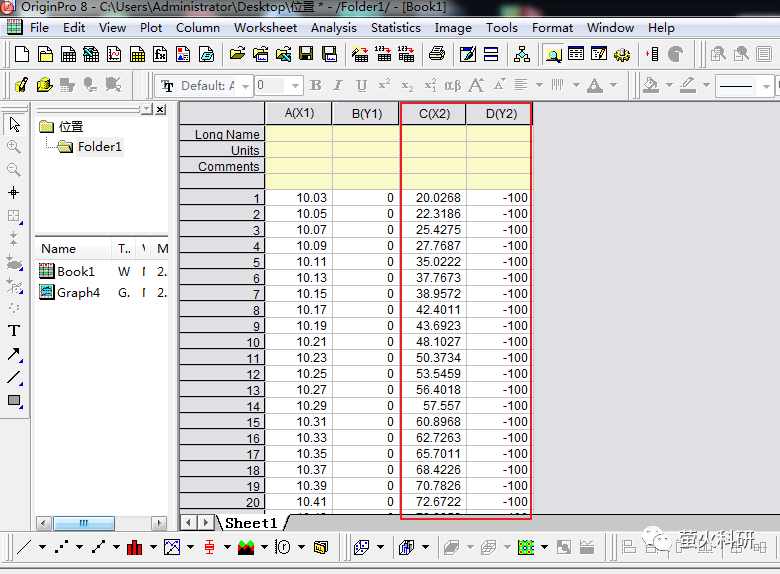
然后将数据复制粘贴到Origin软件中,我的图中不是完整的精修数据,只保留了一部分。前两列是精修后的数据,后两列就是上面Excel图表中的倒数第三第二列数据。将四列数据设置成XYXY格式。

3078d7bf2c28db7803de66f9f742713a.png

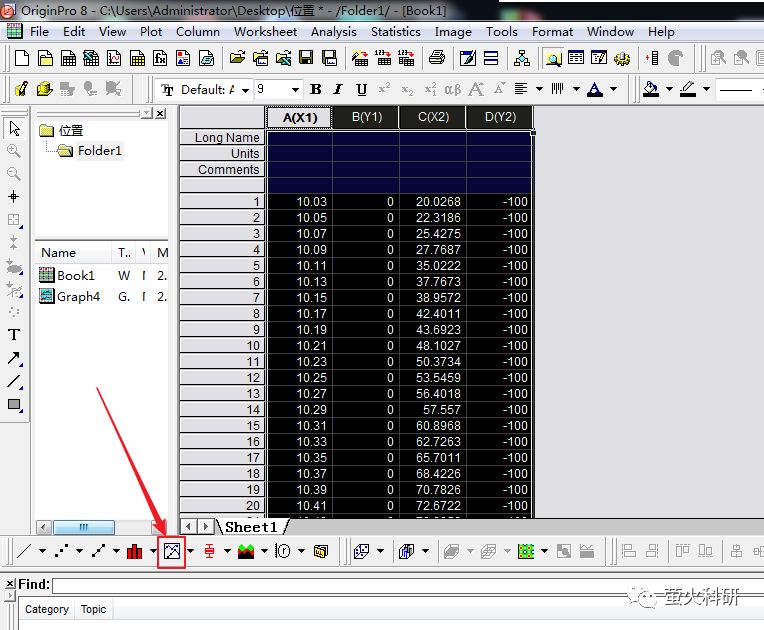
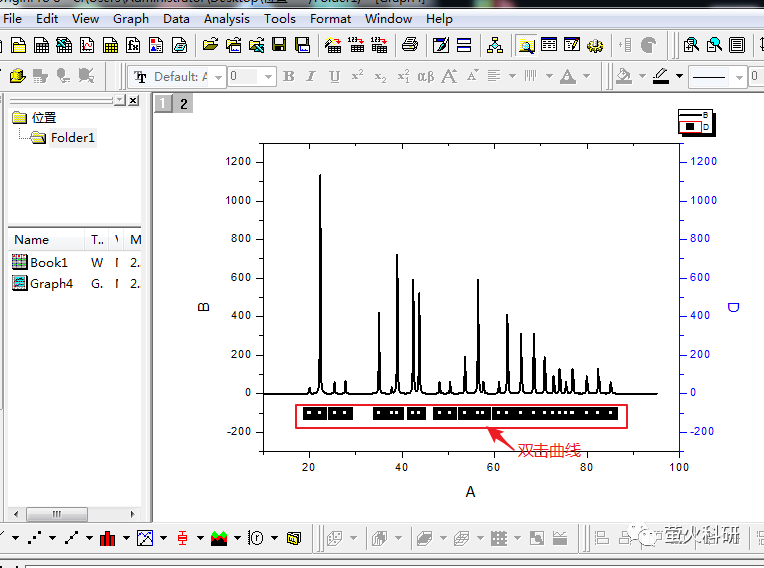
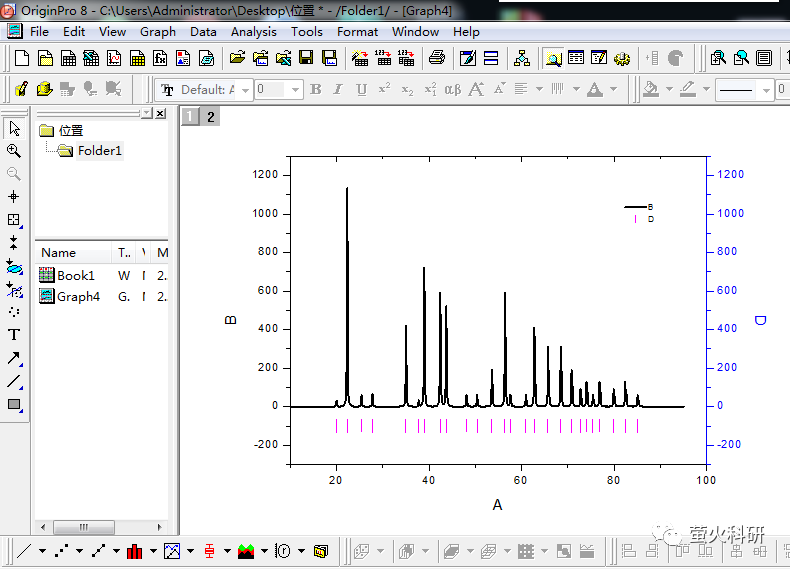
然后就是作图了,我选择Double Y Axis这个模板,将他们放在两个图层方便后面调整。如果你是精修后的所有数据的话最后也把Bragg position这组数据单独放在一个图层。

dc8771932ed1b998adef06e36d9c2a52.png

图出来了,我们双击底下的曲线将它的类型改为Scatter 散点图

37c7bbd379a7cdb8a62f814bbf3138ce.png

d59ee9227d3ac0f613f1aef161d682c7.png

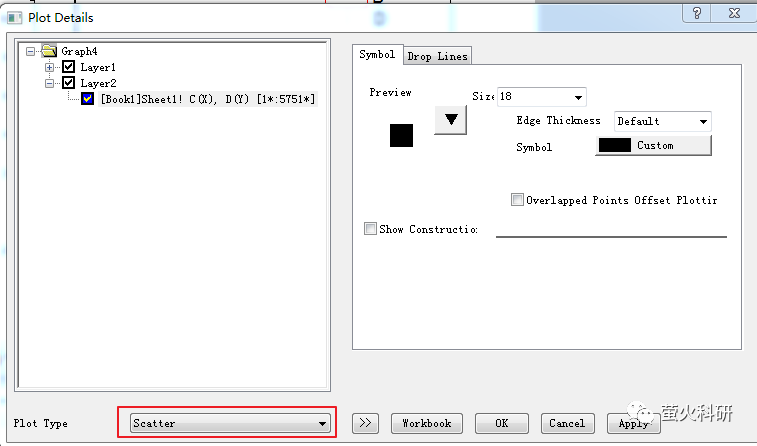
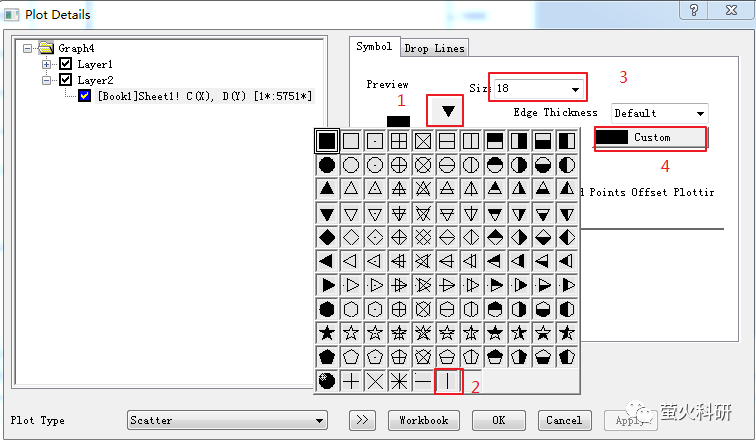
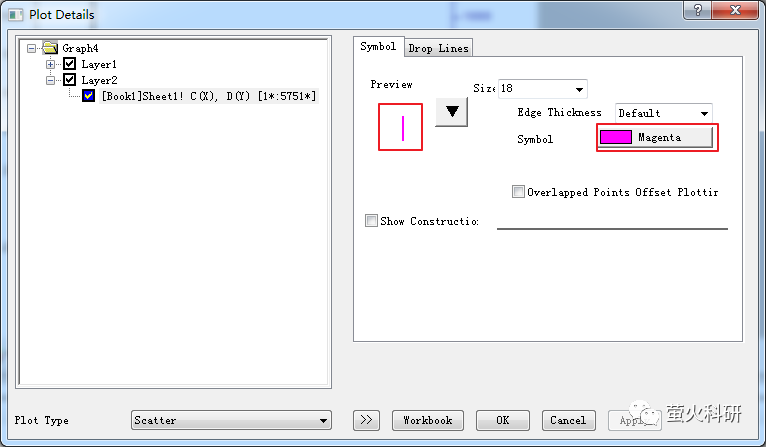
这里就是整个教程精华的部分了,点击Symbol——倒三角下拉框——选最后一个竖线,将Size设置为18 (个人经验,根据数据自行设置),修改一下颜色,点击应用——确定就好了。

605c47994429f282cc645ee094fcacec.png

5233cc4d39b10ef4da4e94e2869160d5.png

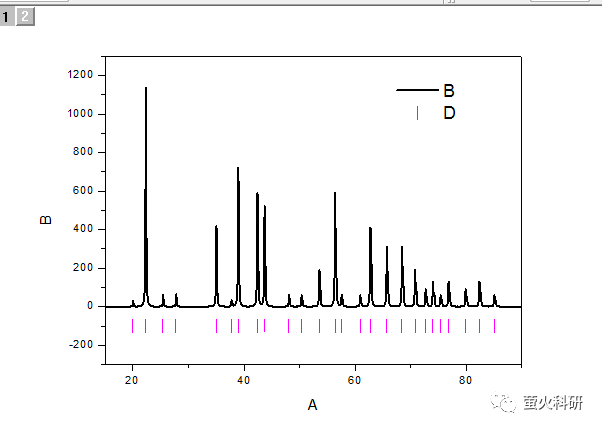
回到图窗口可以看到Bragg position竖线图应经画好了,完美。而且它不会因为你改坐标轴范围被压缩,不用来回调整,简直太香了。

9daa4c1c25e466fb61f863f410895aae.png

再胡乱调整一下坐标轴,线框啥的就完成了。

3a35a6e62dfbde6589872f69afb986ca.png

今天的教程就到这里了,你觉得今天的方法简单快捷吗?如果你还有更快更简单的方法也可以告诉我哦。

公众号后台回复“投稿”,即可在本公众号宣传您的工作。

华算科技专注理论计算模拟服务,是唯一拥有VASP商业版权及其计算服务资质和全职技术团队的计算服务公司,提供全程可追溯的原始数据,保证您的数据准确合法,拒绝学术风险。

目前我们已经完成超过500个服务案例,客户工作在JACS、Angew、AM、AEM、Nano Energy、Nature子刊、Science子刊等知名期刊发表。

a4a0a379e54a4323cf2fa7f00a86fff7.png

275dd8d0afcd761fed2309030fd693bb.gif 点击阅读原文,提交计算需求!
Python Machine Learning By Example by Yuxi (Hayden) Liu English | 31 May 2017 | ASIN: B01MT7ATL5 | 254 Pages | AZW3 | 3.86 MB Key Features Learn the fundamentals of machine learning and build your own intelligent applications Master the art of building your own machine learning systems with this example-based practical guide Work with important classification and regression algorithms and other machine learning techniques Book Description Data science and machine learning are some of the top buzzwords in the technical world today. A resurging interest in machine learning is due to the same factors that have made data mining and Bayesian analysis more popular than ever. This book is your entry point to machine learning. This book starts with an introduction to machine learning and the Python language and shows you how to complete the setup. Moving ahead, you will learn all the important concepts such as, exploratory data analysis, data preprocessing, feature extraction, data visualization and clustering, classification, regression and model performance evaluation. With the help of various projects included, you will find it intriguing to acquire the mechanics of several important machine learning algorithms – they are no more obscure as they thought. Also, you will be guided step by step to build your own models from scratch. Toward the end, you will gather a broad picture of the machine learning ecosystem and best practices of applying machine learning techniques. Through this book, you will learn to tackle data-driven problems and implement your solutions with the powerful yet simple language, Python. Interesting and easy-to-follow examples, to name some, news topic classification, spam email detection, online ad click-through prediction, stock prices forecast, will keep you glued till you reach your goal. What you will learn Exploit the power of Python to handle data extraction, manipulation, and exploration techniques Use Python to visualize data spread across multiple dimensions and extract useful features Dive deep into the world of analytics to predict situations correctly Implement machine learning classification and regression algorithms from scratch in Python Be amazed to see the algorithms in action Evaluate the performance of a machine learning model and optimize it Solve interesting real-world problems using machine learning and Python as the journey unfolds About the Author Yuxi (Hayden) Liu is currently a data scientist working on messaging app optimization at a multinational online media corporation in Toronto, Canada. He is focusing on social graph mining, social personalization, user demographics and interests prediction, spam detection, and recommendation systems. He has worked for a few years as a data scientist at several programmatic advertising companies, where he applied his machine learning expertise in ad optimization, click-through rate and conversion rate prediction, and click fraud detection. Yuxi earned his degree from the University of Toronto, and published five IEEE transactions and conference papers during his master's research. He finds it enjoyable to crawl data from websites and derive valuable insights. He is also an investment enthusiast. Table of Contents Getting Started with Python and Machine Learning Exploring the 20 newsgroups data set Spam email detection with Naive Bayes News topic classification with Support Vector Machine Click-through prediction with tree-based algorithms Click-through rate prediction with logistic regression Stock prices prediction with regression algorithms Best practices
评论
添加红包

请填写红包祝福语或标题

红包个数最小为10个

红包金额最低5元

当前余额3.43前往充值 >
需支付:10.00
成就一亿技术人!
领取后你会自动成为博主和红包主的粉丝 规则
hope_wisdom
发出的红包
实付
使用余额支付
点击重新获取
扫码支付
钱包余额 0

抵扣说明:

1.余额是钱包充值的虚拟货币,按照1:1的比例进行支付金额的抵扣。
2.余额无法直接购买下载,可以购买VIP、付费专栏及课程。

余额充值