


国内博客找了一圈,居然没有发现有用 vispy 做可视化的代码,这里做一个简单的示例,代码大部分来自官方。
import numpy as np
import vispy.scene
from vispy.scene import visuals
import sys
# Make a canvas and add simple view
canvas = vispy.scene.SceneCanvas(keys='interactive', show=True)
view = canvas.central_widget.add_view()
# # generate data 使用随机数据的话把这块反注释掉
# pos = np.random.normal(size=(100000, 3), scale=0.2)
# # one could stop here for the data generation, the rest is just to make the
# # data look more interesting. Copied over from magnify.py
# centers = np.random.normal(size=(50, 3))
# indexes = np.random.normal(size=100000, loc=centers.shape[0]/2.,
# scale=centers.shape[0]/3.)
# indexes = np.clip(indexes, 0, centers.shape[0]-1).astype(int)
# scales = 10**(np.linspace(-2, 0.5, centers.shape[0]))[indexes][:, np.newaxis]
# pos *= scales
# pos += centers[indexes]
# scatter = visuals.Markers()
# scatter.set_data(pos, edge_color=None, face_color=(1, 1, 1, .5), size=5)
# 使用 kitti 数据, n*3
img_id = 17 # 2,3 is not able for pcl;
path = r'D:KITTIObjecttrainingvelodyne%06d.bin' % img_id ## Path ## need to be changed
points = np.fromfile(path, dtype=np.float32).reshape(-1, 4)
# create scatter object and fill in the data
scatter = visuals.Markers()
scatter.set_data(points[:,:3], edge_color=None, face_color=(1, 1, 1, .5), size=5)
view.add(scatter)
view.camera = 'turntable' # or try 'arcball'
# add a colored 3D axis for orientation
axis = visuals.XYZAxis(parent=view.scene)
if __name__ == '__main__':
if sys.flags.interactive != 1:
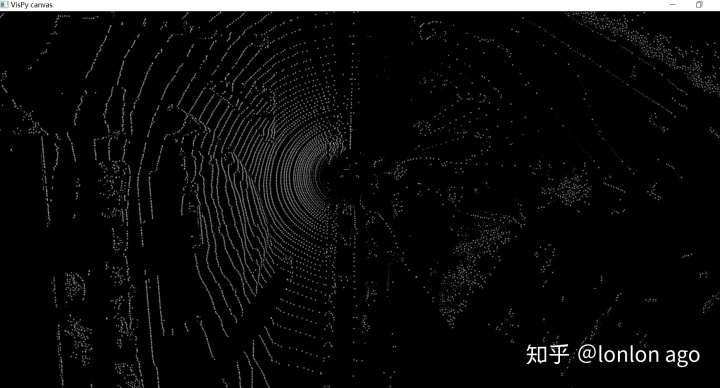
vispy.app.run()效果如如下,比pcl 显示效果略微差点,但是十多万个点滚动也很流畅:


 665
665


 被折叠的 条评论
为什么被折叠?
被折叠的 条评论
为什么被折叠?
 到【灌水乐园】发言


