


 这篇博客详细介绍了使用Python绘制眼图的过程,包括设置subplot显示参数以避免字符重叠,使用列表循环显示并清除超出范围的数据,以及筛选和清除脏点。此外,还强调了保存高分辨率图形的方法。示例代码展示了如何从文本文件读取数据,并为每个眼图设置轴标签、网格和图例。
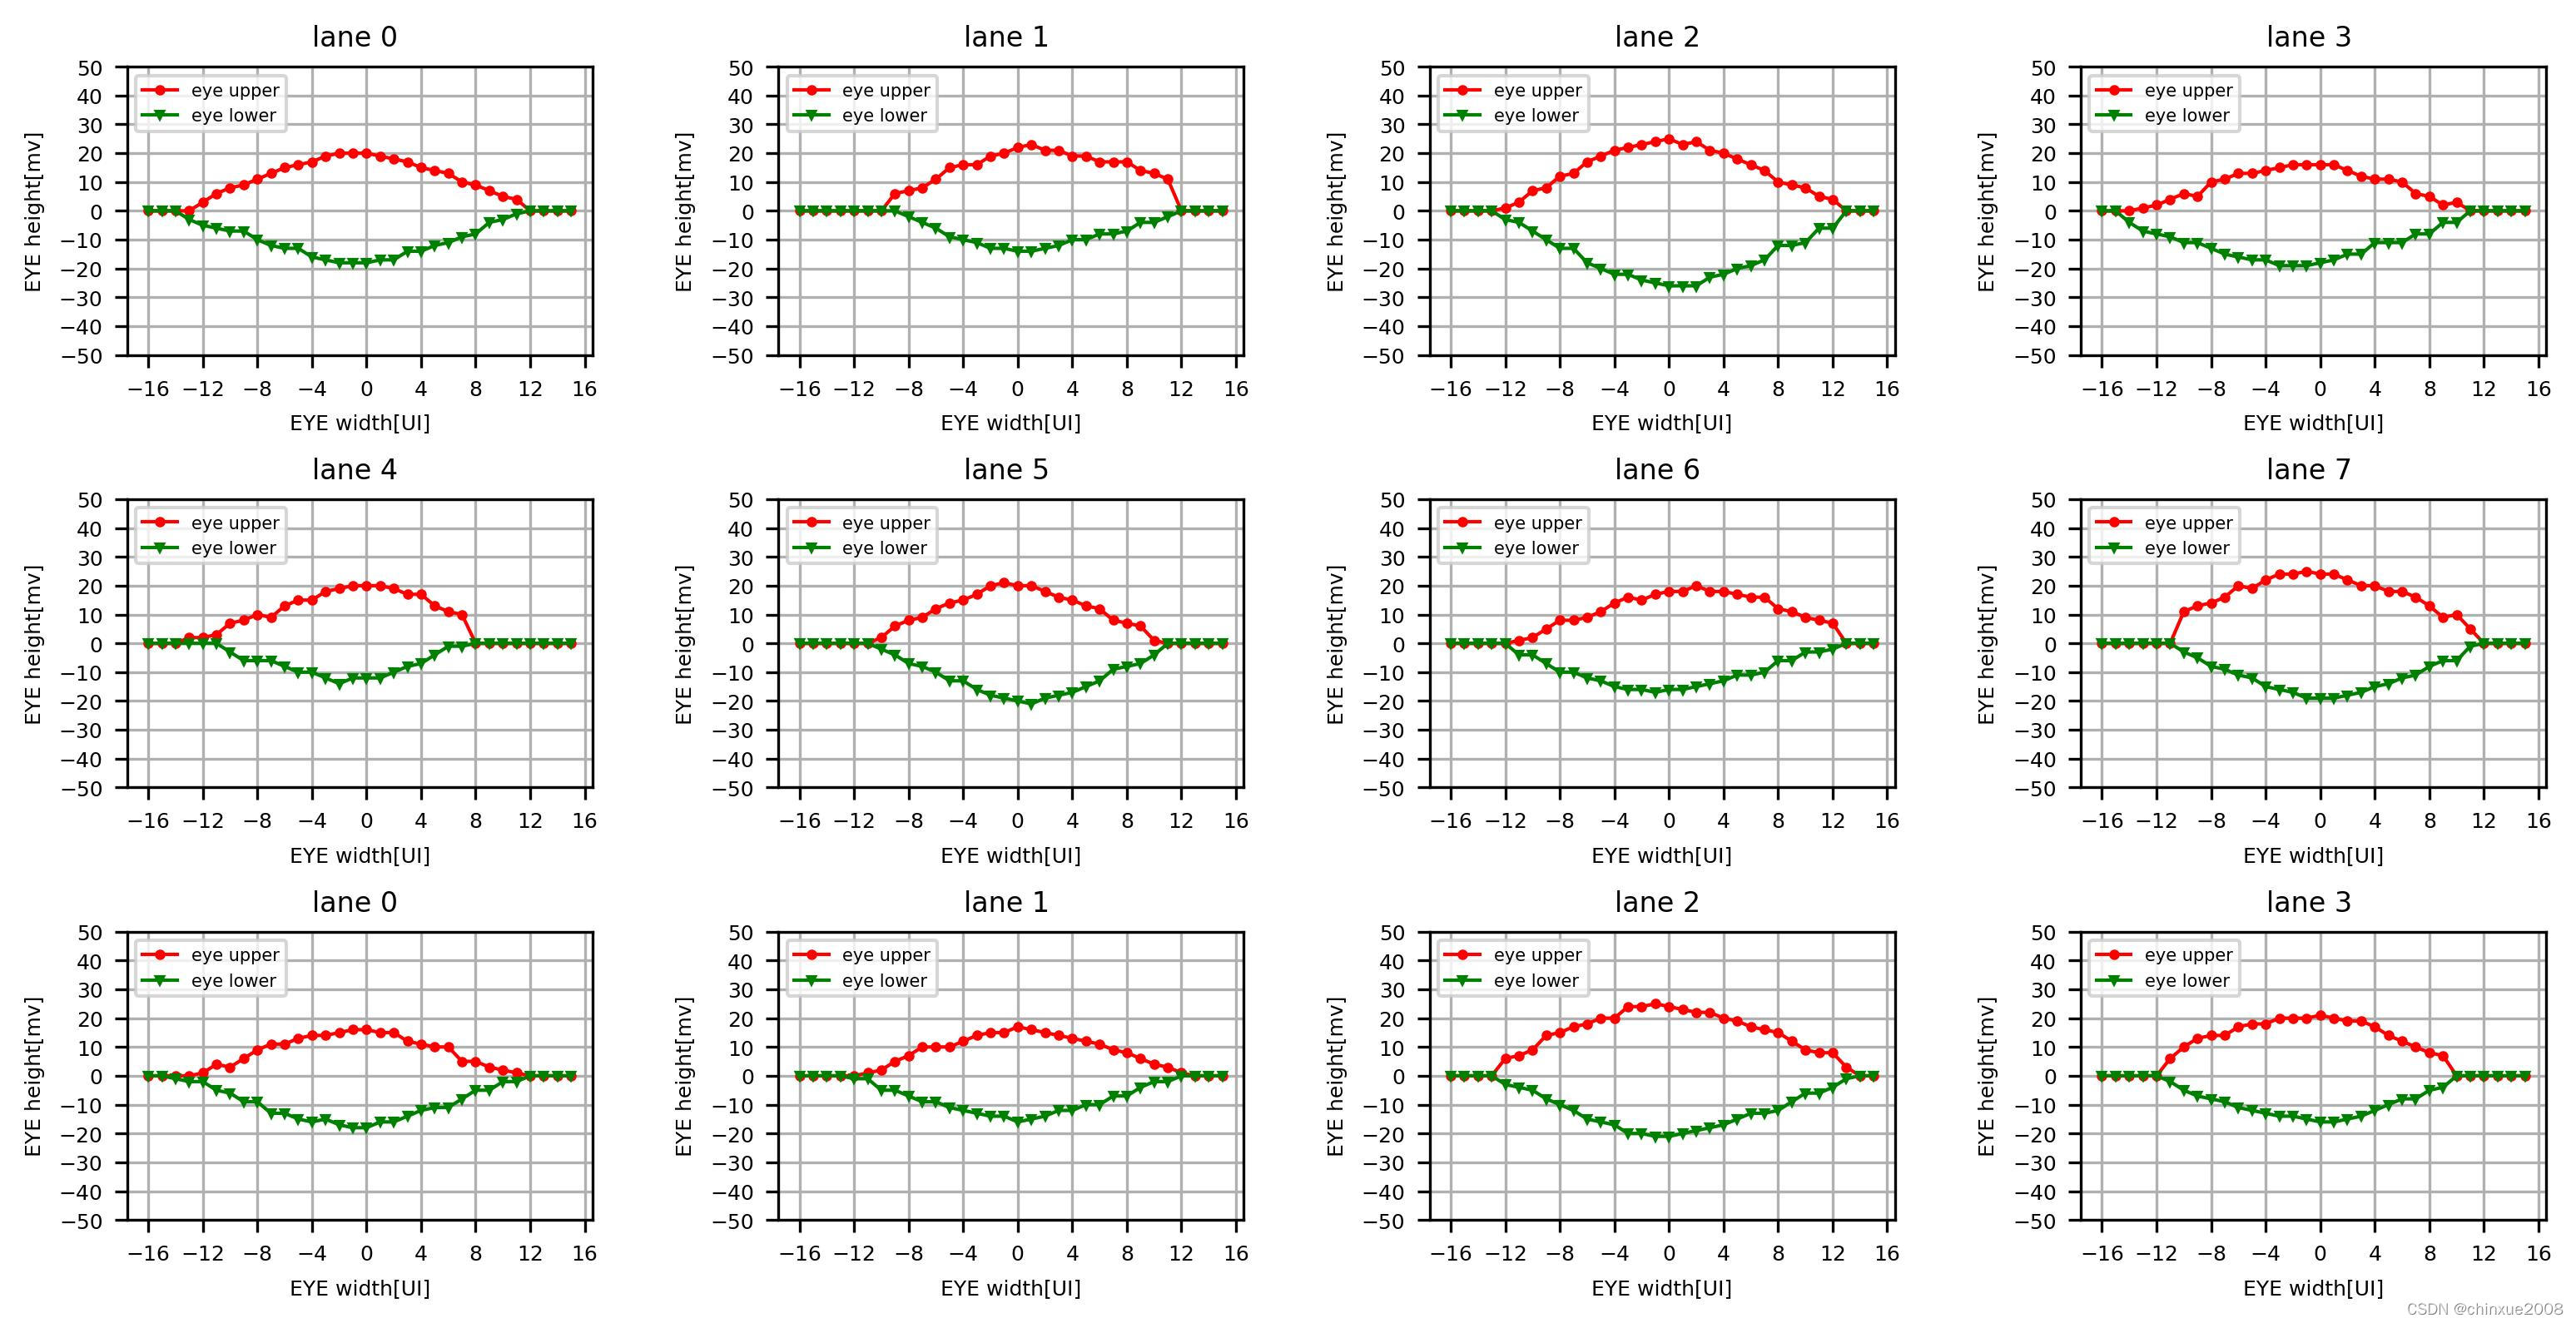
使用py绘制眼图,需要注意的点。
1.使用subplot需要设置显示参数,不然会字符重叠;
2.使用列表来循环显示,需要clear清空列表,不然超出范围;
3.部分脏点,需要用if进行筛选清除再画图;
4.保存的图形,如果直接点保存,则dpi不够,需要使用savefig设置dpi保存。
import os
import re
import matplotlib.pyplot as plt
import matplotlib.pylab as pylab
import scipy.io
import numpy as np
params={
    'axes.labelsize': '10',         #轴上字
    'xtick.labelsize':'6',        #轴图例
    'ytick.labelsize':'6',           #轴图例
    'lines.linewidth':1 ,              #线宽
    'legend.fontsize': '5',          #图例大小
    'figure.figsize': '12.5, 6'    # set figure size,长12,宽9
    # 'figure.dpi':'300'
}
pylab.rcParams.update(params)            #set figure parameter

upp=[]
upp_data=[]
low=[]
low_data=[]
lane=[]
fig1 = plt.figure("eye_diagram")
fig1.canvas.manager.window.wm_geometry('+10+5')
with open('204B-TX-EYE-0415-1751.txt', encoding='utf-8') as file_obj:
    contents = file_obj.readlines()
    for line in contents:
        if "upper" in line:
            # print(line)
            upp.append(line.strip())
        if "low" in line:
            low.append(line.strip())
        if "lane" in line:
            lane.append((line.strip())[:7])
file_obj.close()
print(len(upp))
for i in range(len(upp)):
    for s in (re.split(" +",upp[i]))[1:]:
        if s=="127":
            upp_data.append(0)
        else:
            upp_data.append(int(s))
    # print(upp_data)
    # print(len(upp_data))
    for s in (re.split(" +",low[i]))[1:]:
        if s=="-127":
            low_data.append(0)
        else:
            low_data.append(int(s))
    # print(low_data)
    # print(len(low_data))

    x1 = [-16,-15,-14,-13,-12,-11,-10,-9,-8,-7,-6,-5,-4,-3,-2,-1,0,1,2,3,4,5,6,7,8,9,10,11,12,13,14,15]

    ##每个眼图设置
    axes = plt.subplot(3,4,i+1)
    plt.plot(x1,upp_data,'ro-',label='eye upper',markersize=2)
    plt.plot(x1,low_data,'gv-',label='eye lower',markersize=2)
    upp_data.clear()
    low_data.clear()
    axes.set_xticks([-16,-12,-8,-4,0,4,8,12,16])
    axes.set_yticks([-50,-40,-30,-20,-10,0,10,20,30,40,50])
    axes.grid(True)  # add grid
    #坐标轴设置
    plt.title(lane[i],fontsize=8)
    plt.legend(loc="upper left")  #set legend location
    plt.ylabel('EYE height[mv]',fontsize=6)   # set ystick label
    plt.xlabel('EYE width[UI]',fontsize=6)  # set xstck label

plt.subplots_adjust(wspace=0.4,hspace=0.5)

plt.savefig('C:/Users/XX/Desktop/multiple_eye_diagram.jpg',dpi = 500,bbox_inches='tight')
plt.show()


 527
527

 被折叠的 条评论
为什么被折叠?
被折叠的 条评论
为什么被折叠?
 到【灌水乐园】发言


