


 本文探讨了在处理Ceph文件时遇到的链接池满问题,通过使用Amazon AWS Request Metrics收集指标,追踪链接池状态,最终定位到未释放连接的问题。通过自定义指标上报和日志排查,成功解决了并发过高引发的链接占用问题。
目录
背景
在处理ceph上的文件时,出现如下报错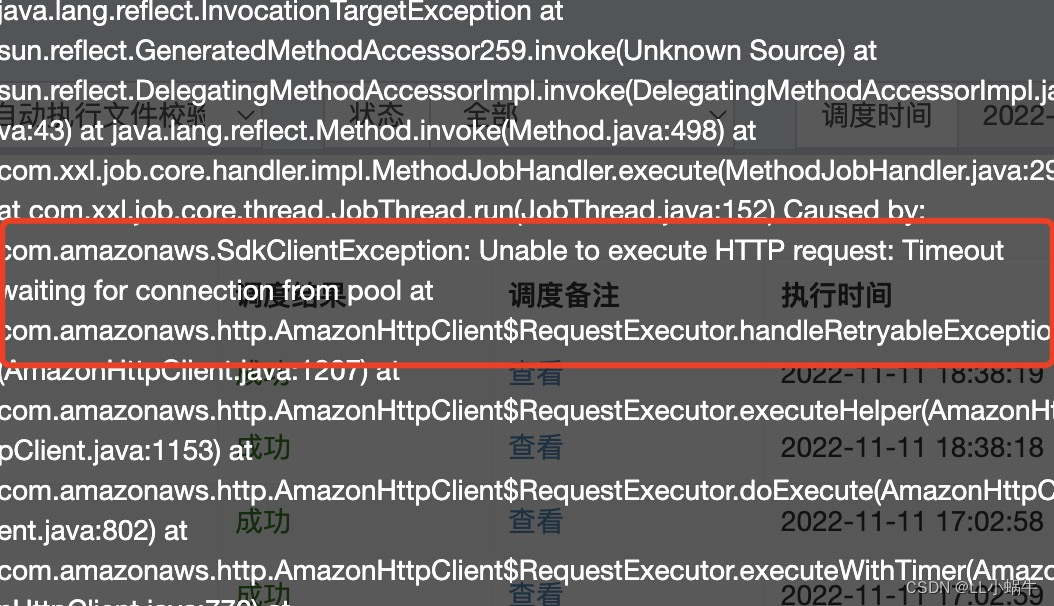
解决过程
上github搜了相关issue,其中该issue是因为采取并行处理读取ceph,打满链接池,而本地逻辑是串行,并不适用,但其提及从监控面板看链接池相关属性,用于辅助排查,而由于本地没有cloudwatch相关依赖,只能从本地监控面板观察情况
前置工作
查询相关资料,发现指标类
com.amazonaws.util.AWSRequestMetricsFullSupport通过以下方法进行收集指标
com.amazonaws.http.AmazonHttpClient.RequestExecutor#executeOneRequest通过以下方法来进行指标信息传递
com.amazonaws.AmazonWebServiceClient#endClientExecution(com.amazonaws.util.AWSRequestMetrics, com.amazonaws.Request<?>, com.amazonaws.Response<?>, boolean)其中链接池信息是通过以下方法来进行传递收集到指标的counter
com.amazonaws.http.AmazonHttpClient.RequestExecutor#captureConnectionPoolMetrics以getObjectRequest为例,下面为时序图
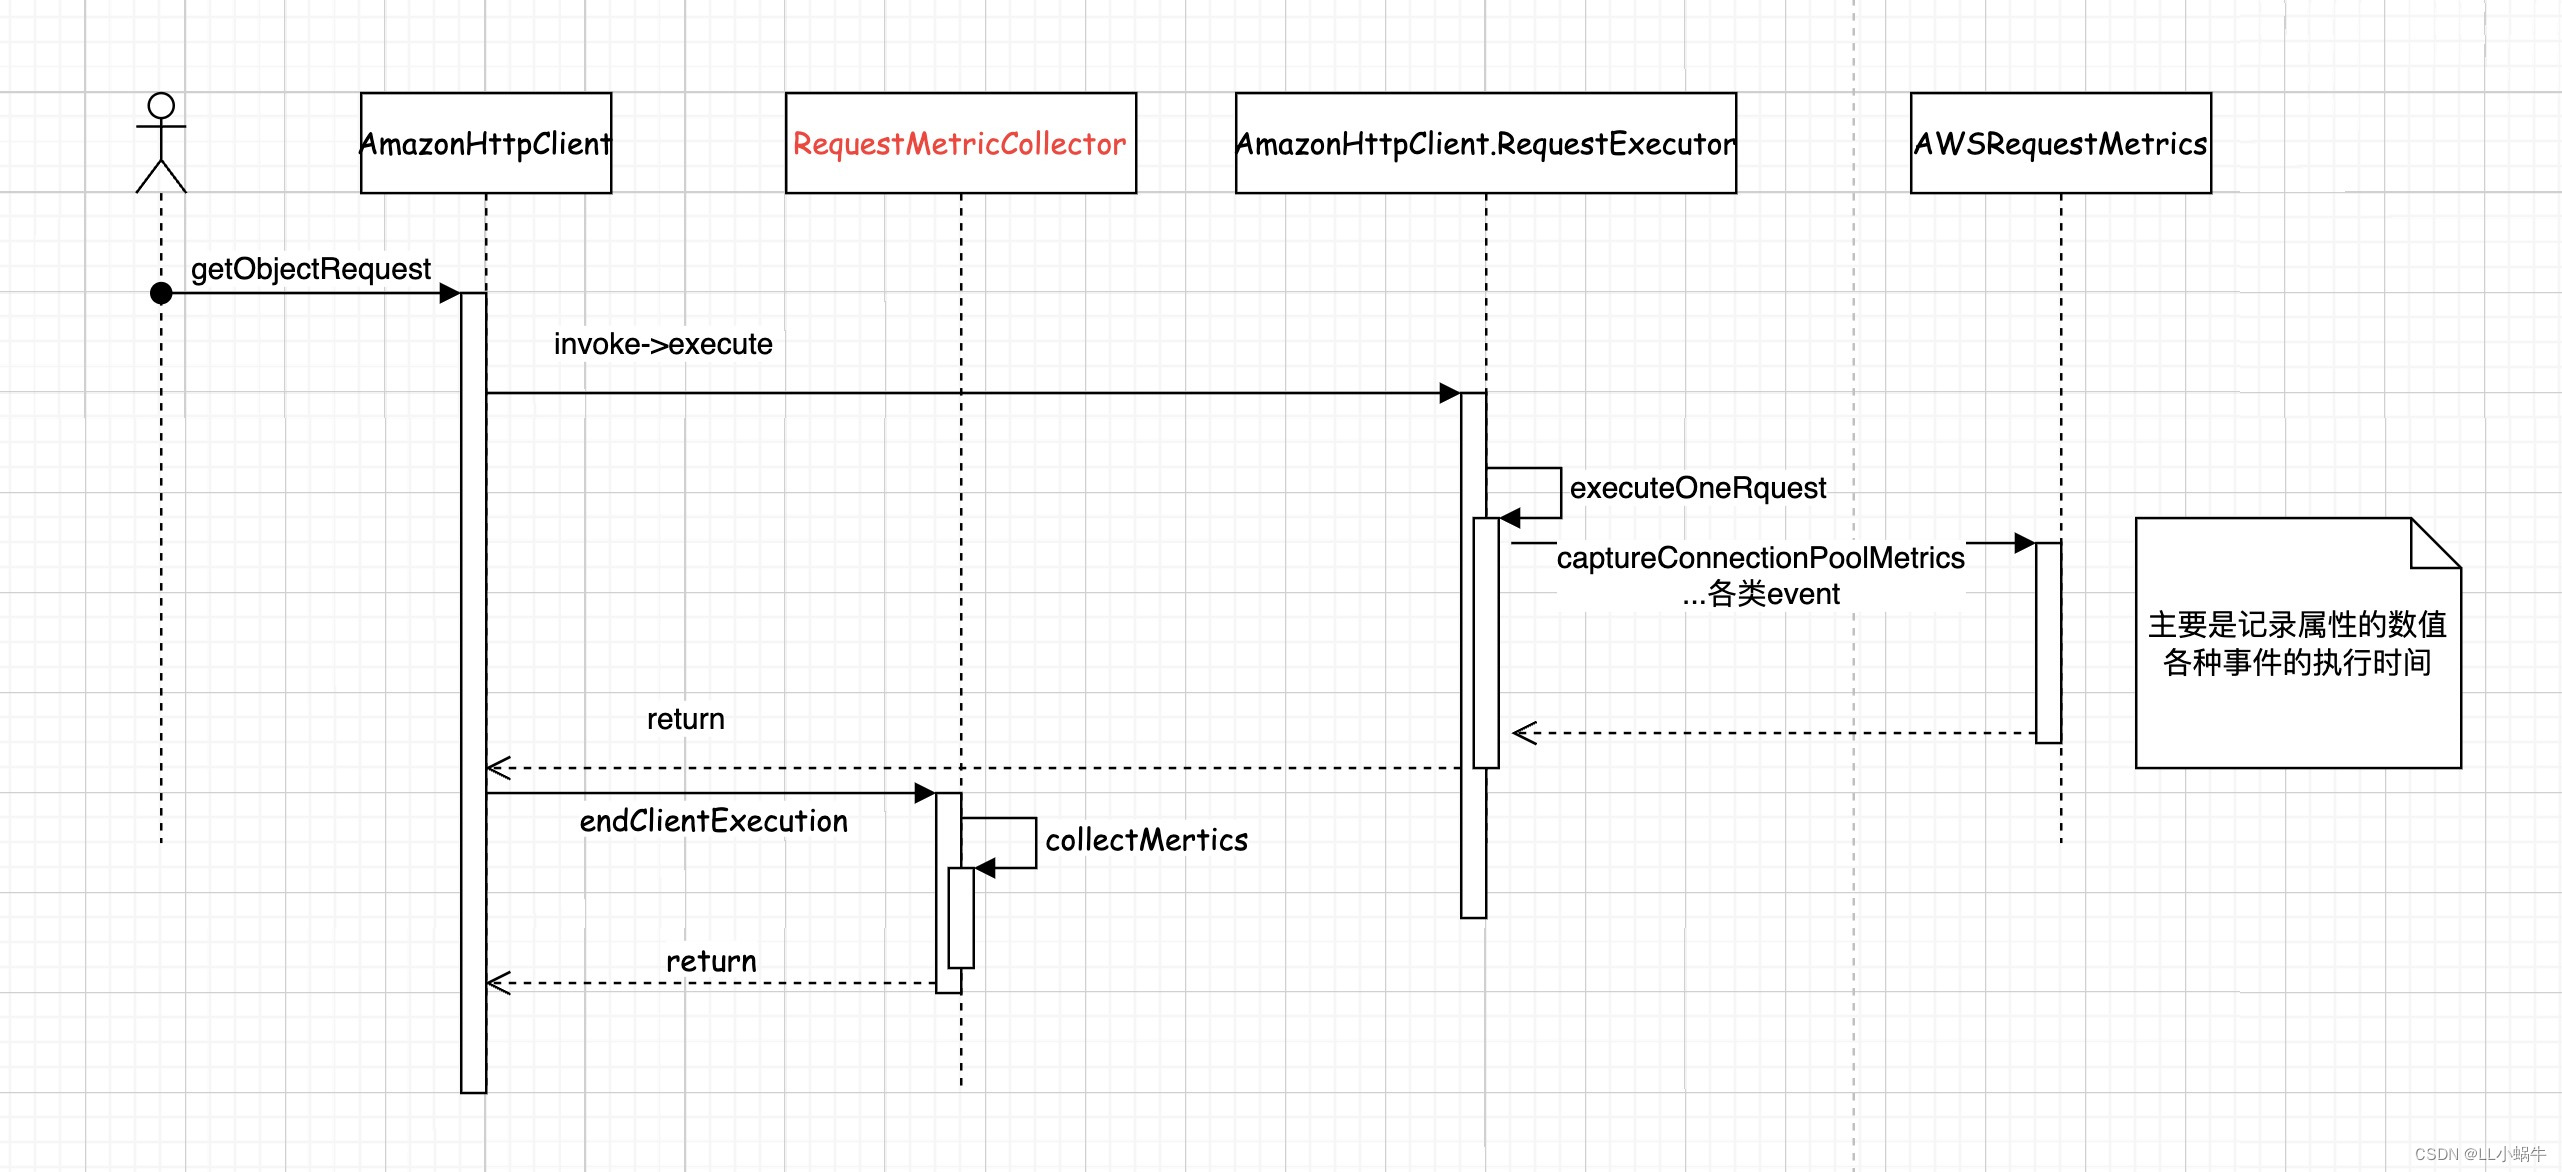
其中标红的类可以自定义逻辑,比如收集指标并上传到prometheus,用于排查问题
而是否开启指标监控由以下方法决定,可以看到request或者client有自定义的指标收集器的话,便会使用AWSRequestMetricsFullSupport 来做为收集器的实现,默认使用AWSRequestMetrics
com.amazonaws.AmazonWebServiceClient#createExecutionContext(com.amazonaws.AmazonWebServiceRequest, com.amazonaws.internal.auth.SignerProvider)通过以下方法去寻找收集器,优先级为request>client>sdk,默认实现为什么都不做(RequestMetricCollector#NONE)
com.amazonaws.AmazonWebServiceClient#findRequestMetricCollector指标收集
如上所示,可以在构建client时统一添加收集器逻辑
s3Client = AmazonS3ClientBuilder.standard()
                .withMetricsCollector(new RequestMetricCollector() {
                    @Override
                    public void collectMetrics(Request<?> request, Response<?> response) {
                        //do something
                        AWSRequestMetrics awsRequestMetrics = request.getAWSRequestMetrics();
                        TimingInfo timingInfo = awsRequestMetrics.getTimingInfo();
                        Map<String, Number> allCounters = timingInfo.getAllCounters();
                        Map<String, List<TimingInfo>> subMeasurementsByName = timingInfo.getSubMeasurementsByName();
                        System.out.println("finish");
                    }
                })
                .build();
也可以为特定请求进行指标收集
client.getObject(new GetObjectRequest(bucketName, fileName).withRequestMetricCollector(new RequestMetricCollector() {
            @Override
            public void collectMetrics(Request<?> request, Response<?> response) {

            }
}));可以发现有如下指标,具体解释
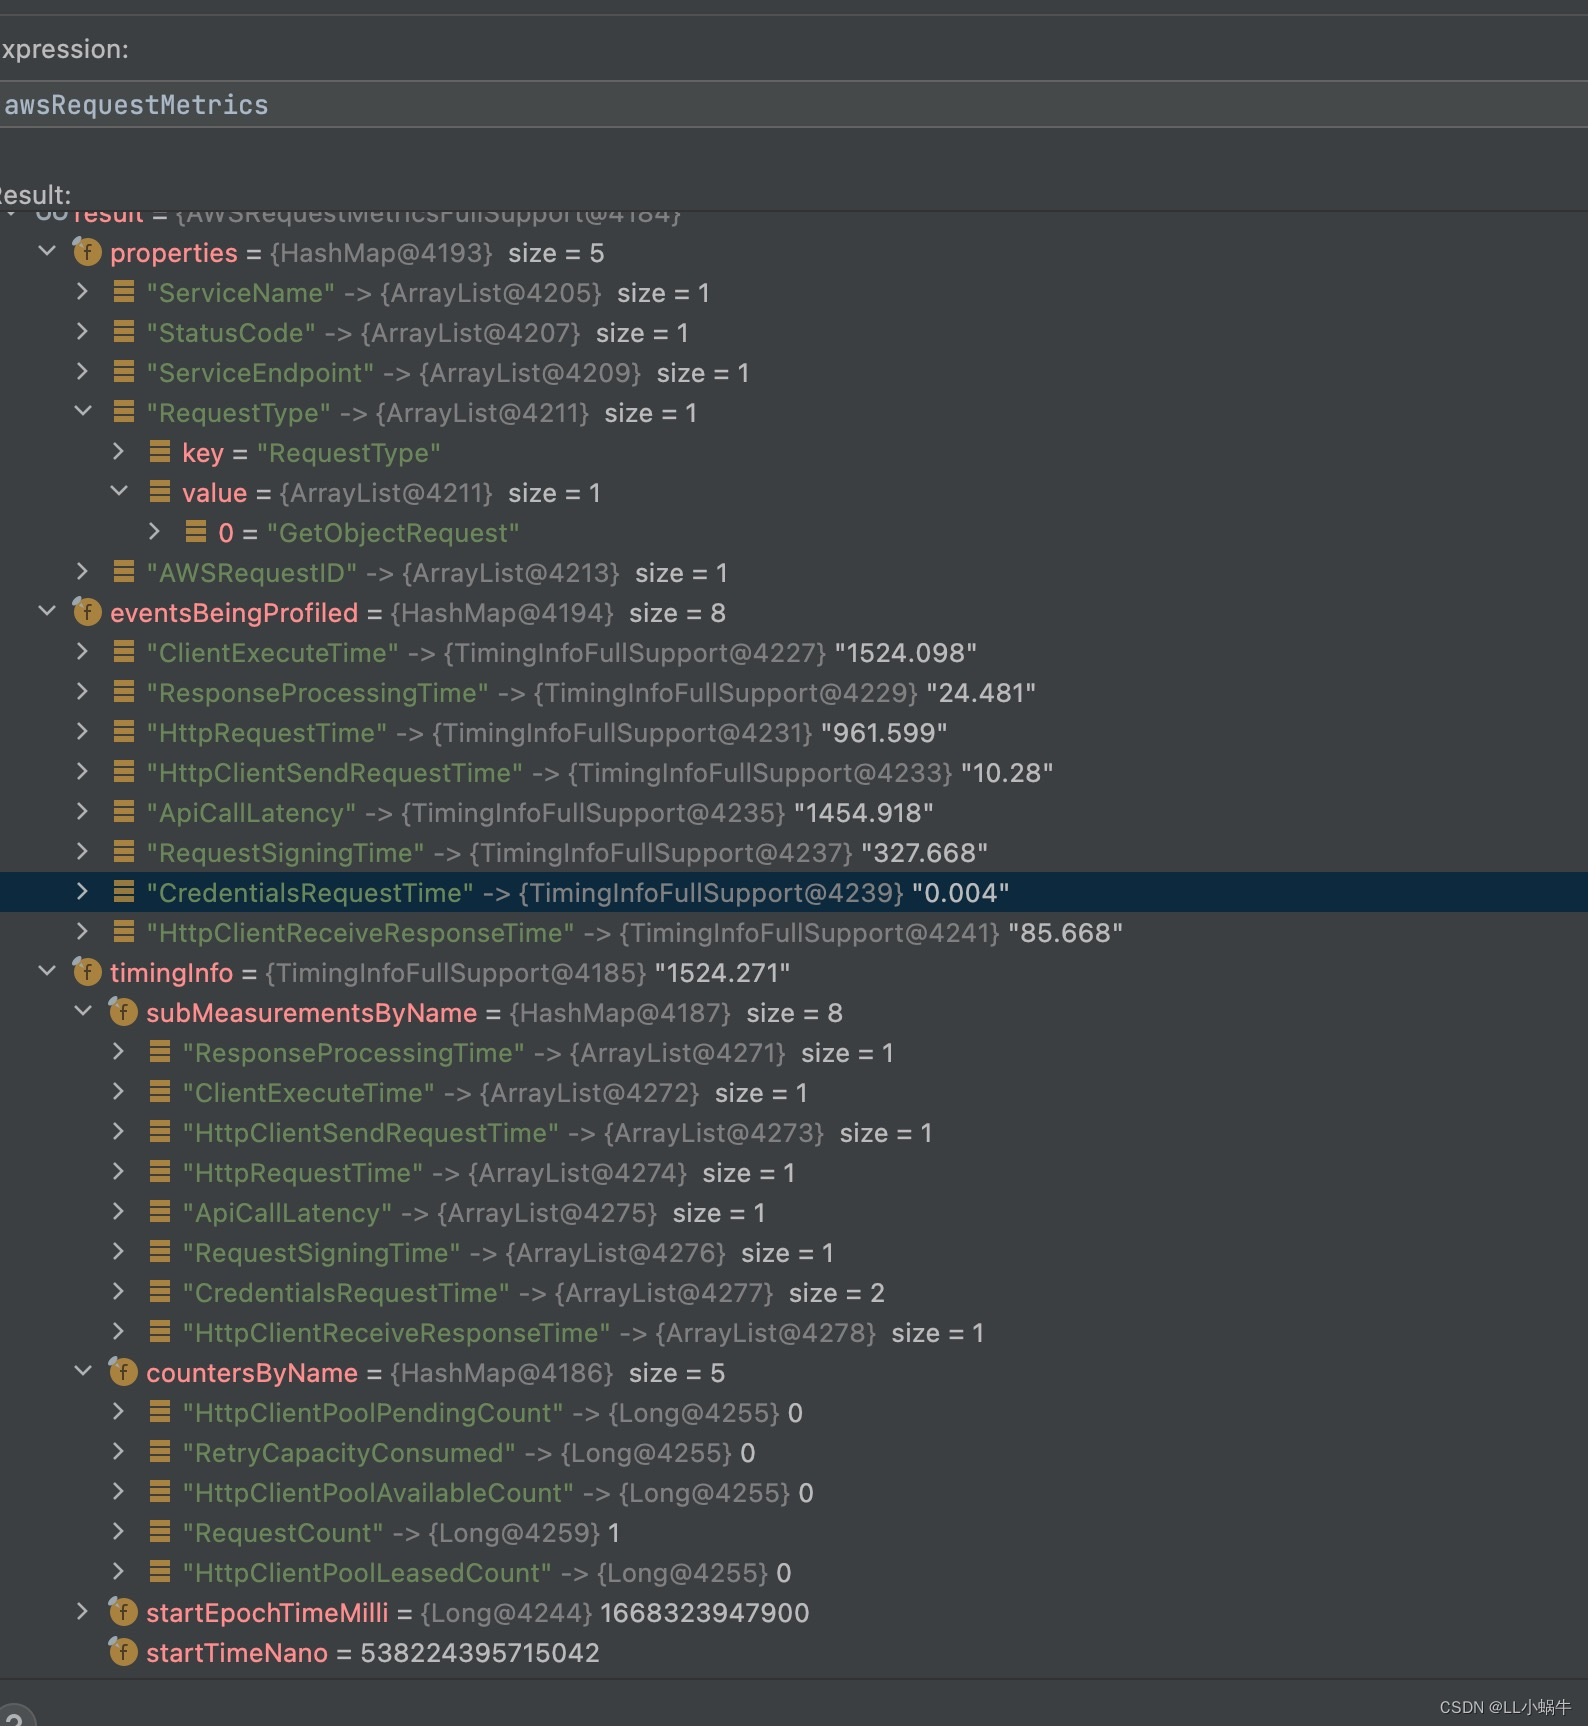
根据业务来收集上报需要的指标
以下是demo收集示例
@Slf4j
public class S3MetricCollector extends RequestMetricCollector {
public static Set<String> DEFAULT_TIME_INFO = new HashSet<>();
static {
DEFAULT_TIME_INFO.add("HttpRequestTime");
DEFAULT_TIME_INFO.add("HttpClientReceiveResponseTime");
}
private static volatile String INSTANCE_NAME = null;
private Gauge httpGauge = null;
private Gauge connectionGauge = null;
private Counter counter = null;
private static final S3MetricCollector INSTANCE = new S3MetricCollector();
private static final ThreadLocal<Set<String>> TYPE_SET = ThreadLocal.withInitial(HashSet::new);
private S3MetricCollector() {
httpGauge = Gauge.build().name("s3_client_http_info").labelNames("machine_id", "env", "counter").help("ceph客户端排查").register();
connectionGauge = Gauge.build().name("s3_client_connection_info").labelNames("machine_id", "env", "properties", "type").help("链接相关").register();
counter = Counter.build("s3_client_request", "s3 client返回状态").labelNames("machine_id", "env", "status", "type").register();
}
public static S3MetricCollector getINSTANCE() {
return INSTANCE;
}
public static void finish(AmazonS3 s3Client) {
getINSTANCE().doFinish(s3Client);
}
private void doFinish(AmazonS3 s3Client) {
String env = getEnv();
try {
Field field = AmazonWebServiceClient.class.getDeclaredField("client");
field.setAccessible(true);
AmazonHttpClient amazonHttpClient = (AmazonHttpClient) field.get(s3Client);
Field httpClient = AmazonHttpClient.class.getDeclaredField("httpClient");
httpClient.setAccessible(true);
ConnectionManagerAwareHttpClient o = (ConnectionManagerAwareHttpClient) httpClient.get(amazonHttpClient);
ConnPoolControl httpClientConnectionManager = (ConnPoolControl) o.getHttpClientConnectionManager();
PoolStats totalStats = httpClientConnectionManager.getTotalStats();
httpGauge.labels(INSTANCE_NAME, env
, HttpClientPoolAvailableCount.name()
).set(totalStats.getAvailable());
httpGauge.labels(INSTANCE_NAME, env
, HttpClientPoolLeasedCount.name()
).set(totalStats.getLeased());
httpGauge.labels(INSTANCE_NAME, env
, HttpClientPoolPendingCount.name()
).set(totalStats.getPending());
for (String s : DEFAULT_TIME_INFO) {
for (String type : TYPE_SET.get()) {
connectionGauge.labels(INSTANCE_NAME, env, s, type).set(0.0);
}
}
} catch (IllegalAccessException e) {
throw new RuntimeException(e);
} catch (NoSuchFieldException e) {
throw new RuntimeException(e);
} finally {
TYPE_SET.remove();
}
}
@Override
public void collectMetrics(Request<?> request, Response<?> response) {
AWSRequestMetricsFullSupport awsRequestMetrics = (AWSRequestMetricsFullSupport) request.getAWSRequestMetrics();
TimingInfo timingInfo = awsRequestMetrics.getTimingInfo();
Map<String, Number> allCounters = timingInfo.getAllCounters();
String env = getEnv();
String instanceName = getInstanceName();
String type = getValue(awsRequestMetrics.getProperty(AWSRequestMetrics.Field.RequestType));
for (Map.Entry<String, Number> entry : allCounters.entrySet()) {
httpGauge.labels(instanceName, env
, entry.getKey()
).set(Double.parseDouble(entry.getValue().toString()));
}
Set<String> typeSet = TYPE_SET.get();
if (typeSet == null) {
typeSet = new HashSet<>();
}
if (typeSet.add(type)) {
TYPE_SET.set(typeSet);
}
for (String s : DEFAULT_TIME_INFO) {
TimingInfo subMeasurement = timingInfo.getSubMeasurement(s);
connectionGauge.labels(instanceName, env, s, type).set(Optional.ofNullable(subMeasurement).map(TimingInfo::toString).map(Double::parseDouble).orElse(0.0));
}
counter.labels(instanceName, env, response.getHttpResponse().getStatusCode() + "", type).inc();
}
private static String getEnv() {
String env = "local";
try {
env = SpringContextUtil.getProperties("spring.profiles.active");
} catch (Exception e) {
}
return env;
}
public static void setInfo(AmazonWebServiceRequest serviceRequest) {
serviceRequest.withRequestMetricCollector(S3MetricCollector.getINSTANCE());
}
public String getValue(List<Object> values) {
if (values == null) {
return "";
}
return values.stream().map(Object::toString).collect(Collectors.joining(","));
}
protected static String getInstanceName() {
if (INSTANCE_NAME == null) {
synchronized (S3MetricCollector.class) {
if (INSTANCE_NAME == null) {
String port = SpringContextUtil.getProperties("server.port");
try {
InetAddress addr = InetAddress.getLocalHost();
INSTANCE_NAME = addr.getHostName() + ":" + port;
} catch (UnknownHostException e) {
log.error("get host error", e);
INSTANCE_NAME = "unknown:" + port;
}
}
}
}
return INSTANCE_NAME;
}
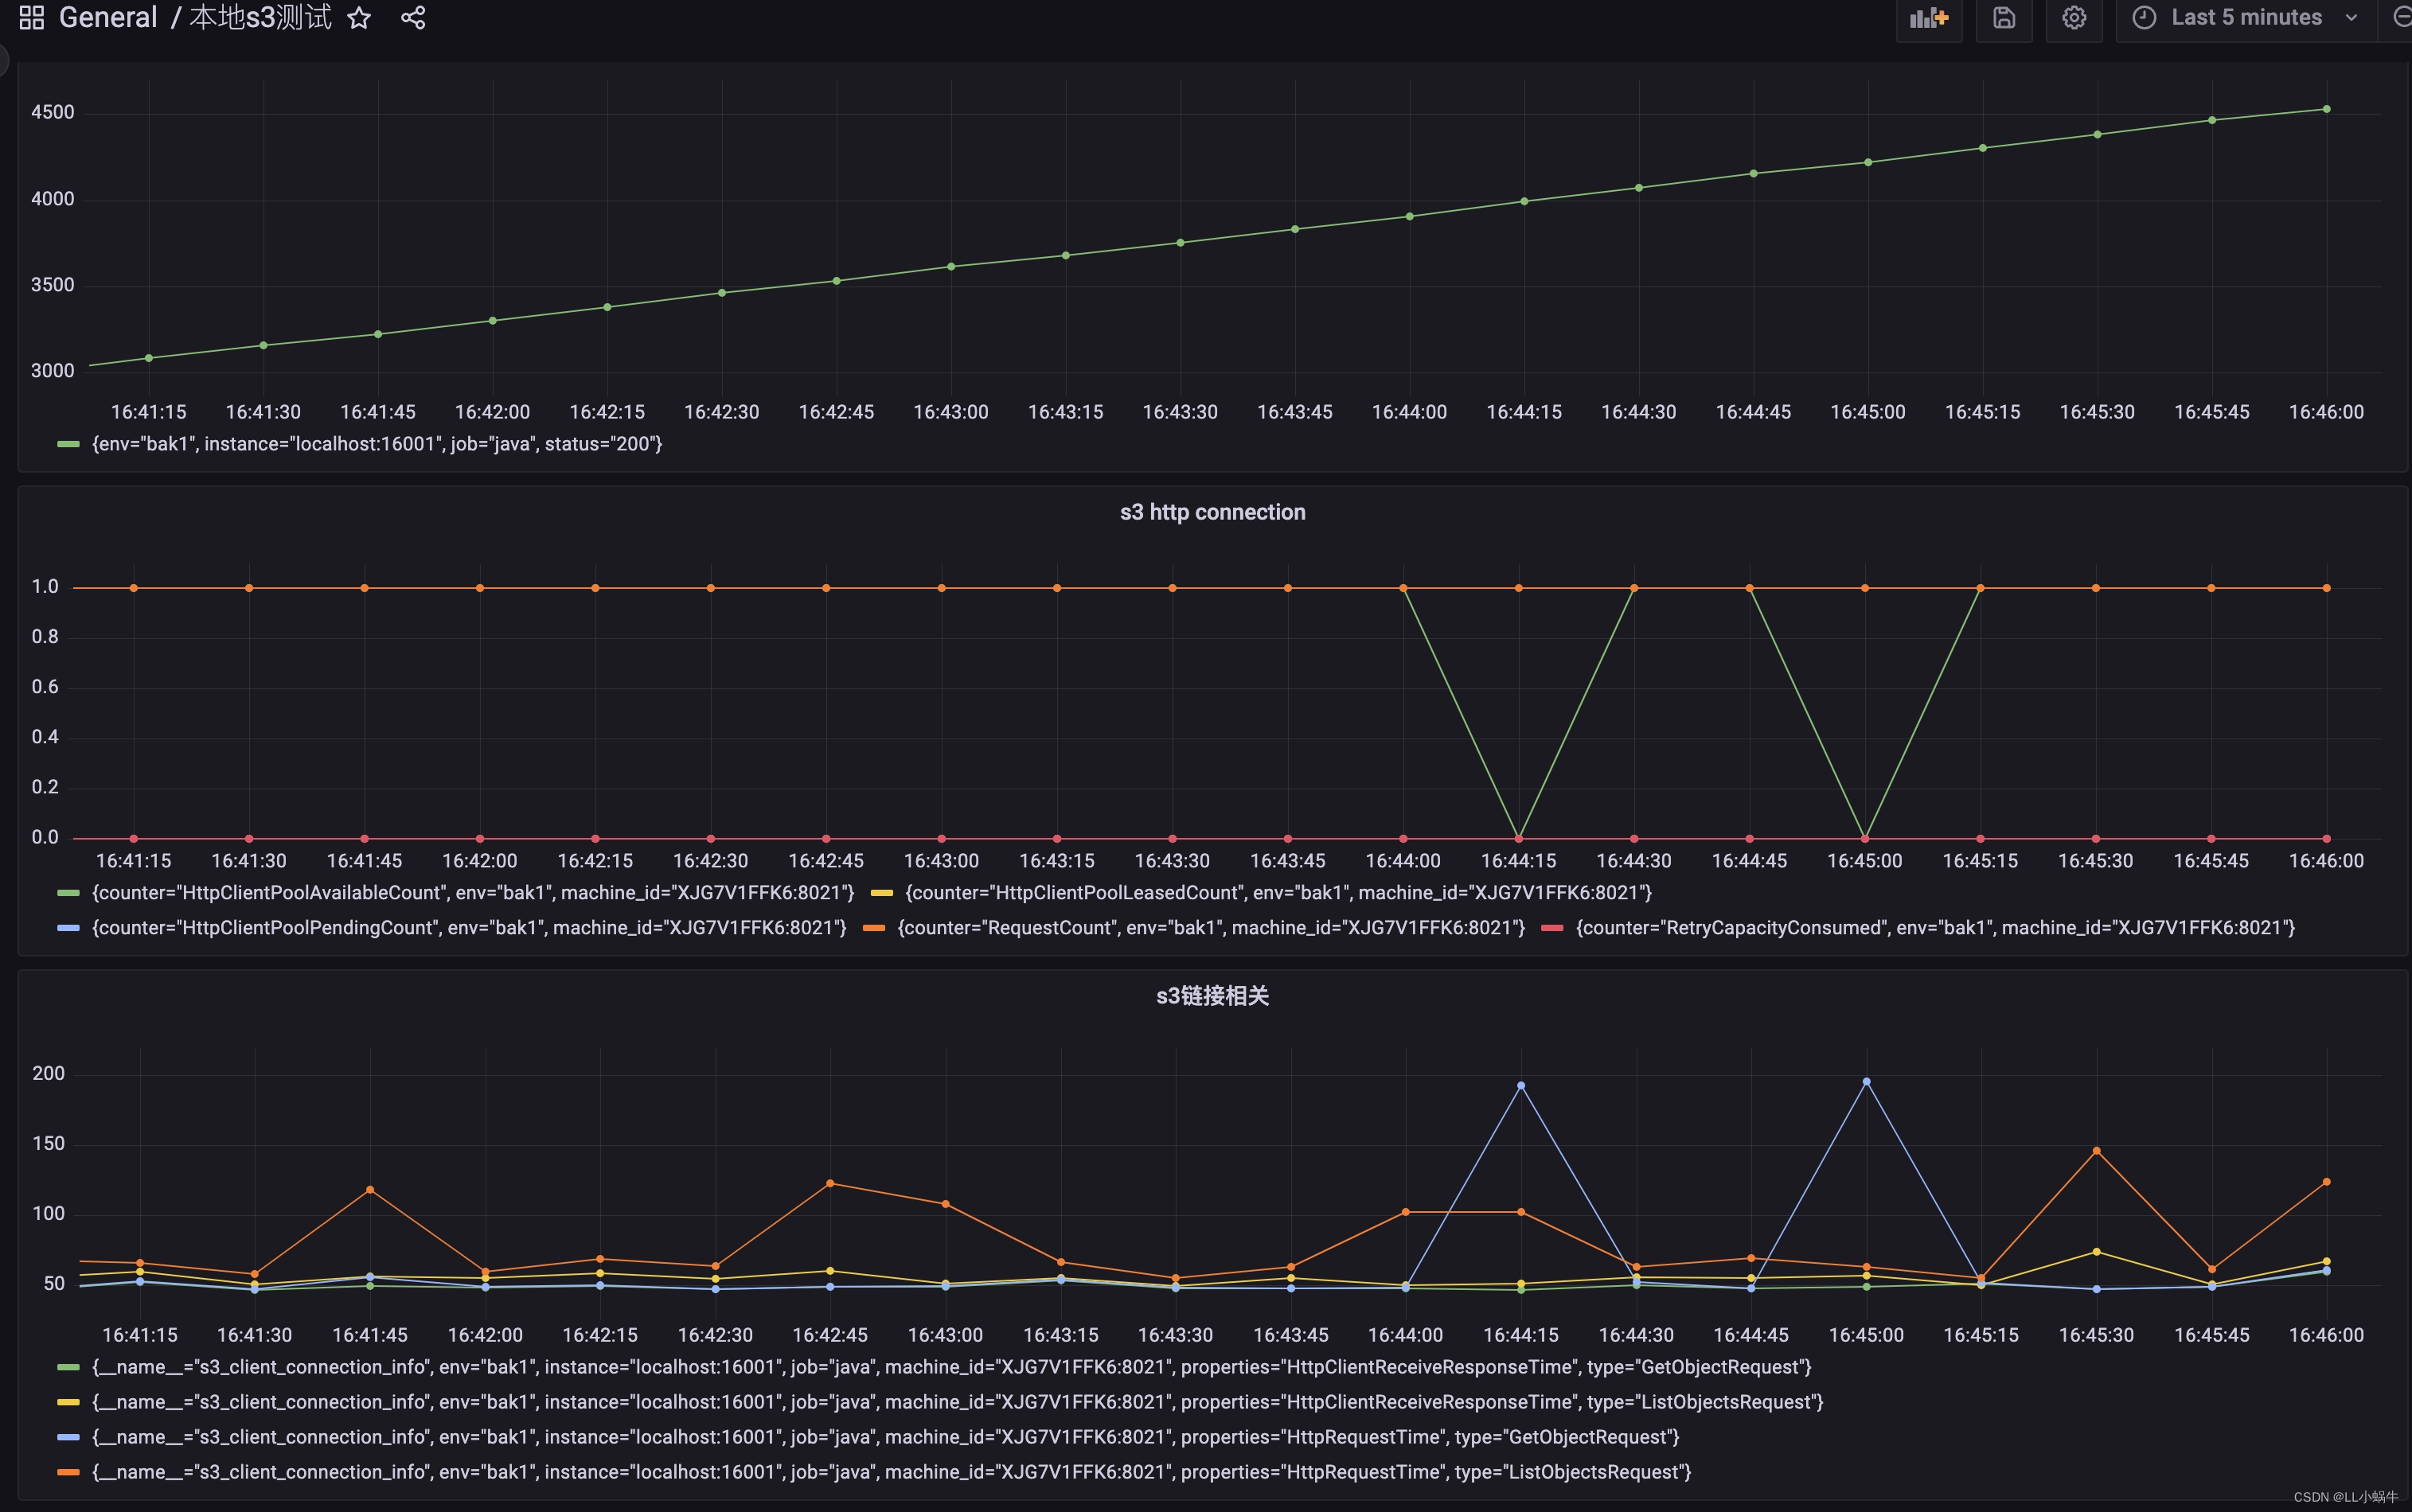
}收集并上报到prometheus,并通过grafana进行查看,发现确实是由于链接数过多,占满了链接池(默认最大值为50),而导致后续获取超时,获取http链接逻辑为以下方法
org.apache.http.pool.AbstractConnPool#getPoolEntryBlocking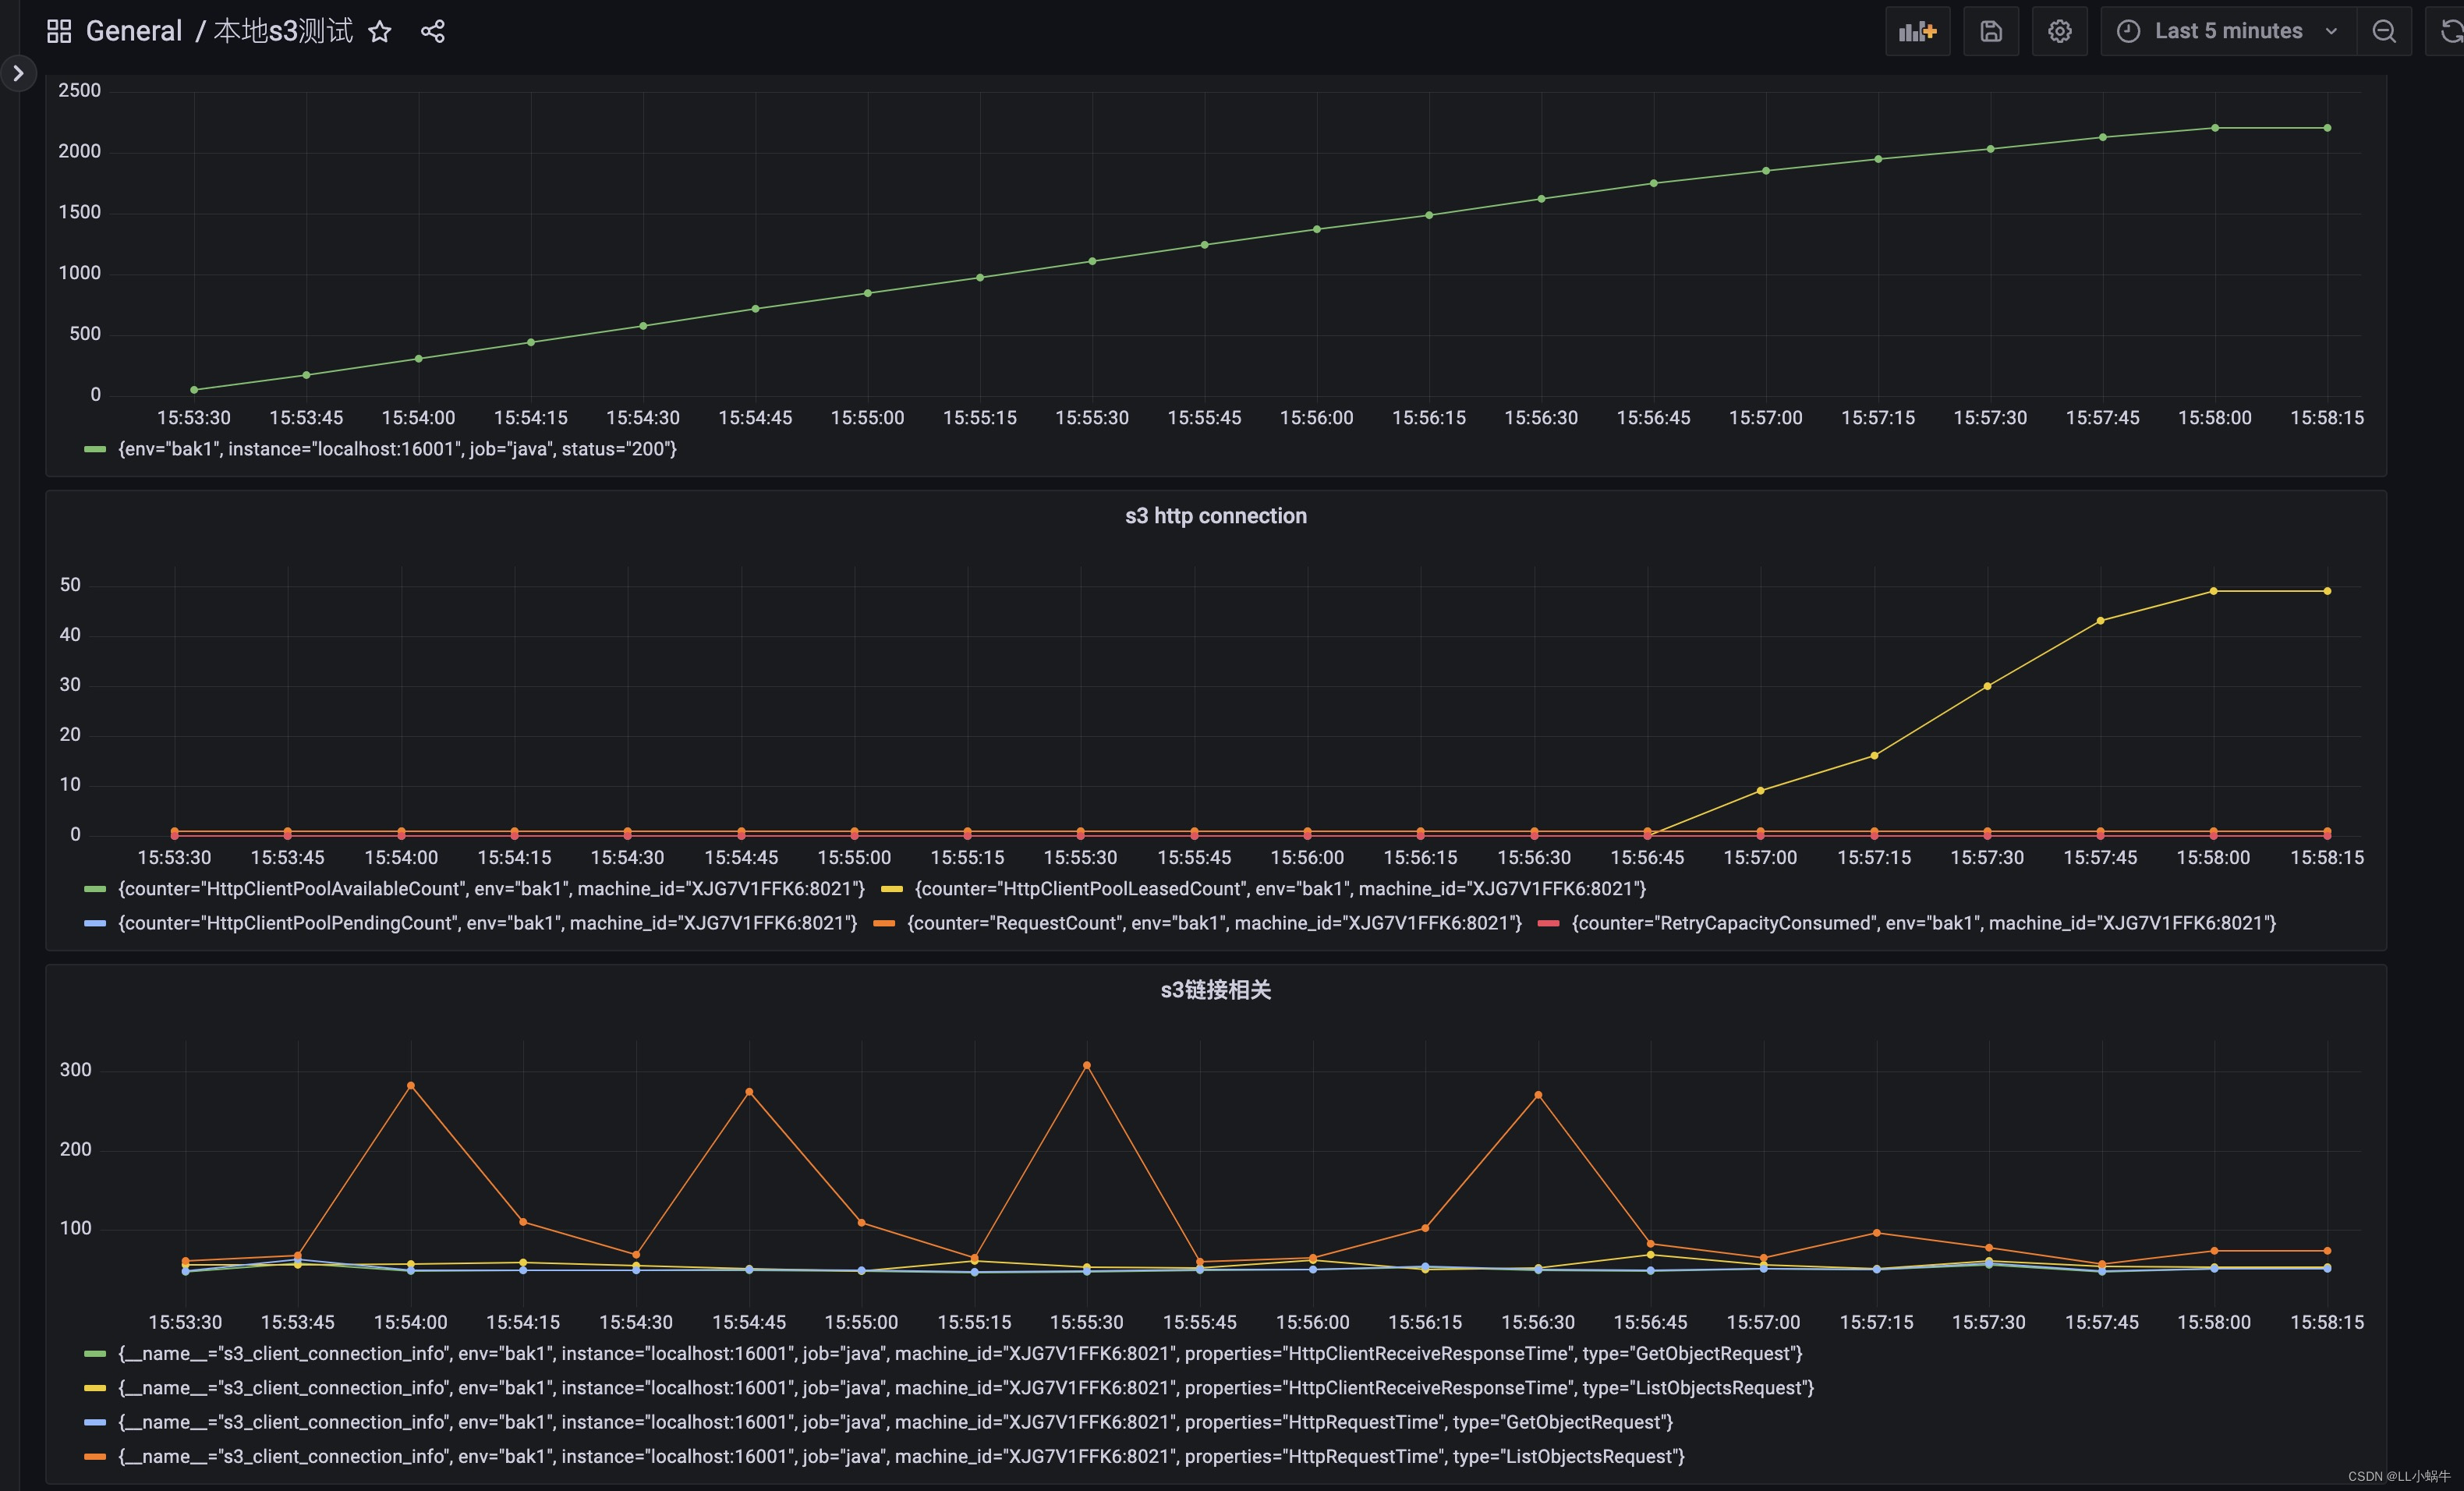
问题解决
可以看到占用链接一直增涨,下一步便是找到链接占用过多的原因,目前了解到的有如下原因
1.并发度高,确实打满链接池
2.某些链接没释放
显然属于第二点,找到占用链接数开始升高的时间节点,并查看相关的运行日志,发现确实有相关异常没处理,导致流没有关闭,链接也一直占用。
如下图,修正后没有出现该现象
总结
s3客户端提供相对丰富的指标辅助问题排查,通过自定义的指标上报,找出异常情况的时间节点,结合日志进行排查,相对方便地解决了问题,也可以做一些预警,比如请求的增速,链接占用数,慢操作等


 582
582

 被折叠的 条评论
为什么被折叠?
被折叠的 条评论
为什么被折叠?
 到【灌水乐园】发言


