


绘制多图
关键:
fig = plt.figure(1) 表示新建第几个图
import matplotlib.pyplot as plt

fig = plt.figure(1)
plt_rec_loss = [1,2,3,4,5,6]
plt_rec_recall = [4,3,6,5,8,9]
plt.xlabel("epoch")
plt.ylabel("loss")
plt.plot(range(len(plt_rec_loss)), plt_rec_loss)

fig = plt.figure(2)
plt.xlabel("epoch")
plt.ylabel("recall")
plt.plot(range(len(plt_rec_recall)), plt_rec_recall)

plt.show()
绘制多例图
import matplotlib.pyplot as plt

plt_rec_loss = [1,2,3,4,5,6]
plt_rec_recall = [4,3,6,5,8,9]
plt.xlabel("epoch")
plt.ylabel("test")
plt.plot(range(len(plt_rec_loss)), plt_rec_loss)
plt.plot(range(len(plt_rec_recall)), plt_rec_recall, color="r")

plt.show()
绘制多个子图
关键:
plt.subplot(211) 将画布分为2行1列,这个子图位于被划分的画布的第一块子图位置。
plt.subplot(212) 将画布分为2行1列,这个子图位于被划分的画布的第二块子图位置。
import matplotlib.pyplot as plt

plt_rec_loss = [1,2,3,4,5]
plt_rec_recall = [4,3,6,7,8,9]
ax1 = plt.subplot(211)
plt.xlabel("epoch")
plt.ylabel("loss")
plt.plot(range(len(plt_rec_loss)), plt_rec_loss)
ax2 = plt.subplot(212)
plt.xlabel("epoch")
plt.ylabel("recall")
plt.plot(range(len(plt_rec_recall)), plt_rec_recall, color="r")
plt.show()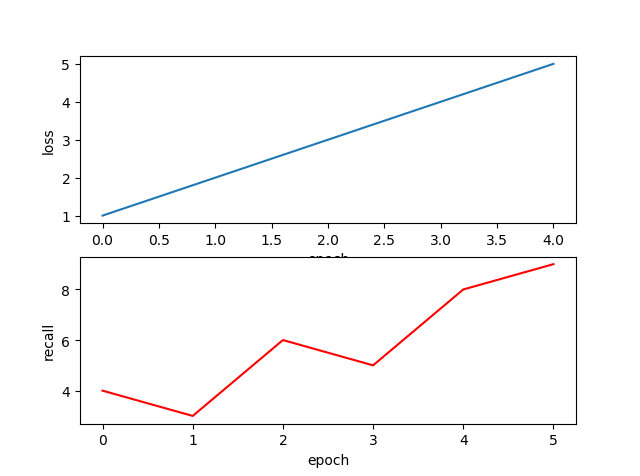


 被折叠的 条评论
为什么被折叠?
被折叠的 条评论
为什么被折叠?
 到【灌水乐园】发言


