一、获取国内股票代码
import tushare
import pandas
import datetime
tickersRawDate = tushare.get_stock_basics()
#日期是索引,所以这里是index.tolist
tickers = tickersRawDate.index.tolist()
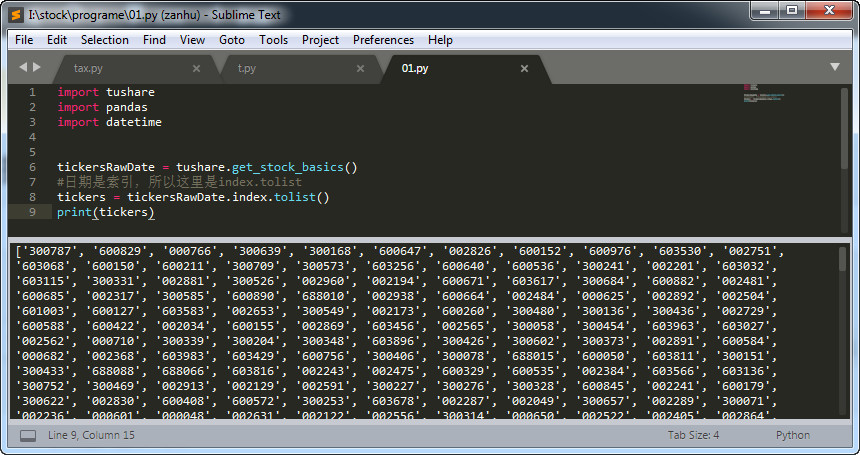
print(tickers)
备注:使用to_CSV的话,使用excel打开会乱码,用sublime打开就不会了。
效果展示:

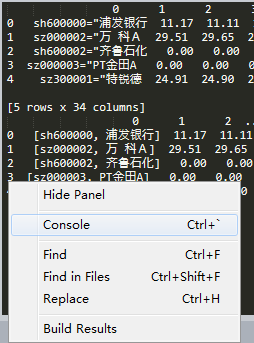
备注:如何在sublime中执行python
点击右下角的一个图标,在弹出的菜单中选择“console”,然后按“Ctrl+B”

二、获取国外股票代码
import requests
import pandas
import io
import datetime
import os
import time
def dataframeFromUrl(url):
dataString = requests.get(url).content
parsedResult = pandas.read_csv(io.StringIO(dataString.decode('utf-8')), index_col=0)
return parsedResult
def stockPriceIntraday(ticker, folder):
# Step 1. Get data online
url = 'https://www.alphavantage.co/query?apikey=NGV2US07ZZQULVGP&function=TIME_SERIES_INTRADAY&symbol={ticker}&interval=1min&outputsize=full&datatype=csv'.format(ticker=ticker)
intraday = dataframeFromUrl(url)
# Step 2. Append if history exists
file = folder+'/'+ticker+'.csv'
if os.path.exists(file):
history = pandas.read_csv(file, index_col=0) #将第0行,第0列作为它的索引列。
intraday.append(history)
# Step 3. Inverse based on index
intraday.sort_index(inplace=True) #sort_index是指按index建立索引
#intraday.index.name = 'timestamp' #修改index的name
# Step 4. Save
intraday.to_csv(file)
print ('Intraday for ['+ticker+'] got.')
# Step 1. Get ticker list online
tickersRawData = dataframeFromUrl('https://www.nasdaq.com/screening/companies-by-industry.aspx?exchange=NASDAQ&&render=download')
tickers = tickersRawData.index.tolist()
# Step 2. Save the ticker list to a local file
dateToday = datetime.datetime.today().strftime('%Y%m%d')
file = '../02. Data/00. TickerListUS/TickerList'+dateToday+'.csv'
tickersRawData.to_csv(file)
print ('Tickers saved.')
# Step 3. Get stock price (intraday)
for i, ticker in enumerate(tickers):
try:
print ('Intraday', i, '/', len(tickers))
stockPriceIntraday(ticker, folder='../02. Data/01. IntradayUS')
time.sleep(2)
except:
pass
print ('Intraday for all stocks got.')
地址:https://www.bilibili.com/video/av24528809/?p=4
https://www.bilibili.com/video/avPZ6BY1AWHTPGAIZL
三、生成散点图、K线图
import pandas
import matplotlib
import mpl_finance
import matplotlib.pyplot as plt
matplotlib.style.use('ggplot')
#matplotlib.style.use('dark_background')
def stockPricePlot(ticker):
# Step 1. Load Data
history = pandas.read_csv('../02. Data/01. IntradayUS/'+ticker+'.csv', parse_dates=True, index_col=0)
# Step 2. Data Manipulation
close = history['close'] #这里close会自动带上timestamp的索引。
close = close.reset_index() #增加一个额外的索引列,从0开始
#matplot对时间要求很高,要求转化成它内部的一个整数型数组(映射到matlib的整数域)
close['timestamp'] = close['timestamp'].map(matplotlib.dates.date2num)
ohlc = history[['open', 'high', 'low', 'close']].resample('1H').ohlc() #按1小时重新采样
ohlc = ohlc.reset_index()
ohlc['timestamp'] = ohlc['timestamp'].map(matplotlib.dates.date2num)
# Step 3. Plot Figures. Subplot 1: scatter plot. Subplot 2: candle stick plot.
# Step 3.1. Subplot 1: scatter plot
#总图表2行一列,这个散点图在0行0列开始,占据一行,一列
subplot1 = plt.subplot2grid((2,1), (0,0), rowspan=1, colspan=1)
subplot1.xaxis_date() #为了让横轴设置成时间
subplot1.plot(close['timestamp'], close['close'], 'b.') #分别是x轴、y轴、蓝色
plt.title(ticker) #图的标题
# Step 3.2. Subplot 2: candle stick plot
subplot2 = plt.subplot2grid((2,1), (1,0), rowspan=1, colspan=1, sharex=subplot1) #sharex=subplot1表示和subplot1共享X轴
#ax为画图的位置,quotes是数据
mpl_finance.candlestick_ohlc(ax=subplot2, quotes=ohlc.values, width=0.01, colorup='g', colordown='r')
plt.show()
stockPricePlot('AAON')
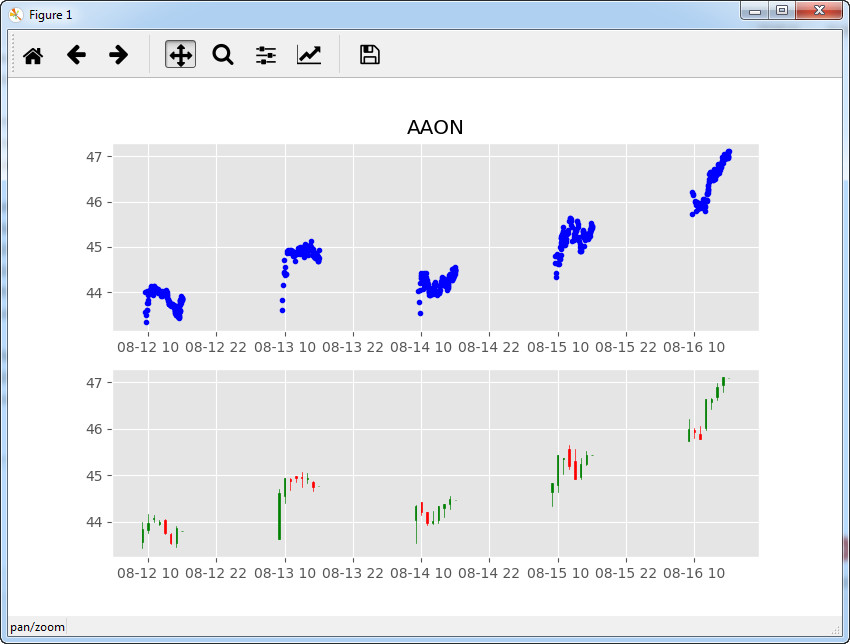
成果展示:


 5266
5266


 被折叠的 条评论
为什么被折叠?


