


 本文介绍了使用Python的matplotlib、pyecharts和iplot库绘制饼图的方法。通过示例展示了如何用这些库处理DataFrame数据,并呈现Netflix_show TV/Movie比例的饼图。
使用matplotlib画图
导入模块
import matplotlib.pyplot as plt
%matplotlib inline
plt.pie(pie_fig['count'],labels=pie_fig['type'],explode=[0.1,0],data=pie_fig,shadow=True,autopct='%1.1f%%')
plt.title('Netflix_show TV/Moive percentage')
plt.axis('equal')
plt.show()
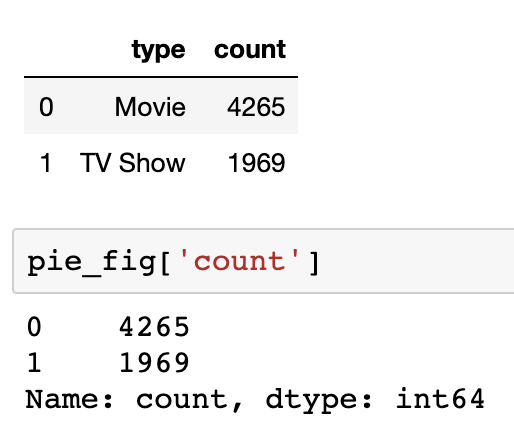
传入数据pie_fig为dataframe格式
图形结果:
 最低0.47元/天 解锁文章


 8万+
8万+

 被折叠的 条评论
为什么被折叠?
被折叠的 条评论
为什么被折叠?
 到【灌水乐园】发言


