


Title
题目
AmyloidPETNet: Classification of Amyloid Positivity in Brain PET Imaging Using End-to-End Deep Learning
AmyloidPETNet:使用端到端深度学习对脑PET成像中的淀粉样阳性进行分类
01
文献速递介绍
阿尔茨海默病 (AD) 的一个病理异常是脑内淀粉样蛋白-β (Aβ) 斑块的沉积。淀粉样蛋白PET成像是评估脑内淀粉样蛋白沉积的体内参考标准,有助于认知能力下降患者的诊断和治疗。它已被用作抗Aβ疗法早期临床试验的入组标准和次要终点。预计其用途将继续,包括评估药物治疗的适用性 以及在特别是放宽报销限制后进一步监测淀粉样蛋白沉积的程度。
视觉解读是评估PET扫描和确定淀粉样蛋白状态的标准临床方法,但由于观察者之间的差异和不明确的病例,它具有局限性 。正确解读需要熟悉特定示踪剂的协议 。除了临床环境中的视觉评定外 ,PET扫描的定量分析在阿尔茨海默病诊断中显示出良好的敏感性和特异性,并在研究环境中被常规执行。Aβ沉积的定量分析涉及计算平均皮质标准摄取值 (SUV) 比率 ,该比率已显示出与神经病理学的高度一致性。尽管平均皮质SUV比率可以通过手绘的椭圆体来估算,这些椭圆体近似感兴趣区域,但这种方法依赖于操作人员且不具备可扩展性。尽管已经证明无需MRI的定量分析可以自动划定感兴趣区域,但通常需要结构性MRI扫描 。然而,MRI处理通常计算密集、耗时且需要专门的软件。最后,不同的示踪剂、PET扫描仪和重建算法可能会影响定量精度,从而阻碍Aβ阳性标准的统一 。
Purpose
目的
To develop a deep learning model to classify minimally processed brain PET scans as amyloid positive or negative, evaluate
its performance on independent data sets and different tracers, and compare it with human visual reads.
为了开发一个深度学习模型来对最小处理过的大脑PET扫描进行分类(阿尔茨海默病阳性或阴性),需要在独立的数据集和不同的示踪剂上评估其性能,并与人类视觉读取的结果进行比较。
Method
方法
This retrospective study used 8476 PET scans (6722 patients) obtained from late 2004 to early 2023 that were analyzed across five different data sets. A deep learning model, AmyloidPETNet, was trained on 1538 scans from 766 patients, validated on 205 scans from 95 patients, and internally tested on 184 scans from 95 patients in the Alzheimer’s Disease Neuroimaging Initiative (ADNI) fluorine 18 (18F) florbetapir (FBP) data set. It was tested on ADNI scans using different tracers and scans from independent data sets. Scan amyloid positivity was based on mean cortical standardized uptake value ratio cutoffs. To compare with model performance, each scan from both the Centiloid Project and a subset of the Anti-Amyloid Treatment in Asymptomatic Alzheimer’s Disease (A4) study were visually interpreted with a confidence level (low, intermediate, high) of amyloid positivity/negativity. The area under the receiver operating characteristic curve (AUC) and other performance metrics were calculated, and Cohen κ was used to measure physician-model agreement.
本回顾性研究使用了从2004年底到2023年初获得的8476次PET扫描(6722名患者),并在五个不同的数据集中进行了分析。深度学习模型AmyloidPETNet在阿尔茨海默病神经影像学倡议(ADNI)的氟18(18F)Florbetapir(FBP)数据集上进行了训练、验证和内部测试。训练使用了来自766名患者的1538次扫描,验证使用了来自95名患者的205次扫描,内部测试使用了来自95名患者的184次扫描。该模型在使用不同示踪剂的ADNI扫描和独立数据集的扫描上进行了测试。扫描的淀粉样阳性基于皮质平均标准化摄取值比值的阈值。为了与模型性能进行比较,Centiloid项目的每次扫描和无症状阿尔茨海默病抗淀粉样治疗(A4)研究的一个子集的扫描都进行了视觉解释,并根据淀粉样阳性/阴性的置信水平(低、中、高)进行分类。计算了接收者操作特征曲线下面积(AUC)和其他性能指标,并使用Cohen κ测量医生与模型的一致性
Conclusion
结论
The developed model was capable of automatically and accurately classifying brain PET scans as amyloid positive or negative without relying on experienced readers or requiring structural MRI.
开发的模型能够自动且准确地将脑PET扫描分类为淀粉样阳性或阴性,而无需依赖有经验的读者或结构性MRI。
Results
结果
The model achieved an AUC of 0.97 (95% CI: 0.95, 0.99) on test ADNI 18F-FBP scans, which generalized well to 18F-FBP scans from the Open Access Series of Imaging Studies (AUC, 0.95; 95% CI: 0.93, 0.97) and the A4 study (AUC, 0.98; 95% CI: 0.98, 0.98). Model performance was high when applied to data sets with different tracers (AUC ≥ 0.97). Other performance metrics provided converging evidence. Physician-model agreement ranged from fair (Cohen κ = 0.39; 95% CI: 0.16, 0.60) on a sample of mostly equivocal cases from the A4 study to almost perfect (Cohen κ = 0.93; 95% CI: 0.86, 1.0) on the Centiloid Project.
该模型在测试的ADNI 18F-FBP扫描中取得了0.97的AUC(95% CI: 0.95, 0.99),并且在来自开放访问影像研究系列(OASIS)的18F-FBP扫描中也表现良好(AUC为0.95;95% CI: 0.93, 0.97),在A4研究中表现出色(AUC为0.98;95% CI: 0.98, 0.98)。当应用于不同示踪剂的数据集时,模型性能仍然很高(AUC ≥ 0.97)。其他性能指标也提供了一致的证据。医生与模型的一致性从A4研究中大部分为不确定病例的样本中的一般一致性(Cohen κ = 0.39;95% CI: 0.16, 0.60)到Centiloid项目中的几乎完美一致性(Cohen κ = 0.93;95% CI: 0.86, 1.0)。
Figure
图
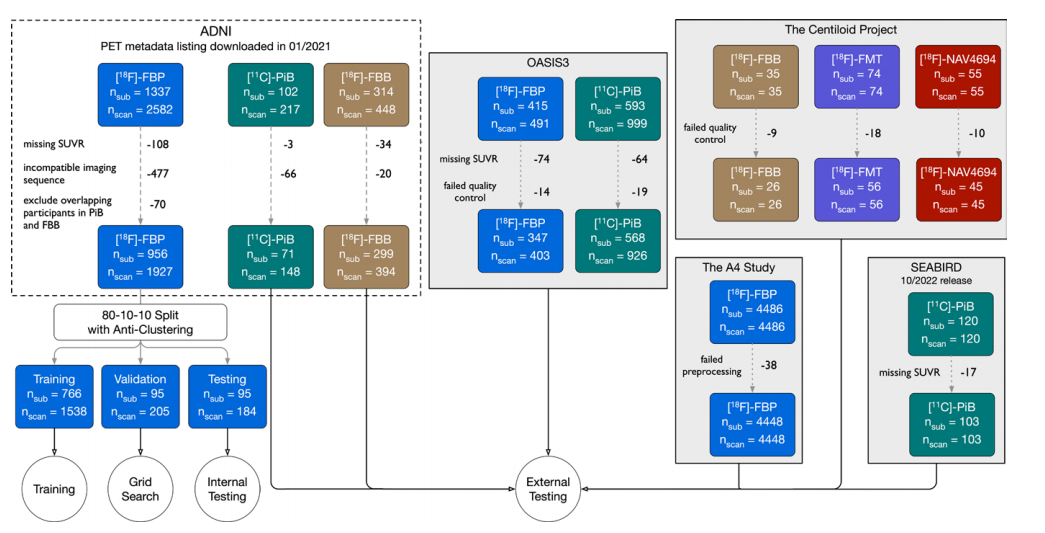
Figure 1: Experimental setup. Fluorine 18 (18F) florbetaben (FBB) scans from Alzheimer’s Disease Neuroimaging Initiative (ADNI) were used for training, validation, and internal testing. The validation set was used to determine the optimal stopping point during training. The same participant was never present in training, validation, or internal testing at the same time. Multiple scans from the same participants were included to maximize the data set size for training and evaluation. Internal testing evaluated the model on scans acquired using the same tracer in the same data set as the training set. External testing was defined as testing with images acquired from a different data set and/or with a different tracer. Carbon 11 (11C) Pittsburgh compound B (PiB) and 18F florbetapir (FBP) scans from ADNI with scans from the other data sets were used for external testing. Although the Anti-Amyloid Treatment in Asymptomatic Alzheimer’s Disease (A4) study had a larger number of participants than ADNI, the A4 data set was used for testing instead of training because it primarily consisted of cognitively unimpaired participants whereas the ADNI data set spanned multiple disease stages and was more balanced in the distribution of amyloid positivity. An imaging sequence was deemed incompatible if it generated no 5-minute frames. FMT = flutemetamol, NAV4694 = flutafuranol, nscan = number of scans, nsub = number of participants, OASIS3 = Open Access Series of Imaging Studies 3, SEABIRD = Study to Evaluate Amyloid in Blood and Imaging Related to Dementia, SUVR = standardized uptake value ratio..
图1:实验设置。阿尔茨海默病神经影像学倡议(ADNI)的氟18(18F)氟贝他本(FBB)扫描用于训练、验证和内部测试。验证集用于确定训练过程中的最佳停止点。同一参与者从未同时出现在训练、验证或内部测试中。包含同一参与者的多次扫描,以最大化训练和评估的数据集规模。内部测试在使用与训练集相同的数据集和示踪剂的扫描上评估模型。外部测试定义为使用来自不同数据集和/或不同示踪剂的图像进行测试。来自ADNI的碳11(11C)匹兹堡化合物B(PiB)和18F氟贝他皮(FBP)扫描以及其他数据集的扫描用于外部测试。尽管无症状阿尔茨海默病抗淀粉样治疗(A4)研究的参与者数量多于ADNI,A4数据集用于测试而非训练,因为它主要由认知正常的参与者组成,而ADNI数据集涵盖了多个疾病阶段,并且在淀粉样阳性分布上更平衡。如果成像序列未生成5分钟帧,则视为不兼容。FMT = 氟特美他醇,NAV4694 = 氟他氟醇,nscan = 扫描次数,nsub = 参与者数量,OASIS3 = 开放访问影像研究系列3,SEABIRD = 与痴呆相关的血液和影像淀粉样评价研究,SUVR = 标准化摄取值比。
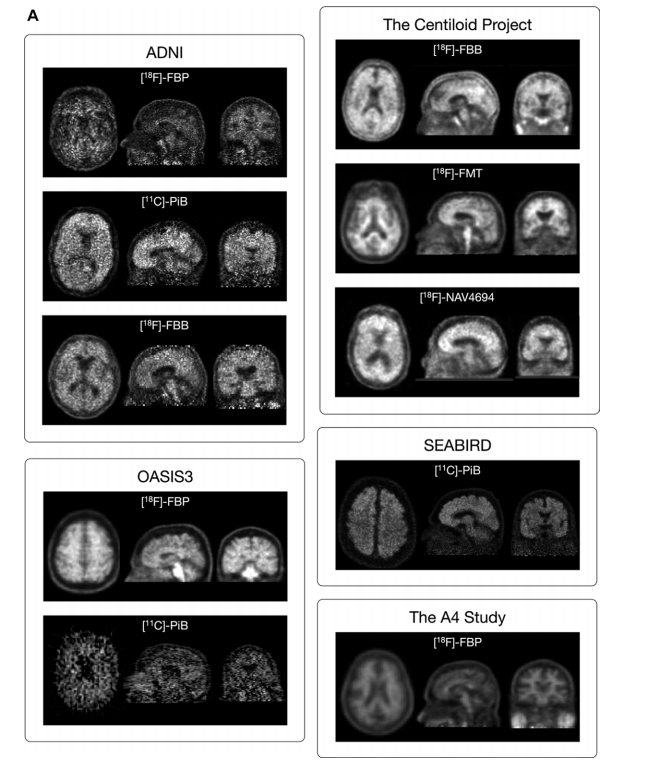
Figure 2: (A) Images show PET scans with each tracer from each data set. (left: axial; middle: sagittal; right: coronal). A randomly selected, minimally processed 5-minute frame from a randomly selected amyloid-β (Aβ)–positive PET scan from each data set is shown. For the Centiloid Project and the Study to Evaluate Amyloid in Blood and Imaging Related to Dementia (SEABIRD), co-registered and averaged frames are shown because these data were available. Variations in scan quality and slight differences in the field of view are seen between different tracers and data sets (Fig 2 continues).
图2:(A) 图像显示了每个数据集中的每种示踪剂的PET扫描图像。(左:轴向;中:矢状面;右:冠状面)。显示了从每个数据集中随机选择的一个淀粉样β(Aβ)阳性PET扫描的随机选择的、最小处理的5分钟帧。对于Centiloid项目和与痴呆相关的血液和影像淀粉样评价研究(SEABIRD),显示了共注册并平均的帧,因为这些数据可用。可以看到不同示踪剂和数据集之间扫描质量的变化和视野的细微差异。(图2继续)。

Figure 2 (continued): (B) Images show co-registered, averaged PET with Aβ-positive (Aβ+) and Aβ-negative (Aβ-) scans of each data set. Co-registered and averaged scans were first created for each participant, then linearly registered all scans to the same template, and created averaged scans for all the Aβ-positive and Aβ-negative participants in each data set. Aβ-positive scans have higher cortical uptake and loss of gray-white matter differentiation. (C) Loss of gray-white matter differentiation in Aβ-positive scans. A zoomed-in, axial view of the averaged Alzheimer’s Disease Neuroimaging Initiative (ADNI) fluorine 18 (18F) florbetapir (FBP) scans was used to demonstrate loss of gray-white matter differentiation in amyloidosis. The cortical gray-white matter boundary (red outline) and the irregular gap between the cerebral hemispheres (blue) can be clearly appreciated on the Aβ-negative scan, resulting in the winter-tree configuration. On the Aβ-positive scan, the uptake of amyloid tracers into the cortical gray matter increases the imaged intensity of the cortices, making the boundary between the gray and white matter difficult to see. A4 = Anti-Amyloid Treatment in Asymptomatic Alzheimer’s Disease, 11C = carbon 11, FBB = florbetaben, FMT = flutemetamol, NAV4694 = flutafuranol, OASIS3 = Open Access Series of Imaging Studies 3, PiB = Pittsburgh compound B.
图2 (续):(B) 图像显示了每个数据集的淀粉样β阳性(Aβ+)和淀粉样β阴性(Aβ-)扫描的共注册、平均的PET图像。首先为每个参与者创建共注册和平均的扫描,然后线性注册所有扫描到相同的模板,并为每个数据集中的所有Aβ阳性和Aβ阴性参与者创建平均扫描。Aβ阳性扫描具有更高的皮质摄取和灰白质分界的丧失。(C) Aβ阳性扫描中的灰白质分界丧失。放大后的轴向视图显示了阿尔茨海默病神经影像学倡议(ADNI)氟18(18F)氟贝他皮(FBP)扫描,展示了淀粉样变性中的灰白质分界丧失。Aβ阴性扫描中可以清楚地看到皮质灰白质边界(红色轮廓)和大脑半球之间的不规则间隙(蓝色),形成冬树配置。在Aβ阳性扫描中,淀粉样示踪剂在皮质灰质中的摄取增加了皮质的成像强度,使灰白质之间的边界难以看到。A4 = 无症状阿尔茨海默病的抗淀粉样治疗,11C = 碳11,FBB = 氟贝他本,FMT = 氟特美他醇,NAV4694 = 氟他氟醇,OASIS3 = 开放访问影像研究系列3,PiB = 匹兹堡化合物B。

Figure 3: Model architecture. All convolutional blocks have a kernel size of 3 × 3 × 3 unless otherwise noted. The value in parentheses in the dense layer indicates the length of the feature vector that was generated. Elsewhere, values in parentheses indicate the numbers of feature maps. For dropout layers applied within the context module, p denotes the probability of a feature map to be zeroed. For the dropout layer outside of context modules, pdenotes the probability of an element in the feature vector to be zeroed. Stride indicates the number of voxels the kernel moves across in each direction. GAP = global average pooling layer, ReLU = rectified linear unit.
图3:模型架构。所有卷积块的核大小均为3 × 3 × 3,除非另有说明。在密集层中,括号中的数值表示生成的特征向量的长度。在其他地方,括号中的数值表示特征图的数量。对于上下文模块中的dropout层,p表示特征图被归零的概率。对于上下文模块外的dropout层,p表示特征向量中元素被归零的概率。Stride表示核在每个方向上移动的体素数。GAP = 全局平均池化层,ReLU = 修正线性单元。

Figure 4: Receiver operating characteristic curves. The model was trained, validated, and internally tested on fluorine 18 (18F) florbetapir (FBP) scans from Alzheimer’s Disease Neuroimaging Initiative (ADNI) data set before being tested on carbon 11 (11C) Pittsburgh compound B (PiB) and 18F florbetaben (FBB) scans from ADNI, Open Access Series of Imaging Studies 3 (OASIS3), the Centiloid Project, Study to Evaluate Amyloid in Blood and Imaging Related to Dementia (SEABIRD), and the Anti-Amyloid Treatment in Asymptomatic Alzheimer’s Disease (A4) study. The model demonstrated high classification performance on the ADNI testing set and generalized well to data sets from an external data set and/or acquired with a different tracer. AUC = area under the receiver operating characteristic curve, FMT = flutemetamol, NAV4694 = flutafuranol.
图4:接收者操作特征曲线。模型在阿尔茨海默病神经影像学倡议(ADNI)数据集中的氟18(18F)氟贝他皮(FBP)扫描上进行了训练、验证和内部测试,然后在来自ADNI的碳11(11C)匹兹堡化合物B(PiB)和18F氟贝他本(FBB)扫描、开放访问影像研究系列3(OASIS3)、Centiloid项目、与痴呆相关的血液和影像淀粉样评价研究(SEABIRD)以及无症状阿尔茨海默病的抗淀粉样治疗(A4)研究上进行了测试。模型在ADNI测试集上表现出高分类性能,并在来自外部数据集和/或使用不同示踪剂的数据集上表现良好。AUC = 接收者操作特征曲线下面积,FMT = 氟特美他醇,NAV4694 = 氟他氟醇。
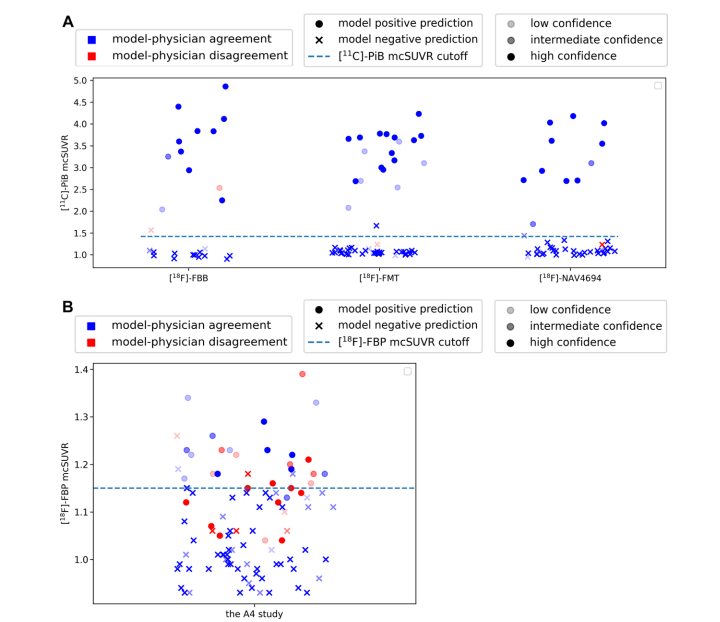
Figure 5: Graphs show comparison of model predictions versus human reads in evaluating amyloid-β (Aβ) positivity as determined by mean cortical standardized uptake value (SUV) ratio (mcSUVR) cutoffs. Circles and crosses show positive and negative classifications from the model, respectively. The opacity of each marker represents the degree of confidence of the radiologist when adjudicating each image. Blue and red colors show model-physician agreement and disagreement, respectively. The dashed line shows the mean cortical SUV ratio cutoff for Aβ positivity. (A) Graphs show the Centiloid Project agreement, prediction, and confidence. The mean cortical SUV ratio values correspond to those of the companion carbon 11 (11C) Pittsburgh compound B (PiB) scans, which were acquired within 3 months of the associated fluorine-based scans. AmyloidPETNet made classifications that were consistent with an expert radiologist for all but four cases. For three of the four scans, the model classified the scans consistently with the mean cortical SUV ratio cutoff. The radiologist rated their confidence level as less than or equal to intermediate in three of the four cases of disagreement cases. (B) Graphs show the Anti-Amyloid Treatment in Asymptomatic Alzheimer’s Disease (A4) study agreement, negative prediction, and confidence. The entire A4 cohort was binned into 10 equal quantiles based on the Centiloid values. Ten participants were sampled from every quantile except the first and last quantiles to avoid including overly unequivocal cases. An additional 20 cases were sampled from the quantile that contain the SUV ratio positivity cutoff. In this sample of more equivocal cases, there were more physician-model disagreements. Most of the disagreements were for cases in the indeterminant zone around the Aβ-positive cutoff. FBB = florbetaben, FBP = florbetapir, FMT = flutemetamol, NAV4694 = flutafuranol.
图5:图表显示模型预测与人工读取在评估由平均皮质标准化摄取值比(mcSUVR)阈值确定的淀粉样β(Aβ)阳性方面的比较。圆圈和叉号分别表示模型的阳性和阴性分类。每个标记的透明度表示放射科医生在裁定每张图像时的信心程度。蓝色和红色分别表示模型与医生的一致性和不一致性。虚线表示Aβ阳性的平均皮质SUV比值阈值。(A) 图表显示了Centiloid项目中的一致性、预测和信心。平均皮质SUV比值对应于伴随的碳11(11C)匹兹堡化合物B(PiB)扫描的值,这些扫描在相关氟基扫描后的3个月内获得。除了四个案例外,AmyloidPETNet在所有情况下的分类都与专家放射科医生一致。在这四个扫描中的三个中,模型的分类与平均皮质SUV比值阈值一致。放射科医生在这四个不一致案例中的三个中将其信心水平评为中等或以下。(B) 图表显示了无症状阿尔茨海默病抗淀粉样治疗(A4)研究中的一致性、阴性预测和信心。整个A4队列根据Centiloid值被分成10个相等的分位数,从每个分位数中抽取了10名参与者,除了第一个和最后一个分位数,以避免包含过于明确的案例。从包含SUV比值阳性阈值的分位数中额外抽取了20个案例。在这一更为不确定的案例样本中,医生与模型之间存在更多的不一致性。大多数不一致发生在Aβ阳性阈值周围的不确定区域。FBB = 氟贝他本,FBP = 氟贝他皮,FMT = 氟特美他醇,NAV4694 = 氟他氟醇。
Table
表
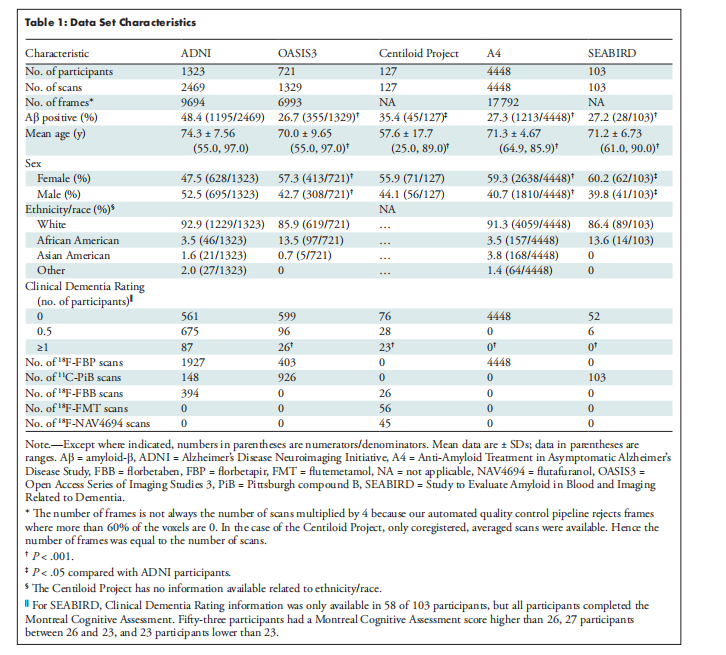
Table 1: Data Set Characteristics
表1:数据集特征
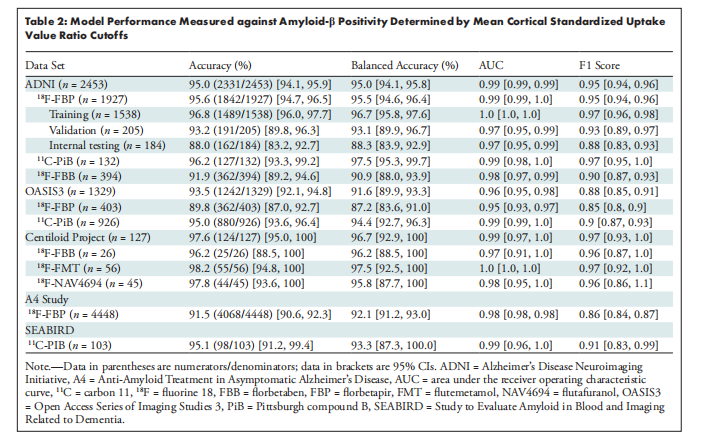
Table 2: Model Performance Measured against Amyloid-β Positivity Determined by Mean Cortical Standardized Uptake Value Ratio Cutoffs
表2:模型性能相对于由平均皮质标准化摄取值比值阈值确定的淀粉样-β阳性
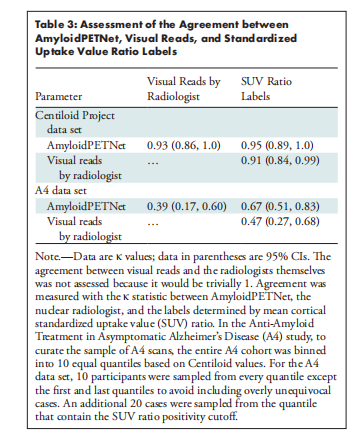
Table 3: Assessment of the Agreement between AmyloidPETNet, Visual Reads, and Standardized Uptake Value Ratio Labels
表3:AmyloidPETNet、视觉阅读和标准化摄取值比标签之间的一致性评估


 被折叠的 条评论
为什么被折叠?
被折叠的 条评论
为什么被折叠?
 到【灌水乐园】发言


