


Title
题目
Extranodal Extension at Pretreatment MRI and the Prognostic Value for Patients with Rectal Cancer
《治疗前磁共振成像显示的结直肠癌患者的结外扩展及其预后价值》
Background
背景
Detection of extranodal extension (ENE) at pathology is a poor prognostic indicator for rectal cancer, but whether ENE can be identified at pretreatment MRI is, to the knowledge of the authors, unknown.
病理学检测到的结外扩展(ENE)是直肠癌的不良预后指标,但据作者所知,是否可以在治疗前的磁共振成像中识别出ENE尚不明确。
Method
方法
This single-center study included a prospective development data set consisting of participants with rectal adenocarcinoma who underwent pretreatment MRI and radical surgery (December 2021 to January 2023). MRI characteristics were identified by their association with ENE-positive nodes (χ2 test and multivariable logistic regression) and the performance of these MRI features was assessed (area under the receiver operating characteristic curve [AUC]). Interobserver agreement was assessed by Cohen κcoefficient. The prognostic value of ENE detected with MRI for predicting 3-year disease-free survival was assessed by Cox regression analysis in a retrospective independent validation cohort of patients with locally advanced rectal cancer (December 2019 to July 2020).
这项单中心研究包括一个前瞻性开发数据集,数据集由接受治疗前磁共振成像(MRI)和根治性手术的直肠腺癌患者组成(2021年12月至2023年1月)。通过χ²检验和多变量逻辑回归分析,识别了与ENE阳性淋巴结相关的MRI特征,并评估了这些MRI特征的表现(通过受试者工作特征曲线下面积 [AUC] 进行评估)。通过Cohen κ系数评估观察者间一致性。在一个回顾性独立验证队列中,使用Cox回归分析评估了MRI检测到的ENE对预测3年无病生存期的预后价值,该验证队列包括局部晚期直肠癌患者(2019年12月至2020年7月)。
Conclusion
结论
ENE can be detected at pretreatment MRI, and its presence was associated with worse prognosis for patients with rectal cancer.
ENE可以在治疗前的MRI(磁共振成像)中检测到,其存在与直肠癌患者预后较差相关。
Results
结果
The development data set included 147 participants (mean age, 62 years ± 11 [SD]; 87 male participants). The retrospective cohort included 110 patients (mean age, 60 years ± 9; 79 male participants). Presence of vessel interruption and fusion (both P < .001), heterogeneous internal structure, and the broken-ring and tail signs (odds ratio range, 4.10–23.20; P value range, <.001 to .002) were predictors of ENE at MRI, and together achieved an AUC of 0.91 (95% CI: 0.88, 0.93) in detecting ENE. Interobserver agreement was moderate for the presence of vessel interruption and fusion (κ = 0.46 for both) and substantial for others (κ = 0.61–0.67). The presence of ENE at pretreatment MRI was independently associated with worse 3-year disease-free survival (hazard ratio, 3.00; P = .02).
该研究开发数据集包括147名参与者(平均年龄62岁,标准差±11;87名男性参与者)。回顾性队列包括110名患者(平均年龄60岁,标准差±9;79名男性患者)。血管中断和融合的存在(均为P < .001)、内部结构异质性以及破环和尾巴征(优势比范围为4.10-23.20;P值范围为<.001至.002)是MRI(磁共振成像)中ENE(外神经浸润)的预测因素,且这些因素共同实现了检测ENE的AUC(曲线下面积)为0.91(95% CI:0.88,0.93)。对于血管中断和融合的存在,观察者之间的一致性为中等(κ = 0.46),而对于其他特征则为显著一致(κ = 0.61-0.67)。治疗前MRI中ENE的存在与较差的3年无病生存率独立相关(风险比为3.00;P = .02)。
Figure
图
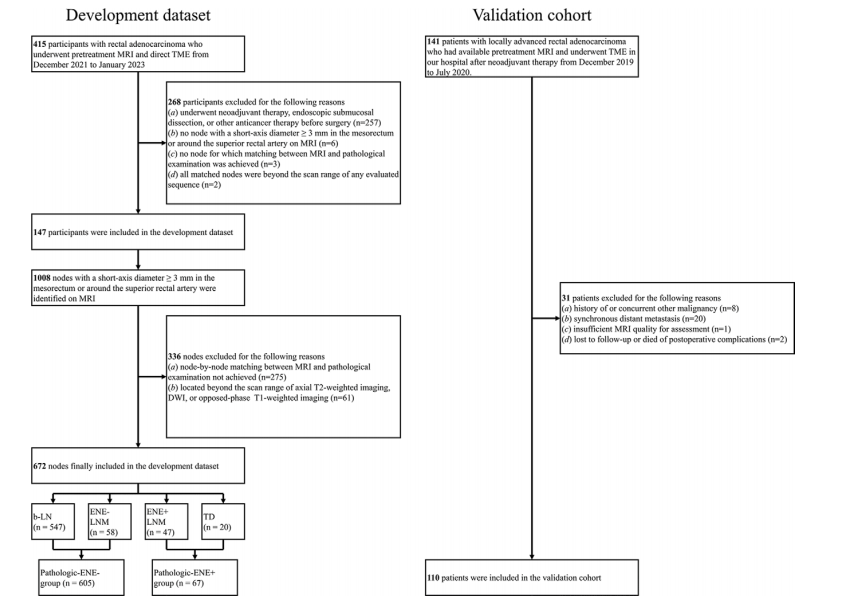
Figure 1: Flowchart shows the inclusion and exclusion criteria for the development data set and validation cohort. b-LN = benign lymph node, DWI = diffusion-weighted imaging, ENE = extranodal extension, ENE− = without ENE, ENE+ = with ENE, LNM = metastatic lymph node, TD = tumor deposit, TME = total mesorectal excision.
图1:流程图显示了开发数据集和验证队列的纳入和排除标准。b-LN = 良性淋巴结,DWI = 弥散加权成像,ENE = 淋巴结外侵,ENE− = 无ENE,ENE+ = 有ENE,LNM = 转移性淋巴结,TD = 肿瘤沉积,TME = 全直肠系膜切除术。
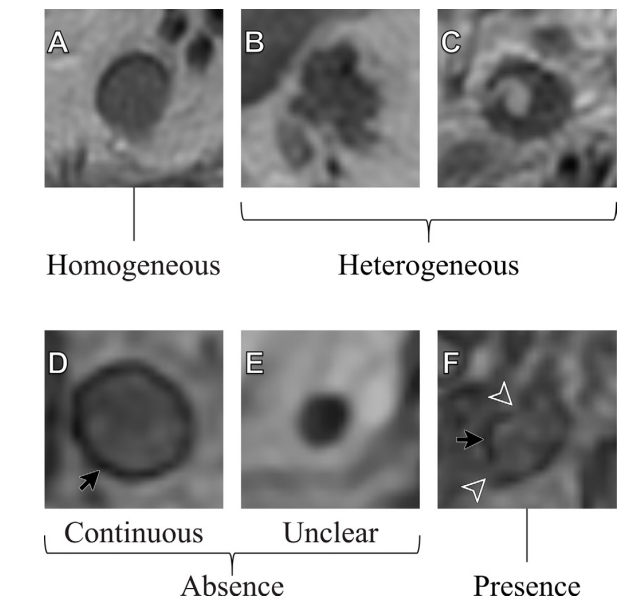
Figure 2: Representative images show (A–C) patterns of the internal structure and (D–F) the broken-ring sign. On axial T2-weighted images, the nodal internal structure is shown as (A) homogeneous and (B, C) heterogeneous. Opposed-phase axial T1-weighted images show the broken-ring sign as (D) continuous, where the sharp black circle enveloping the node is complete and continuous; (E) unclear, where the circle cannot be clearly depicted; and (F) present, where the sharp black circle enveloping the node is interrupted or incomplete. Both (D) and (E) are classified as an absence of the broken-ring sign, with the sharp black circle enveloping the node (black arrow) and the interruption of the circle (arrowheads).
图2:代表性图像显示了(A–C)内部结构的模式以及(D–F)破环征。在轴位T2加权图像中,淋巴结的内部结构显示为(A)均匀和(B, C)不均匀。在反相位轴位T1加权图像中,破环征显示为(D)连续,即包裹淋巴结的锐利黑色圆圈是完整和连续的;(E)不清晰,即圆圈无法清楚描绘;(F)存在,即包裹淋巴结的锐利黑色圆圈被中断或不完整。(D)和(E)均被归类为无破环征,圆圈包裹淋巴结(黑色箭头)且圆圈中断(箭头指示)。
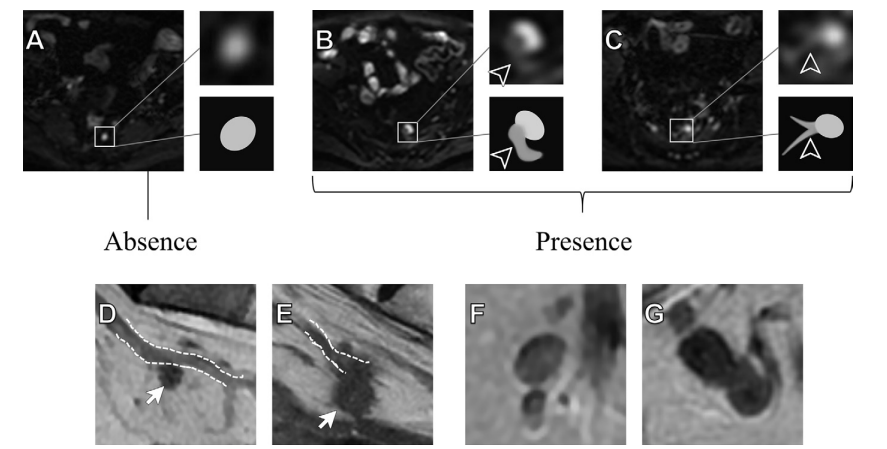
Figure 3: Representative images show (A–C) the tail sign, (D, E) interruption of vessels, and (F, G) fusion. (A–C) Diffusion-weighted images (b = 0 sec/mm2 ) and the corresponding diagram show (A) an isolated, sharply defined high signal node with no other high signal around it, which is regarded as an absence of the tail sign; and (B, C) a band-like or linear high signal intensity directly attached to the node (arrowheads) and the nodal margin is poorly defined at the intersection. Both B and C show the presence of the tail sign. (D, E) Sagittal T2-weighted images show the interruption of vessels (dashed lines) as (D) absent, where the node (arrow) goes alongside vessels but can be separate from vessels, and (E) present, where the node (arrow) directly interrupts the course of vessels but cannot be separated from the vessel and partially or fully overlaps with the course of vessels. The (F) absence and (G) presence of fusion are shown with (F) a clear boundary or (G) no visible boundary between adjacent nodes.
图3:代表性图像显示了(A–C)尾征,(D, E)血管中断,以及(F, G)融合现象。(A–C)弥散加权图像(b = 0 sec/mm²)及相应示意图显示了(A)一个独立的、边界清晰的高信号淋巴结,其周围没有其他高信号,被视为无尾征;以及(B, C)直接附着在淋巴结上的带状或线状高信号(箭头所指),在交界处淋巴结边界不清晰。B和C均显示尾征的存在。(D, E)矢状位T2加权图像显示血管中断(虚线)为(D)不存在,即淋巴结(箭头所指)沿着血管走行,但可以与血管分离;以及(E)存在,即淋巴结(箭头所指)直接中断血管的走行,无法与血管分离,并且部分或完全与血管的走行重叠。(F)显示无融合现象,边界清晰;而(G)显示融合现象,邻近淋巴结之间没有可见的边界。
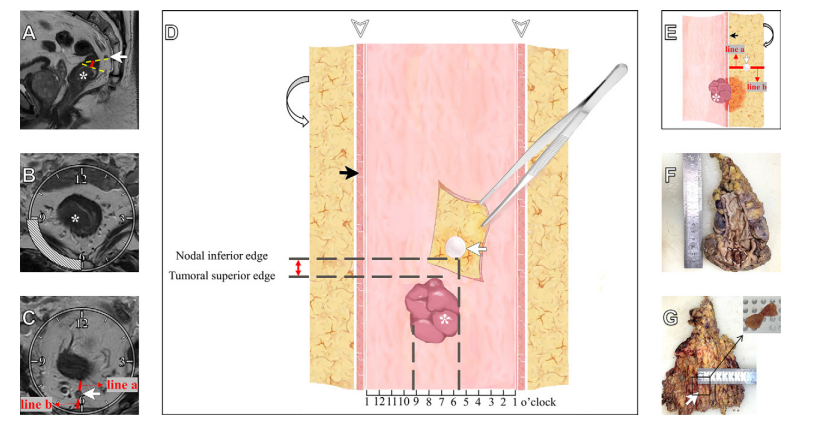
Figure 4: Node-by-node matching between radiologic and pathologic evaluation in a 79-year-old male participant with rectal cancer.
(A) Sagittal T2-weighted image shows the candidate node (arrow) located above the tumor , and the node-to-tumor shortest distance (red line) is measured by the distance of the tangents of the nodal inferior edge (top dashed line) and the tumoral superior edge (bottom dashed line) along the rectal lumen, which is 0.5 cm. (B) Oblique axial and (C) axial T2-weighted images show the rectal wall and mesorectum divided clockwise from the center of the rectal lumen with the tumor ( in B) invading the rectal wall from 6 to 9 o’clock and the candidate node (arrow in C) located at 6 o’clock. Additionally, the nodal depth in the mesorectum (C) is determined by the vertical distance from the node to the rectal wall (line a in C) and to the mesorectal fascia (line b in C), both of which are 0.4 cm. This candidate node is located 0.5 cm above the tumor, at 6 o’clock, 0.4 cm to the rectal wall, and 0.4 cm to the mesorectal fascia.
(D) Front view of the three-dimensional node map, on which the red double arrow between the nodal inferior edge and the tumoral superior edge indicates the candidate node (white arrow), which is located 0.5 cm above the tumor. The removed specimen is cut open at 1 o’clock in the axial clock position (arrowheads), and thus the whole specimen could be oriented from left to right corresponding to the clock point on an axial MRI scan. The longitudinal dashed lines show tumor invasion from 6 to 9 o’clock and that the candidate node is located at 6 o’clock (black arrow, rectal wall; curved arrow, mesorectal fascia).
(E) Side view of the three-dimensional node map, with lines a and b demonstrating the depth of the candidate node (white arrow) in the mesorectum that is 0.4 cm to the rectal wall (black arrow) and 0.4 cm to the mesorectal fascia (curved arrow). Using the three-dimensional node map as the bridge, the radiologist and pathologist collaborated to match the candidate node in the specimen. The (F) straightened excised rectum and the (G) sliced mesorectum show this candidate node (arrow in G) located above the proximal edge and at the left edge of the tumor (dashed line in F) and at the midpoint of the mesorectum, which could be matched with the node map and MRI. Then, the matched node was recorded and then underwent further processing
图4:在一名79岁直肠癌男性患者中,放射学与病理学评估之间逐个淋巴结匹配。
(A) 矢状位T2加权图像显示了位于肿瘤上方的候选淋巴结(箭头所指),并测量了淋巴结至肿瘤的最短距离(红线),该距离通过沿直肠腔的淋巴结下缘切线(上虚线)和肿瘤上缘切线(下虚线)的距离测量,为0.5厘米。(B) 斜轴位和(C)轴位T2加权图像显示了直肠壁和直肠系膜从直肠腔中心按顺时针方向划分,肿瘤(B中的)从6点到9点侵入直肠壁,候选淋巴结(C中的箭头)位于6点。此外,(C)中的直肠系膜中淋巴结深度由淋巴结至直肠壁的垂直距离(C中的a线)和至直肠系膜筋膜的垂直距离(C中的b线)确定,两者均为0.4厘米。该候选淋巴结位于肿瘤上方0.5厘米处,6点方向,距离直肠壁0.4厘米,距离直肠系膜筋膜0.4厘米。
(D) 三维淋巴结图的正面视图,红色双箭头表示淋巴结下缘与肿瘤上缘之间的距离,指示候选淋巴结(白色箭头),其位于肿瘤上方0.5厘米处。切除的标本在轴位时钟位置的1点处切开(箭头指示),因此整个标本可以从左向右定向,与轴位MRI扫描上的时钟位置相对应。纵向虚线显示了肿瘤从6点到9点的侵袭情况,候选淋巴结位于6点方向(黑色箭头,直肠壁;弯箭头,直肠系膜筋膜)。
(E) 三维淋巴结图的侧视图,a线和b线表示候选淋巴结(白色箭头)在直肠系膜中的深度,距直肠壁0.4厘米(黑色箭头),距直肠系膜筋膜0.4厘米(弯箭头)。放射科医生和病理学家通过三维淋巴结图作为桥梁,共同将标本中的候选淋巴结进行匹配。(F) 展平的切除直肠和(G) 切片直肠系膜显示该候选淋巴结(G中的箭头)位于肿瘤近端边缘的上方和左边缘(F中的虚线)以及直肠系膜的中点,这与淋巴结图和MRI相匹配。随后,匹配的淋巴结被记录下来并进行进一步处理。
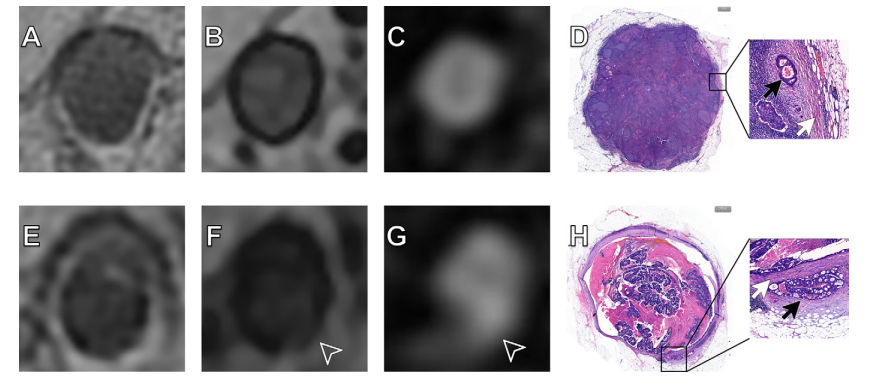
Figure 5: MRI scans (A–C, E–G) and photomicrographs (D, H) show two representative nodes. (A–D) Images in a metastatic lymph node without extranodal extension (ENE) in an 85-year-old female participant with rectal cancer. (A) Axial T2-weighted image shows homogeneous structure within the node. (B) Axial opposed-phase T1-weighted image shows a complete and continuous sharp black circle surrounding the node, which is the absence of a broken-ring sign. (C) Axial diffusion-weighted image (b = 0 sec/mm2 ) shows the node as isolated and sharply defined with high signal and no other high signal around, indicating the absence of a tail sign. (D) Hematoxylin-eosin staining shows the node is a metastatic lymph node without ENE. The enlarged image (magnification, ×20) shows the capsule (white arrow) and the tumor (black arrow). (E–H) Images in a metastatic lymph node with ENE in a 57-year-old male participant with rectal cancer. (E) Axial T2-weighted image shows a heterogeneous structure within the node. (F) Axial opposed-phase T1-weighted image shows the sharp black circle surrounding the node is interrupted (arrowhead), indicating the presence of a broken-ring sign. (G) Axial diffusion-weighted image (b = 0 sec/mm2 ) shows that a band-like high signal appeared around the node and was directly attached to the node (arrowhead), indicating the presence of a tail sign. (H) Hematoxylin-eosin staining shows the node is a metastatic lymph node with ENE. The enlarged image (magnification, ×20) shows the capsule (white arrow) and tumor (black arrow).
图5:MRI扫描图像(A–C, E–G)和显微照片(D, H)展示了两个代表性淋巴结。(A–D)显示了一名85岁直肠癌女性患者的无淋巴结外侵(ENE)的转移性淋巴结图像。(A)轴位T2加权图像显示淋巴结内的均质结构。(B)轴位反相位T1加权图像显示包围淋巴结的完整且连续的锐利黑色圆圈,表示无破环征。(C)轴位弥散加权图像(b = 0 sec/mm²)显示该淋巴结孤立且边界清晰,具有高信号且周围没有其他高信号,表明无尾征。(D)苏木精-伊红染色显示该淋巴结为无ENE的转移性淋巴结。放大图像(放大倍数,×20)显示囊膜(白箭头)和肿瘤(黑箭头)。(E–H)显示了一名57岁直肠癌男性患者的有ENE的转移性淋巴结图像。(E)轴位T2加权图像显示淋巴结内的异质结构。(F)轴位反相位T1加权图像显示包围淋巴结的锐利黑色圆圈中断(箭头所指),表示破环征的存在。(G)轴位弥散加权图像(b = 0 sec/mm²)显示淋巴结周围出现带状高信号并直接附着于淋巴结(箭头所指),表明尾征的存在。(H)苏木精-伊红染色显示该淋巴结为有ENE的转移性淋巴结。放大图像(放大倍数,×20)显示囊膜(白箭头)和肿瘤(黑箭头)。
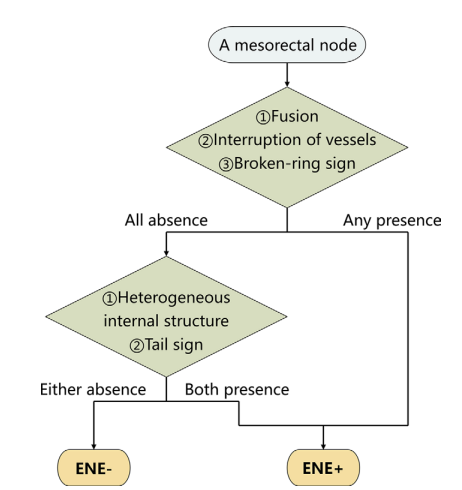
Figure 6: Diagnostic flowchart for detecting extranodal extension (ENE) at pretreatment MRI. Any node in the mesorectum or around the superior rectal artery with the interruption of vessels, fusion, or broken-ring sign at MRI was classified as an MRI-depicted ENE-positive (ENE+) node without further analysis. Nodes that did not meet these criteria were assessed for internal structural heterogeneity and the presence of the tail sign at MRI, and were classified as MRI-detected ENE-positive nodes when both characteristics were present; otherwise, they were classified as MRI-detected ENE-negative (ENE−) nodes.
图6:诊断流程图显示了在治疗前的MRI中检测淋巴结外侵(ENE)的过程。对于在直肠系膜或上直肠动脉周围的任何淋巴结,如果在MRI中显示血管中断、融合或破环征,则该淋巴结被直接分类为MRI显示的ENE阳性(ENE+)淋巴结,无需进一步分析。对于不符合这些标准的淋巴结,则进一步评估其内部结构的异质性以及在MRI中是否存在尾征。如果同时存在这两个特征,则将其分类为MRI检测的ENE阳性淋巴结;否则,将其分类为MRI检测的ENE阴性(ENE−)淋巴结。
Table
表
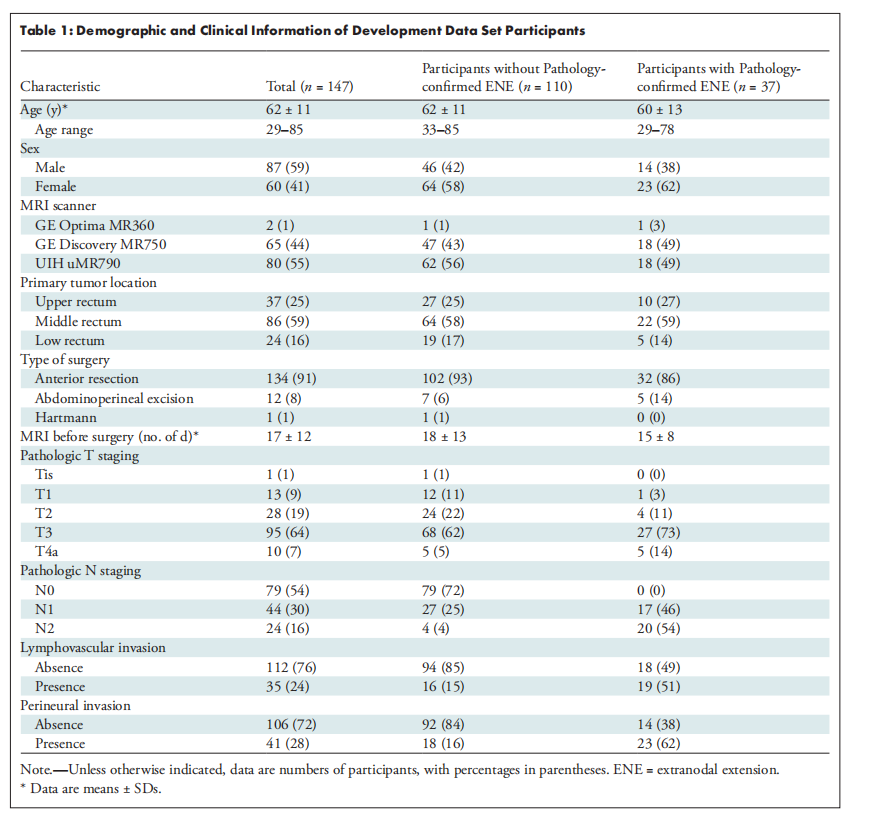
Table 1: Demographic and Clinical Information of Development Data Set Participants
表1:开发数据集参与者的人口统计和临床信息
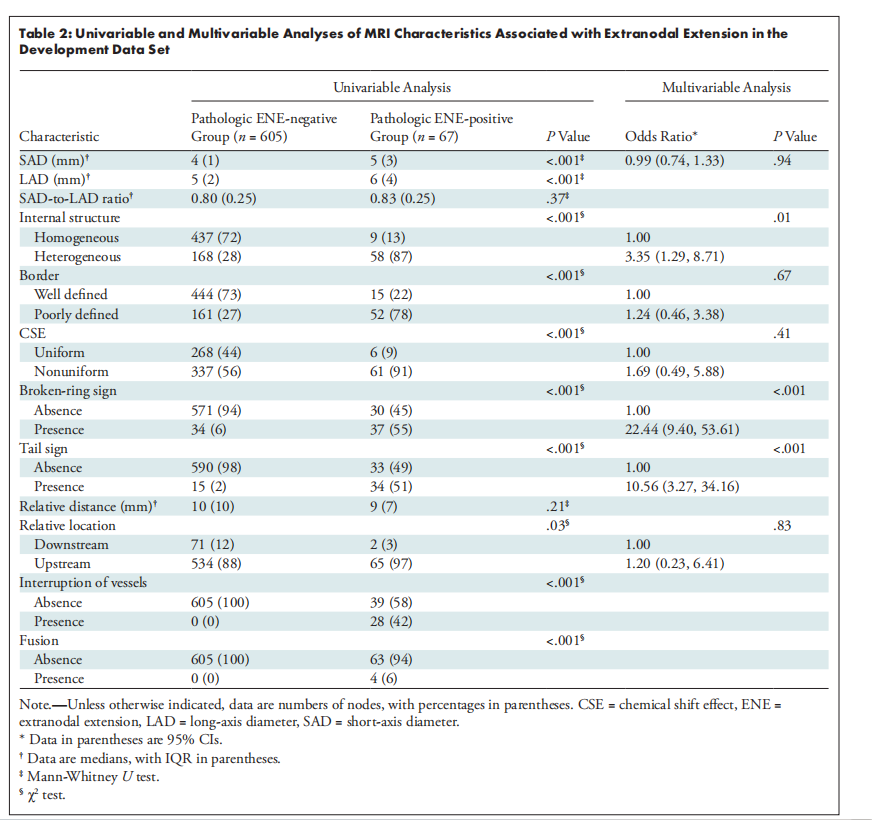
Table 2: Univariable and Multivariable Analyses of MRI Characteristics Associated with Extranodal Extension in the Development Data Set
表2:开发数据集中与淋巴结外侵相关的MRI特征的单变量和多变量分析
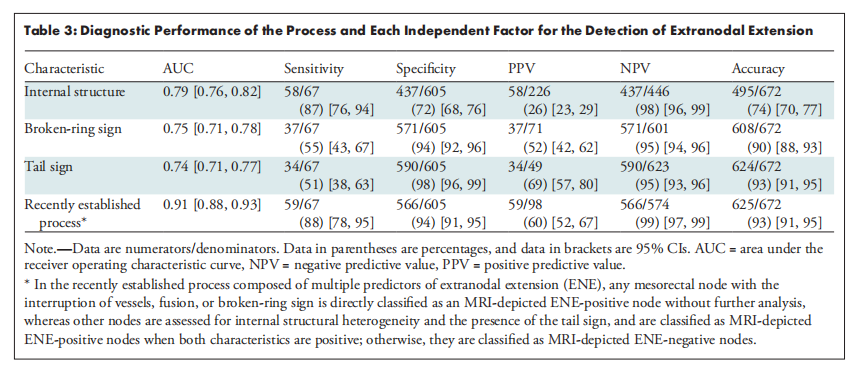
Table 3: Diagnostic Performance of the Process and Each Independent Factor for the Detection of Extranodal Extension
表3:用于检测淋巴结外侵的过程及每个独立因素的诊断性能
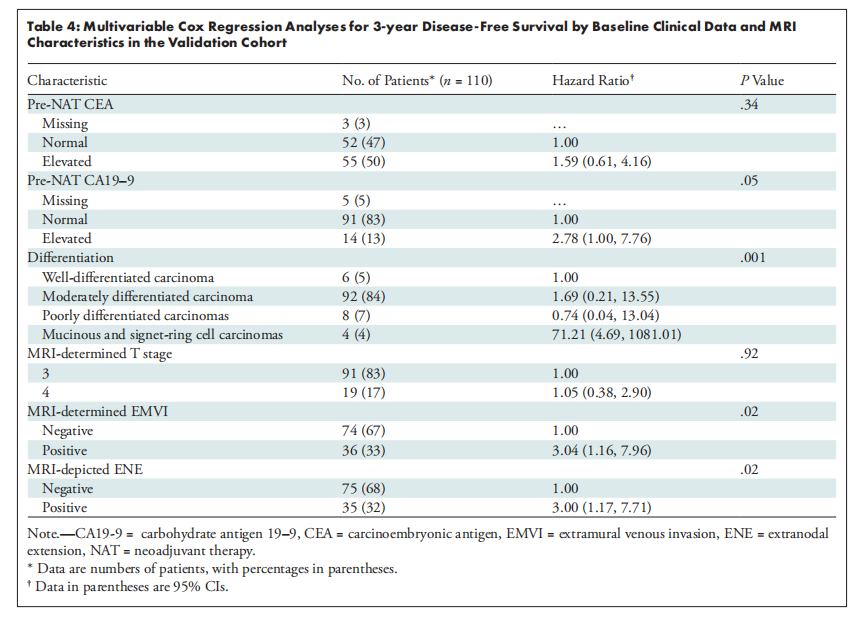
Table 4: Multivariable Cox Regression Analyses for 3-year Disease-Free Survival by Baseline Clinical Data and MRI Characteristics in the Validation Cohort
表4:验证队列中基线临床数据和MRI特征对3年无病生存率的多变量Cox回归分析


 1198
1198

 被折叠的 条评论
为什么被折叠?
被折叠的 条评论
为什么被折叠?
 到【灌水乐园】发言


