


opentracing-01 dapper论文阅读摘要
1. Three concrete design
-
Low overhead
-
Application-level transparency
-
Scalability
-
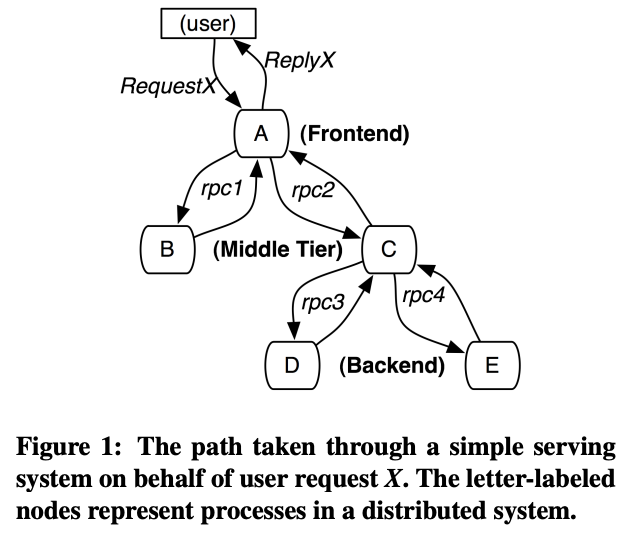
Distributed Tracing in Dapper
-
tracing RPC framwork
-
SMTP sessions in Gmail
-
HTTP request
2.0 Distributed Tracing in Dapper
2.1 Trace trees and Spans
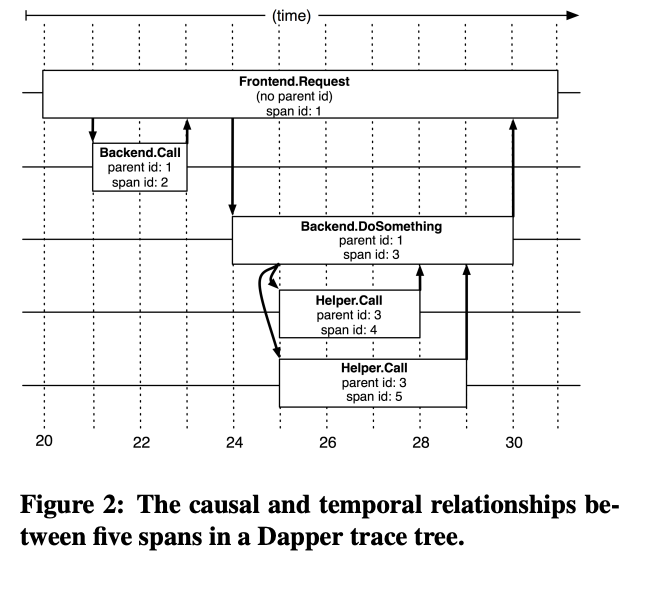
- A relationship between a span and its parent span
- A simple log of timestamped records which encode the span’s start and end time,
- Application-specific annotations
- Root spans (No Parent)
- All spans associated with a specific trace also share a common trace id(Not shown in this figure)
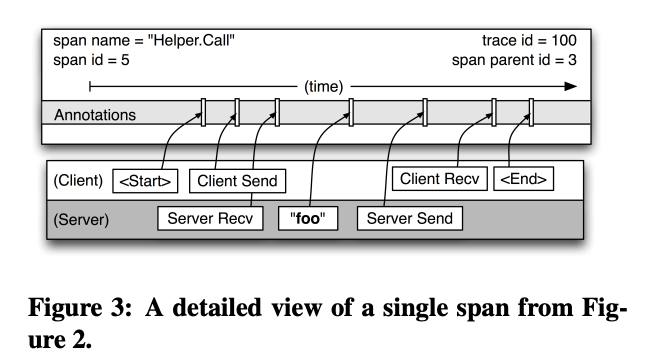
- The longer of the two “Helper.Call” RPCs in Figure 2
- A more detailed view of the logged events in a typical Dapper trace span
- A span can contain information from multiple hosts;
- Every RPC span contains annotations from both the client and server processes, making two-host spans the most common ones
- Be mindful of clock skew
- An RPC client always sends a request before a server
receives it, and vice versa for the server response
2.2 Instrumention point
- When a thread handles a traced control path, Dapper attaches a trace context to thread-local storage
- Ids used for trace reconstruction are able to follow
asynchronous control paths transparently- Dapper ensures that all such callbacks store the
trace context of their creator, and this trace context is associated with the appropriate thread when
the callback is invoked
- Dapper ensures that all such callbacks store the
- The span and trace ids are transmitted from client
to server for traced RPCs
2.3 Annotations
- enrich Dapper traces with additional information
- annotations can have arbitrary content
- individual trace spans have a configurable upper-bound on their total annotation volume
- supports a map of key-value annotations
2.4 Sampling
- control overhead by recording only a fraction of all traces
2.5 Trace collection
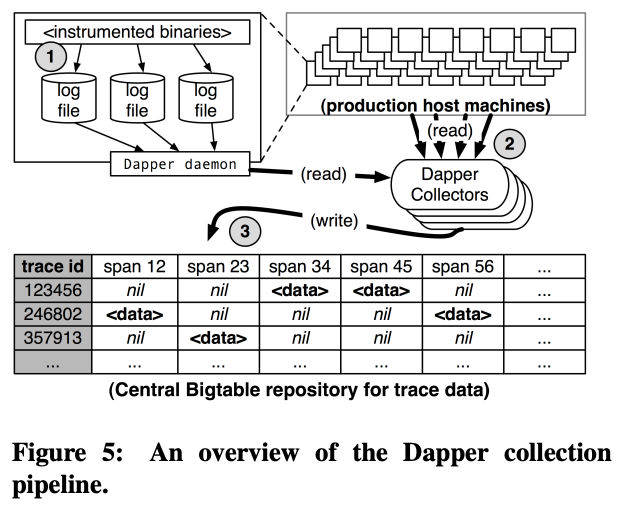
- three-stage process (see Figure 5)
- The median latency for trace data collection that is, the time it takes data to propagate from instrumented application binaries to the
central repository – is less than 15 seconds. - The 98th percentile latency is itself bimodal over time; approximately 75% of the time, 98th percentile collection latency is less
than two minutes, but the other approximately 25% of the
time it can grow to be many hours.
2.5.1 Out-of-band trace collection
- RPC responses can still be comparatively small,often less than ten kilobytes, in which case the inband Dapper trace data would dwarf the application data
and bias the results of subsequent analyses - in-band collection schemes assume that all RPCs are perfectly nested
2.6 Security and privacy considerations
- Dapper stores the name of RPC methods but does not log any payload data at this time.
- The application developer can choose to associate any data it determines to be useful for later analysis with a span
- By tracing public security protocol parameters, Dapper is used to monitor whether applications are satisfying security policies
through proper levels of authentication or encryption
3 Dapper Deployment Status
3.1 Dapper runtime library
- Lightweight
- Stable and robust
3.2 Production coverage
- Dapper provides a simple library to help developers control trace propagation manually as a work-around
- It was off by default during its early days, until we built confidence in its stability and low overhead
3.3 Use of trace annotations
- Programmers tend to use application-specific annotations either as a kind of distributed debug log file or
to classify traces by some application-specific feature.
4 Managing Tracing Overhead
- Avoid performance degradation
- We also describe how Dapper’s adaptive trace sampling mechanism helps us balance the need for low overhead and the desire for representative traces.
4.1 Trace generation overhead
- Root span creation and destruction takes 204 nanoseconds on average,
- Non-root spans takes 176 nanoseconds
- The difference between (Root span) and (Non-root spans) is the added cost of allocating a globally unique trace id for root spans
- If not in sampling,the cost of additional span annotations is averaging about 9 nanoseconds and if in sampling,it costs 40 nanoseconds on average , in 2.2GHz x86 server
- The visible overhead is much reduced since each disk write coalesces multiple log file write operations and executes asynchronously
with respect to the traced application.
4.2 Trace collection overhead
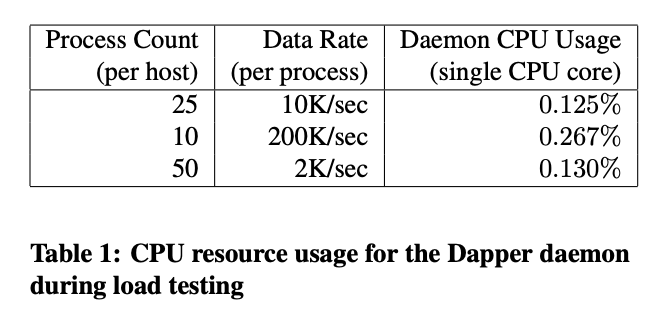
- The daemon never uses more than 0.3% of one core of a production machine during collection
- a very small memory footprint (within the noise of heap fragmentation)
- each span in our repository corresponding to only 426 bytes on average
4.3 Effect on production workloads
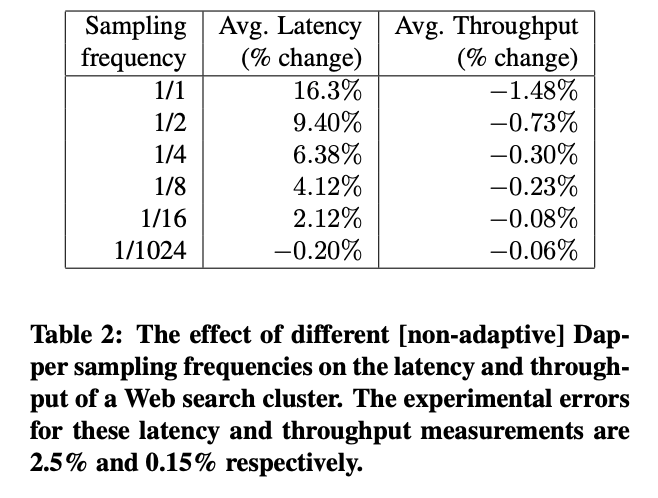
4.4 Adaptive sampling
- We are in the process of deploying an adaptive sampling scheme that is parameterized not by a uniform sampling probability, but by a desired rate of sampled traces
per unit time - Workloads with low traffic automatically increase their sampling rate while those with very high traffic will lower it so that overheads remain under control.
4.5 Coping with aggressive sampling
- For example, every trace can afford to trace, in which case this is what motivated our decision to move towards adaptive sampling rates.
4.6 Additional sampling during collection
-
We leverage the fact that all spans for a given trace – though they may be spread across thousands of distinct host machines – share a common trace id.
-
We hash the associated trace id as a scalar z, where 0 ≤ z ≤ 1
- If z is less than our collection sampling coefficient, we keep the span and write it to the Bigtable
-
We have chosen a runtime sampling rate which yields slightly more data than we can write to our repositories, and we throttle that write rate with the secondary sampling coefficient in the collection system
5 General-Purpose Dapper Tools
- In this section, we summarize which approaches have worked and which haven’t, and we provide basic usage information about these general-purpose analytical tools
5.1 The Dapper Depot API
- The DAPI and the Dapper trace repositories were designed in tandem, and the DAPI is meant to expose a clean and intuitive interface to the raw data contained within these Dapper repositories
-
three ways to access trace data
-
Access by trace id
-
Bulk access
-
Indexed access:
-
Timestamped application annotations are also accessible via the span structures
-
Custom index :
- Initially, we deployed two indices: one index for host machines, and one for service names.
- Need a composite index which allows for efficient lookup by service name, host machine, and timestamp.
-
DAPI usage within Google
- There are three classes of DAPI usage at Google
- persistent online web applications which make use of DAPI
- well-maintained DAPI-based tools which can be run ondemand from the command line
- one-off analytical tools which are written, run, and mostly forgotten
- There are three classes of DAPI usage at Google
-
5.2 The Dapper user interface
[外链图片转存失败,源站可能有防盗链机制,建议将图片保存下来直接上传(img-ivkMGe6L-1636353304612)(https://user-images.githubusercontent.com/31843331/139775552-91079fa5-18bb-4a41-b479-35dbaa6516d8.png)]
- user workflow
- distinguish trace patterns
- sort execution patterns as they wish and choose
- the user is presented with a graphical depiction of said execution pattern
- the Dapper user interface presents a simple frequency histogram over that metric space
- communicating directly with Dapper daemons on each production machine to seek the real time data
6 Experiences
6.1 Using Dapper during development
- Dapper helped them improve their service in the following ways
- Performance
- Correctness
- Understanding
- Testing
- Exception monitoring
6.2 Addressing long tail latency
-
When systems involve not just dozens of subsystems but dozens of engineering teams, even our best and most experienced engineers routinely
guess wrong about the root cause of poor end-to-end performance.- In such situations, Dapper can furnish much needed facts and is able to answer many important performance questions conclusively
-
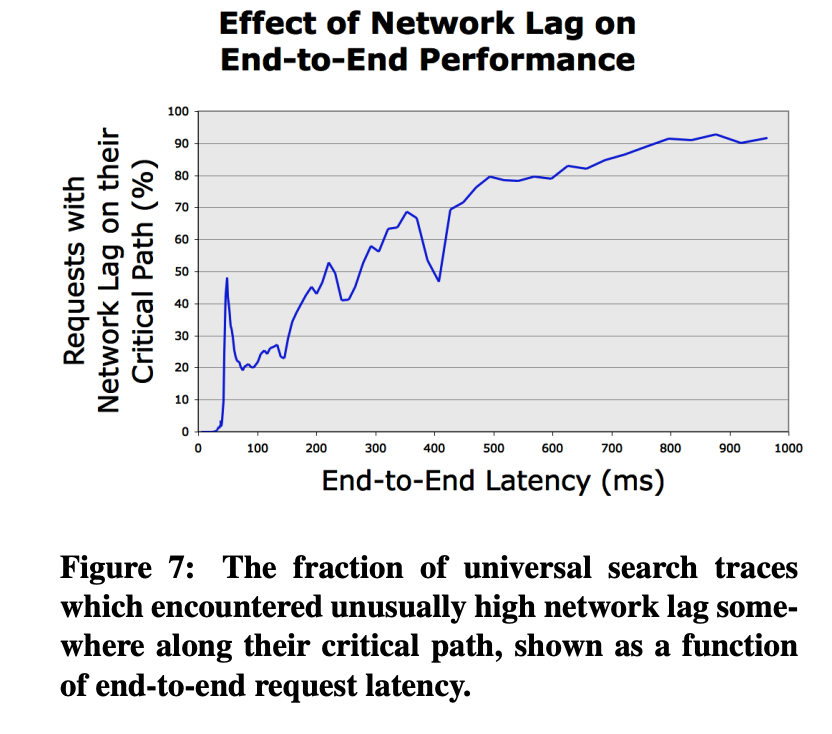
Hierarchical critical paths from DAPI Trace objects were used to diagnose problems and prioritize prospective performance improvements for universal search,
which led to the following discoveries:-
Momentary degradation in network performance
along the critical path does not affect system
throughput, but it can have a profound effect on outlier latency
-
There were many problematic and expensive query
patterns which resulted from unintended interactions between services. -
Common queries were harvested from a secure logs
repository outside of Dapper, and, using Dapper’s
unique trace ids, joined with the Dapper repositories
-
6.3 Inferring service dependencies
- Using Dapper’s core instrumentation along with Dapper trace annotations, the service dependencies project
is able to infer dependencies between individual jobs, as
well as dependencies on shared software infrastructure
used by those jobs.
6.4 Network usage of different services
- a birds-eye view of global network utilization
- well-suited to the task of application-level analysis of inter-cluster network activity
- a continuously-updating console showing the most active application-level endpoints for inter-cluster network traffic
- able to point to the causal trace root for these expensive network requests rather than restricting ourselves to the two peer
machines in isolation
6.5 Layered and Shared Storage Systems
- can group and aggregate trace performance information
across the various clients of any shared service - makes it easy for the owners of shared services to rank
their users in terms of various metrics
6.6 Firefighting with Dapper
- Dapper is useful for some but not all firefighting tasks
- By communicating directly with the
Dapper daemons, fresh data about specific high-latency
traces can be gathered without difficulty
7 Other Lessons Learned
- Dapper’s broad usage within Google has also provided us with valuable feedback on some of its limitations
- coalescing effect
- In some cases it is more efficient to buffer a few requests before performing an operation on a group of requests at once.
In such instances, a traced request can be blamed for a deceptively large unit of work - If multiple traced requests are batched together, only one of them will appear responsible for the span due to our
reliance on a single unique trace id for each trace. - We are considering solutions that could identify these cases and log the minimum amount of information required to disambiguate them
- In some cases it is more efficient to buffer a few requests before performing an operation on a group of requests at once.
- Tracing batch workloads:
- fit the MapReduce model, can also benefit from better performance insight.
- Finding a root cause
- Dapper is effective in determining which part of a system is experiencing slowdowns,
but is not always sufficient for finding the root causes
- Dapper is effective in determining which part of a system is experiencing slowdowns,
- Logging kernel-level information
- We are investigating a possible compromise solution, in which we take snapshots of a few kernel-level activity parameters from user level and associate them with an active span
- coalescing effect
8 Related Work
- More useful in uncovering performance issues and improving the general understanding of the behavior of large complex workloads.
- Dapper Mostly focuses on library and middleware modifications
- Magpie: abandoned the use of global IDs, and the challenges of correctly propagating them, by adopting an event schema
- X-Trace: traces are collected not only at node boundaries but also whenever control is passed between different software layers within a node
- Dapper: 1. creating the minimum set of mechanisms that enable all work done on behalf of a given original request to be tied together.
2. enriched by optional application annotations
9 Conclusion
- Dapper achieves a higher degree of application-level transparency than previous annotationbased distributed tracing systems
- Unusual homogeneity of our computing deployment
- Creation of many more analysis tools than the Dapper team alone could have been able to produce in isolation


 743
743


 被折叠的 条评论
为什么被折叠?
被折叠的 条评论
为什么被折叠?
 到【灌水乐园】发言


