import numpy as np
import matplotlib.pyplot as plt
def sin_wave(A, f, fs, phi, t):
'''
:params A: 振幅
:params f: 信号频率
:params fs: 采样频率
:params phi: 相位
:params t: 时间长度
'''
Ts = 1/fs
n = t / Ts
n = np.arange(n)
y = A*np.sin(2*np.pi*f*n*Ts + phi*(np.pi/180))
return y
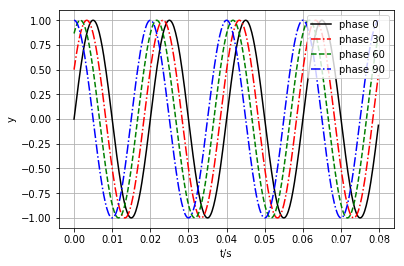
fs = 5000
hz_50 = sin_wave(A=1, f=50, fs=fs, phi=0, t=0.08)
hz_50_30 = sin_wave(A=1, f=50, fs=fs, phi=30, t=0.08)
hz_50_60 = sin_wave(A=1, f=50, fs=fs, phi=60, t=0.08)
hz_50_90 = sin_wave(A=1, f=50, fs=fs, phi=90, t=0.08)
x = np.arange(0, 0.08, 1/fs)
plt.xlabel('t/s')
plt.ylabel('y')
plt.grid()
plt.plot(x, hz_50, 'k')
plt.plot(x, hz_50_30, 'r-.')
plt.plot(x, hz_50_60, 'g--')
plt.plot(x, hz_50_90, 'b-.')
plt.legend(['phase 0', 'phase 30', 'phase 60', 'phase 90'], loc=1)


 2291
2291

 被折叠的 条评论
为什么被折叠?
被折叠的 条评论
为什么被折叠?
 到【灌水乐园】发言


