


Go 的运行时性能分析接口都位于 runtime/pprof 包中。只需要调用 runtime/pprof 库即可得到我们想要的数据。
CPU 性能分析
编写代码,生成分析报告
假设我们实现了这么一个程序,随机生成了 5 组数据,并且使用冒泡排序法排序。
为了度量该程序性能,只需要添加两行代码即可,见下面代码!
package main

import (
    "math/rand"
    "os"
    "runtime/pprof"
    "time"
)

func generate(n int) []int {
    rand.Seed(time.Now().UnixNano())
    nums := make([]int, 0)
    for i := 0; i < n; i++ {
        nums = append(nums, rand.Int())
    }
    return nums
}
func bubbleSort(nums []int) {
    for i := 0; i < len(nums); i++ {
        for j := 1; j < len(nums)-i; j++ {
            if nums[j] < nums[j-1] {
                nums[j], nums[j-1] = nums[j-1], nums[j]
            }
        }
    }
}

func main() {
    pprof.StartCPUProfile(os.Stdout) //只需添加这两行代码
    defer pprof.StopCPUProfile()     //只需添加这两行代码
    n := 10
    for i := 0; i < 5; i++ {
        nums := generate(n)
        bubbleSort(nums)
        n *= 10
    }
}
为了简单,直接将数据输出到标准输出 os.Stdout。运行该程序,将输出定向到文件 cpu.pprof 中。
D:\GOMOD\sheji_shixian\first>go run test.go > cpu.pprof
一般来说,不建议将结果直接输出到标准输出,因为如果程序本身有输出,则会相互干扰,直接记录到一个文件中是最好的方式。
package main

import (
    "math/rand"
    "os"
    "runtime/pprof"
    "time"
)

func generate(n int) []int {
    rand.Seed(time.Now().UnixNano())
    nums := make([]int, 0)
    for i := 0; i < n; i++ {
        nums = append(nums, rand.Int())
    }
    return nums
}
func bubbleSort(nums []int) {
    for i := 0; i < len(nums); i++ {
        for j := 1; j < len(nums)-i; j++ {
            if nums[j] < nums[j-1] {
                nums[j], nums[j-1] = nums[j-1], nums[j]
            }
        }
    }
}

func main() {
    f, _ := os.OpenFile("cpu.pprof", os.O_CREATE|os.O_RDWR, 0644)
    defer f.Close()
    pprof.StartCPUProfile(f)     //只需添加这两行代码
    defer pprof.StopCPUProfile() //只需添加这两行代码
    n := 10
    for i := 0; i < 5; i++ {
        nums := generate(n)
        bubbleSort(nums)
        n *= 10
    }
}
D:\GOMOD\sheji_shixian\first>go run test.go
分析数据
接下来,可以用 go tool pprof 分析这份数据
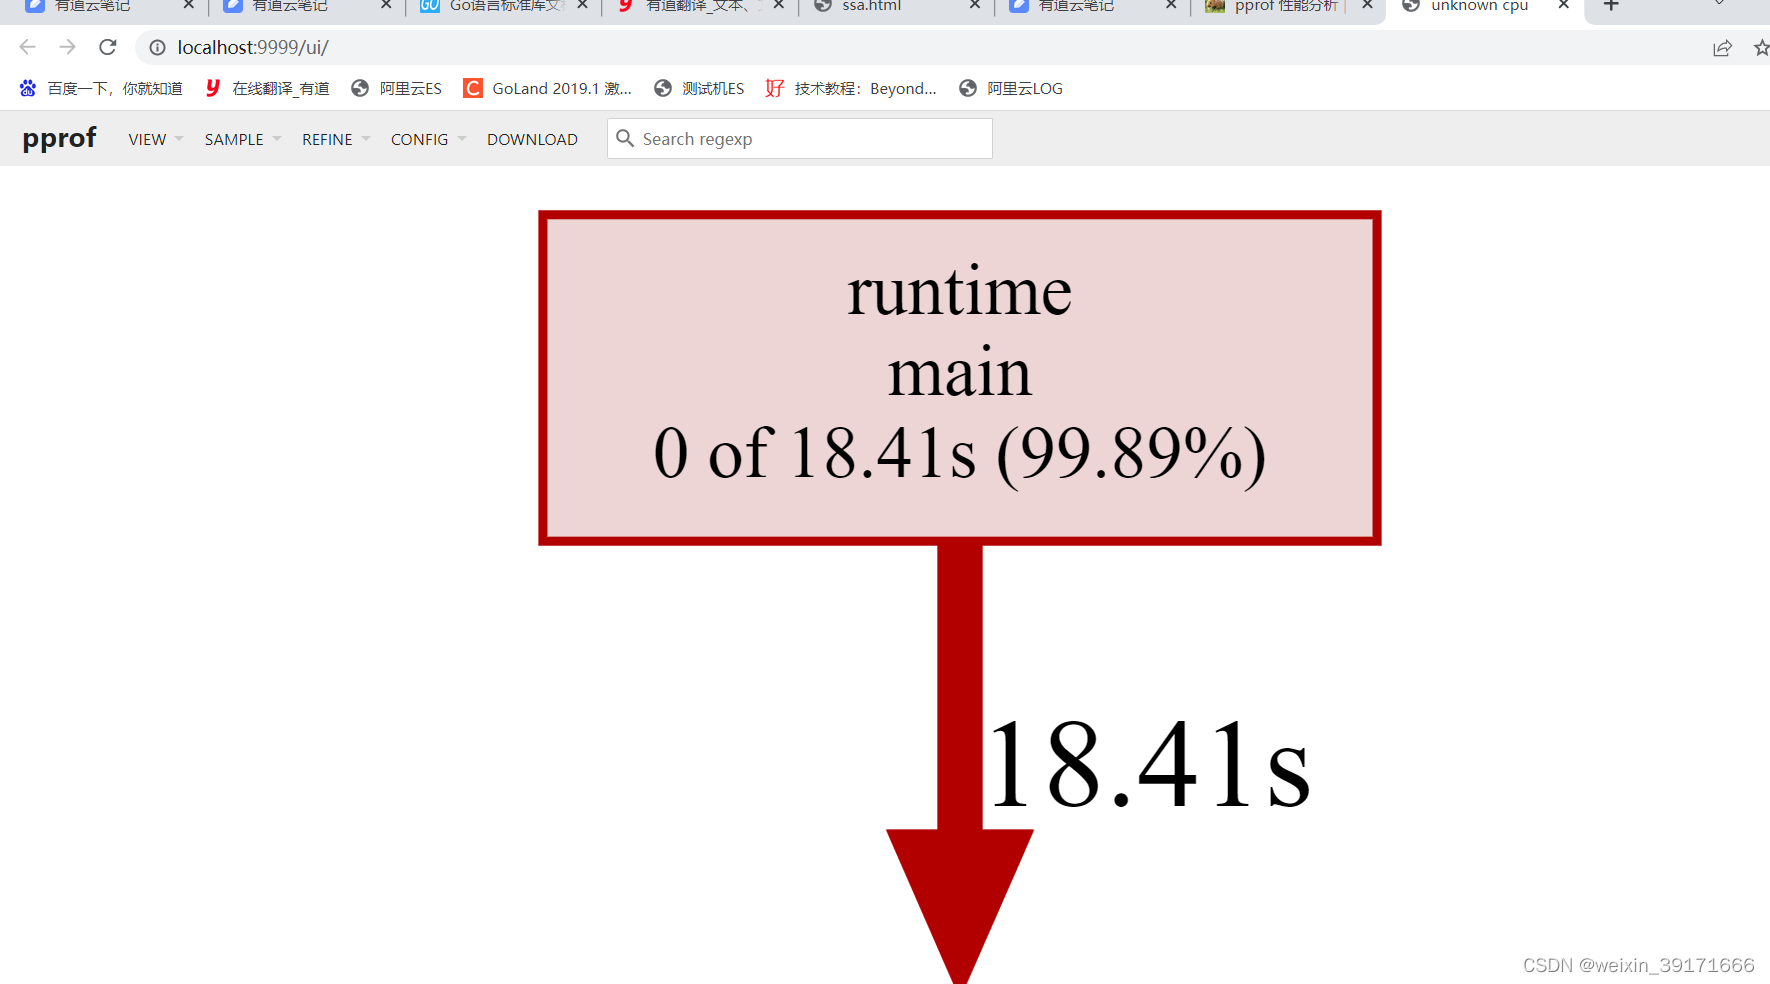
浏览器查看数据
go tool pprof -http=:9999 cpu.pprof
如果提示 Graphviz 没有安装,则需要安装!
命令行查看数据
除了在网页中查看分析数据外,我们也可以在命令行中使用交互模式查看。
D:\GOMOD\sheji_shixian\first>go tool pprof cpu.pprof
Type: cpu
Time: Mar 17, 2023 at 9:10pm (CST)
Duration: 18.64s, Total samples = 18.43s (98.88%)
Entering interactive mode (type "help" for commands, "o" for options)
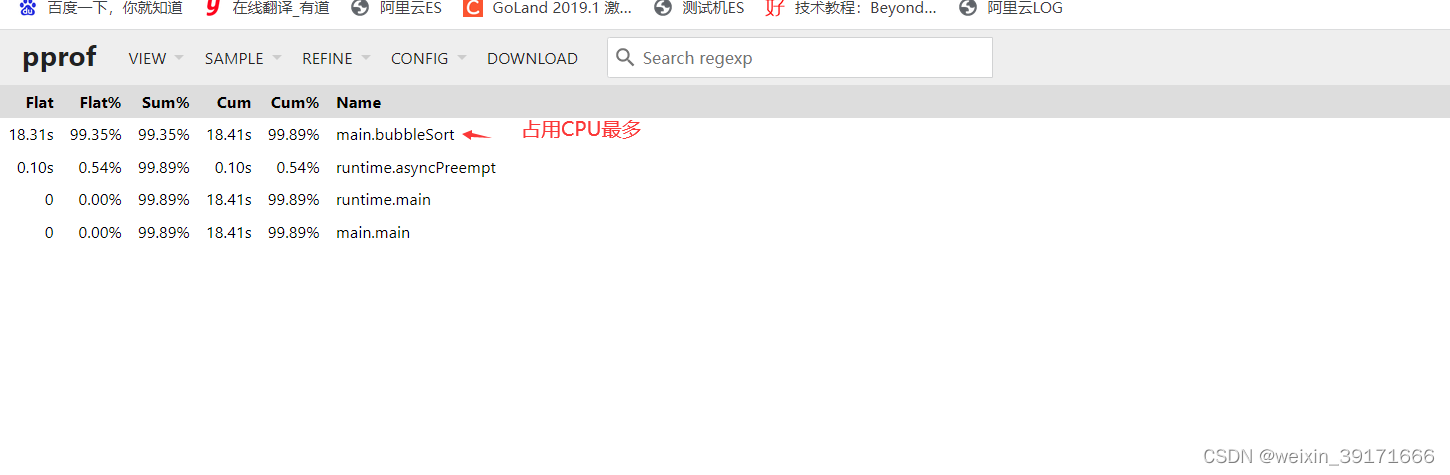
(pprof) top //这个top是敲入的命令
Showing nodes accounting for 18.41s, 99.89% of 18.43s total
Dropped 8 nodes (cum <= 0.09s)
flat flat% sum% cum cum%
18.31s 99.35% 99.35% 18.41s 99.89% main.bubbleSort (inline)
0.10s 0.54% 99.89% 0.10s 0.54% runtime.asyncPreempt
0 0% 99.89% 18.41s 99.89% main.main
0 0% 99.89% 18.41s 99.89% runtime.main
(pprof) cum
unknown config field "cum"
(pprof) top --cum //按照cum (累计消耗)排序:
Showing nodes accounting for 18.41s, 99.89% of 18.43s total
Dropped 8 nodes (cum <= 0.09s)
flat flat% sum% cum cum%
18.31s 99.35% 99.35% 18.41s 99.89% main.bubbleSort (inline)
0 0% 99.35% 18.41s 99.89% main.main
0 0% 99.35% 18.41s 99.89% runtime.main
0.10s 0.54% 99.89% 0.10s 0.54% runtime.asyncPreempt
(pprof)
内存性能分析
生成 profile
假设我们实现了这么一个程序,生成长度为 N 的随机字符串,拼接在一起。
接下来,我们使用一个易用性更强的库 pkg/profile 来采集性能数据,pkg/profile 封装了 runtime/pprof 的接口,使用起来更简单。
package main

import (
    "math/rand"

    "github.com/pkg/profile"
)

const letterBytes = "abcdefghijklmnopqrstuvwxyzABCDEFGHIJKLMNOPQRSTUVWXYZ"

func randomString(n int) string {
    b := make([]byte, n)
    for i := range b {
        b[i] = letterBytes[rand.Intn(len(letterBytes))]
    }
    return string(b)
}

func concat(n int) string {
    s := ""
    for i := 0; i < n; i++ {
        s += randomString(n)
    }
    return s
}

func main() {
    defer profile.Start(profile.MemProfile, profile.MemProfileRate(1)).Stop() //只需一行代码即可
    concat(100)
}
运行,生成报告:
D:\GOMOD\sheji_shixian\first>go run test.go
2023/03/17 22:10:37 profile: memory profiling enabled (rate 1), C:\Users\szl32\AppData\Local\Temp\profile1188113120\mem.pprof
2023/03/17 22:10:37 profile: memory profiling disabled, C:\Users\szl32\AppData\Local\Temp\profile1188113120\mem.pprof
分析数据
D:\GOMOD\sheji_shixian\first>go tool pprof -http=:9999 C:\Users\szl32\AppData\Local\Temp\profile1188113120\mem.pprof
Serving web UI on http://localhost:9999
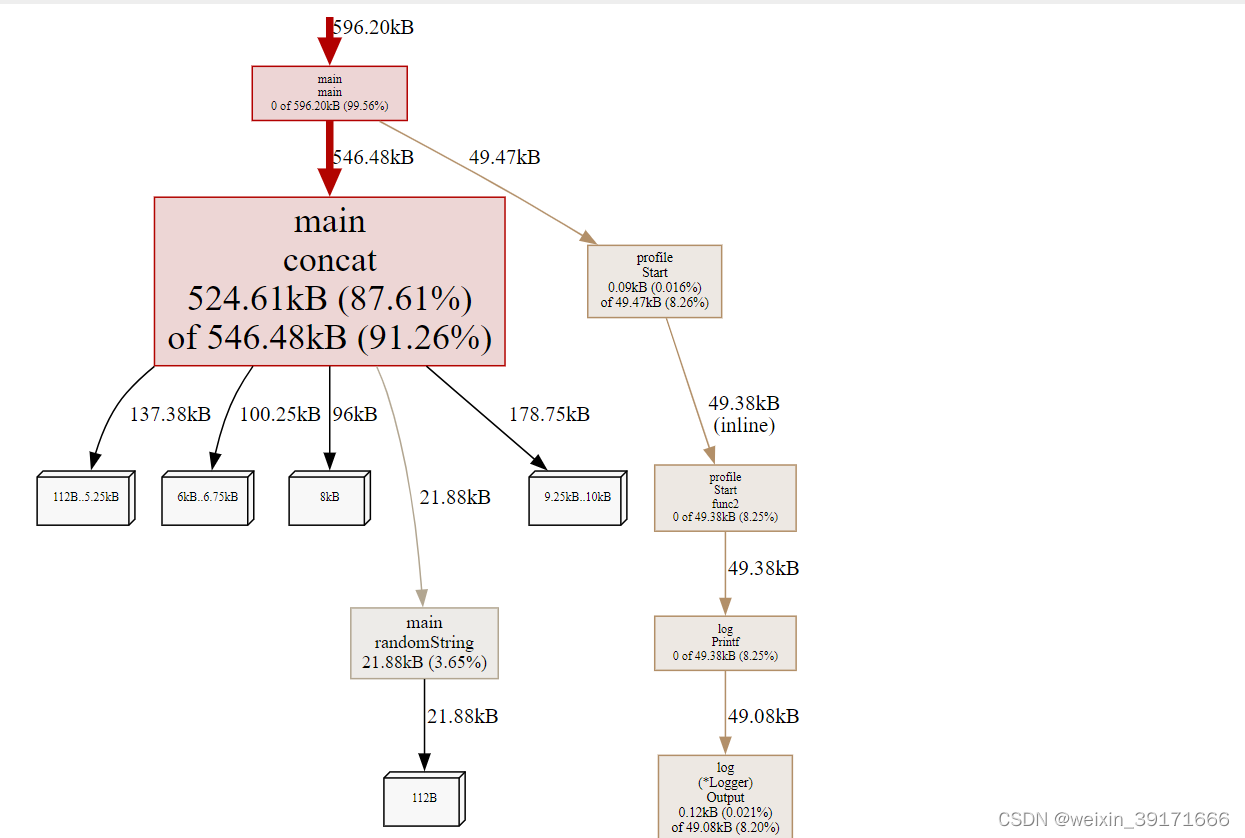
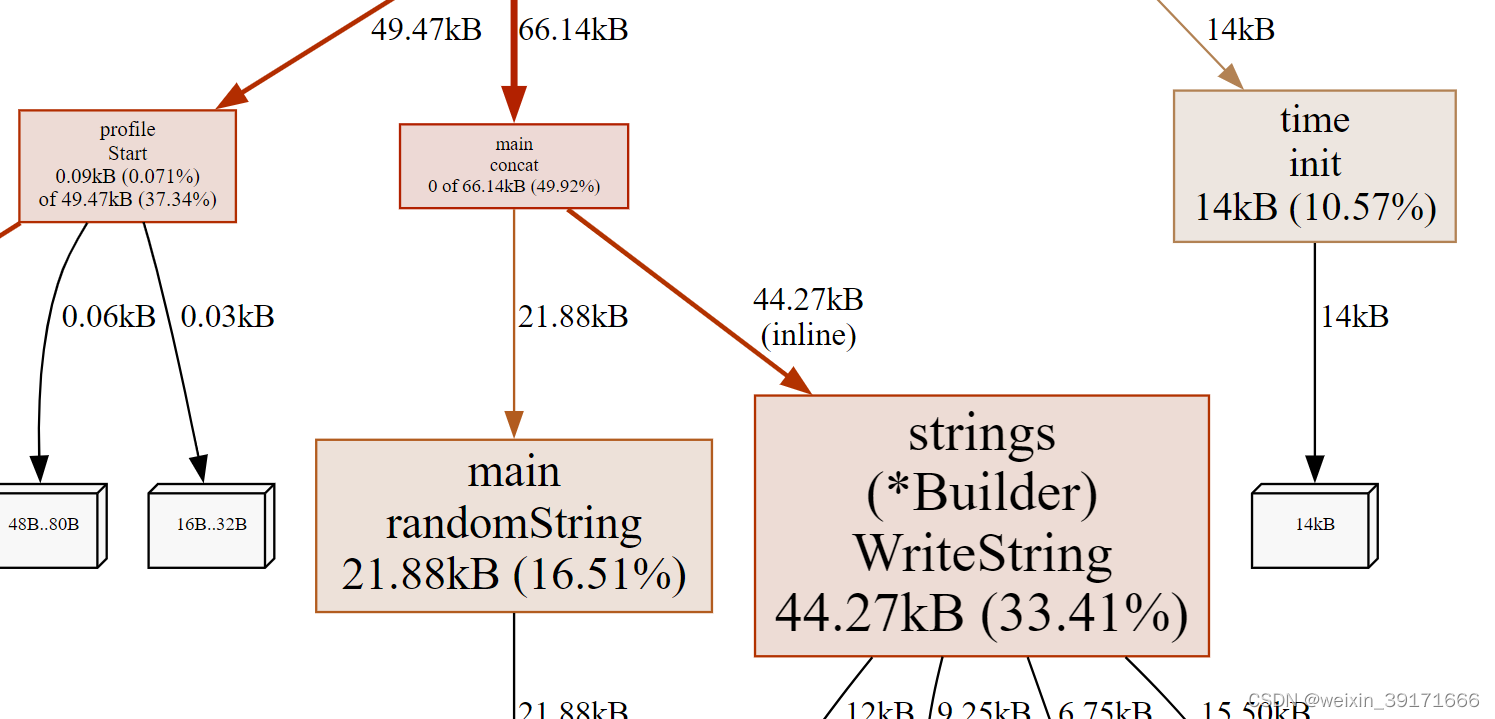
从这张图中,我们可以看到 concat 消耗了 524k 内存,randomString 仅消耗了 22k 内存。理论上,concat 函数仅仅是将 randomString 生成的字符串拼接起来,消耗的内存应该和 randomString 一致,但怎么会产生 20 倍的差异呢?这和 Go 语言字符串内存分配的方式有关系。字符串是不可变的,因为将两个字符串拼接时,相当于是产生新的字符串,如果当前的空间不足以容纳新的字符串,则会申请更大的空间,将新字符串完全拷贝过去,这消耗了 2 倍的内存空间。在这 100 次拼接的过程中,会产生多次字符串拷贝,从而消耗大量的内存。
那有什么好的方式呢?使用 strings.Builder 替换 + 进行字符串拼接,将有效地降低内存消耗。
func concat(n int) string {
    var s strings.Builder
    for i := 0; i < n; i++ {
        s.WriteString(randomString(n))
    }
    return s.String()
}
重新运行,生成报告:
D:\GOMOD\sheji_shixian\first>go run test.go
2023/03/17 22:15:43 profile: memory profiling enabled (rate 1), C:\Users\szl32\AppData\Local\Temp\profile2610569717\mem.pprof
2023/03/17 22:15:43 profile: memory profiling disabled, C:\Users\szl32\AppData\Local\Temp\profile2610569717\mem.pprof
在用浏览器查看:
D:\GOMOD\sheji_shixian\first>go tool pprof -http=:9999 C:\Users\szl32\AppData\Local\Temp\profile2610569717\mem.pprof
Serving web UI on http://localhost:9999
在此查看,发现concat函数内部,销号的内存为0了,当然WriteString消耗的内存,是另算的!
benchmark 生成 profile
什么是pprof
pprof是process profile(进程图像)的缩写!
pprof是Go官方提供的性能分析工具,可以分析程序的运行情况,并且提供可视化的功能。使用pprof可以分析以下几种指标数据:
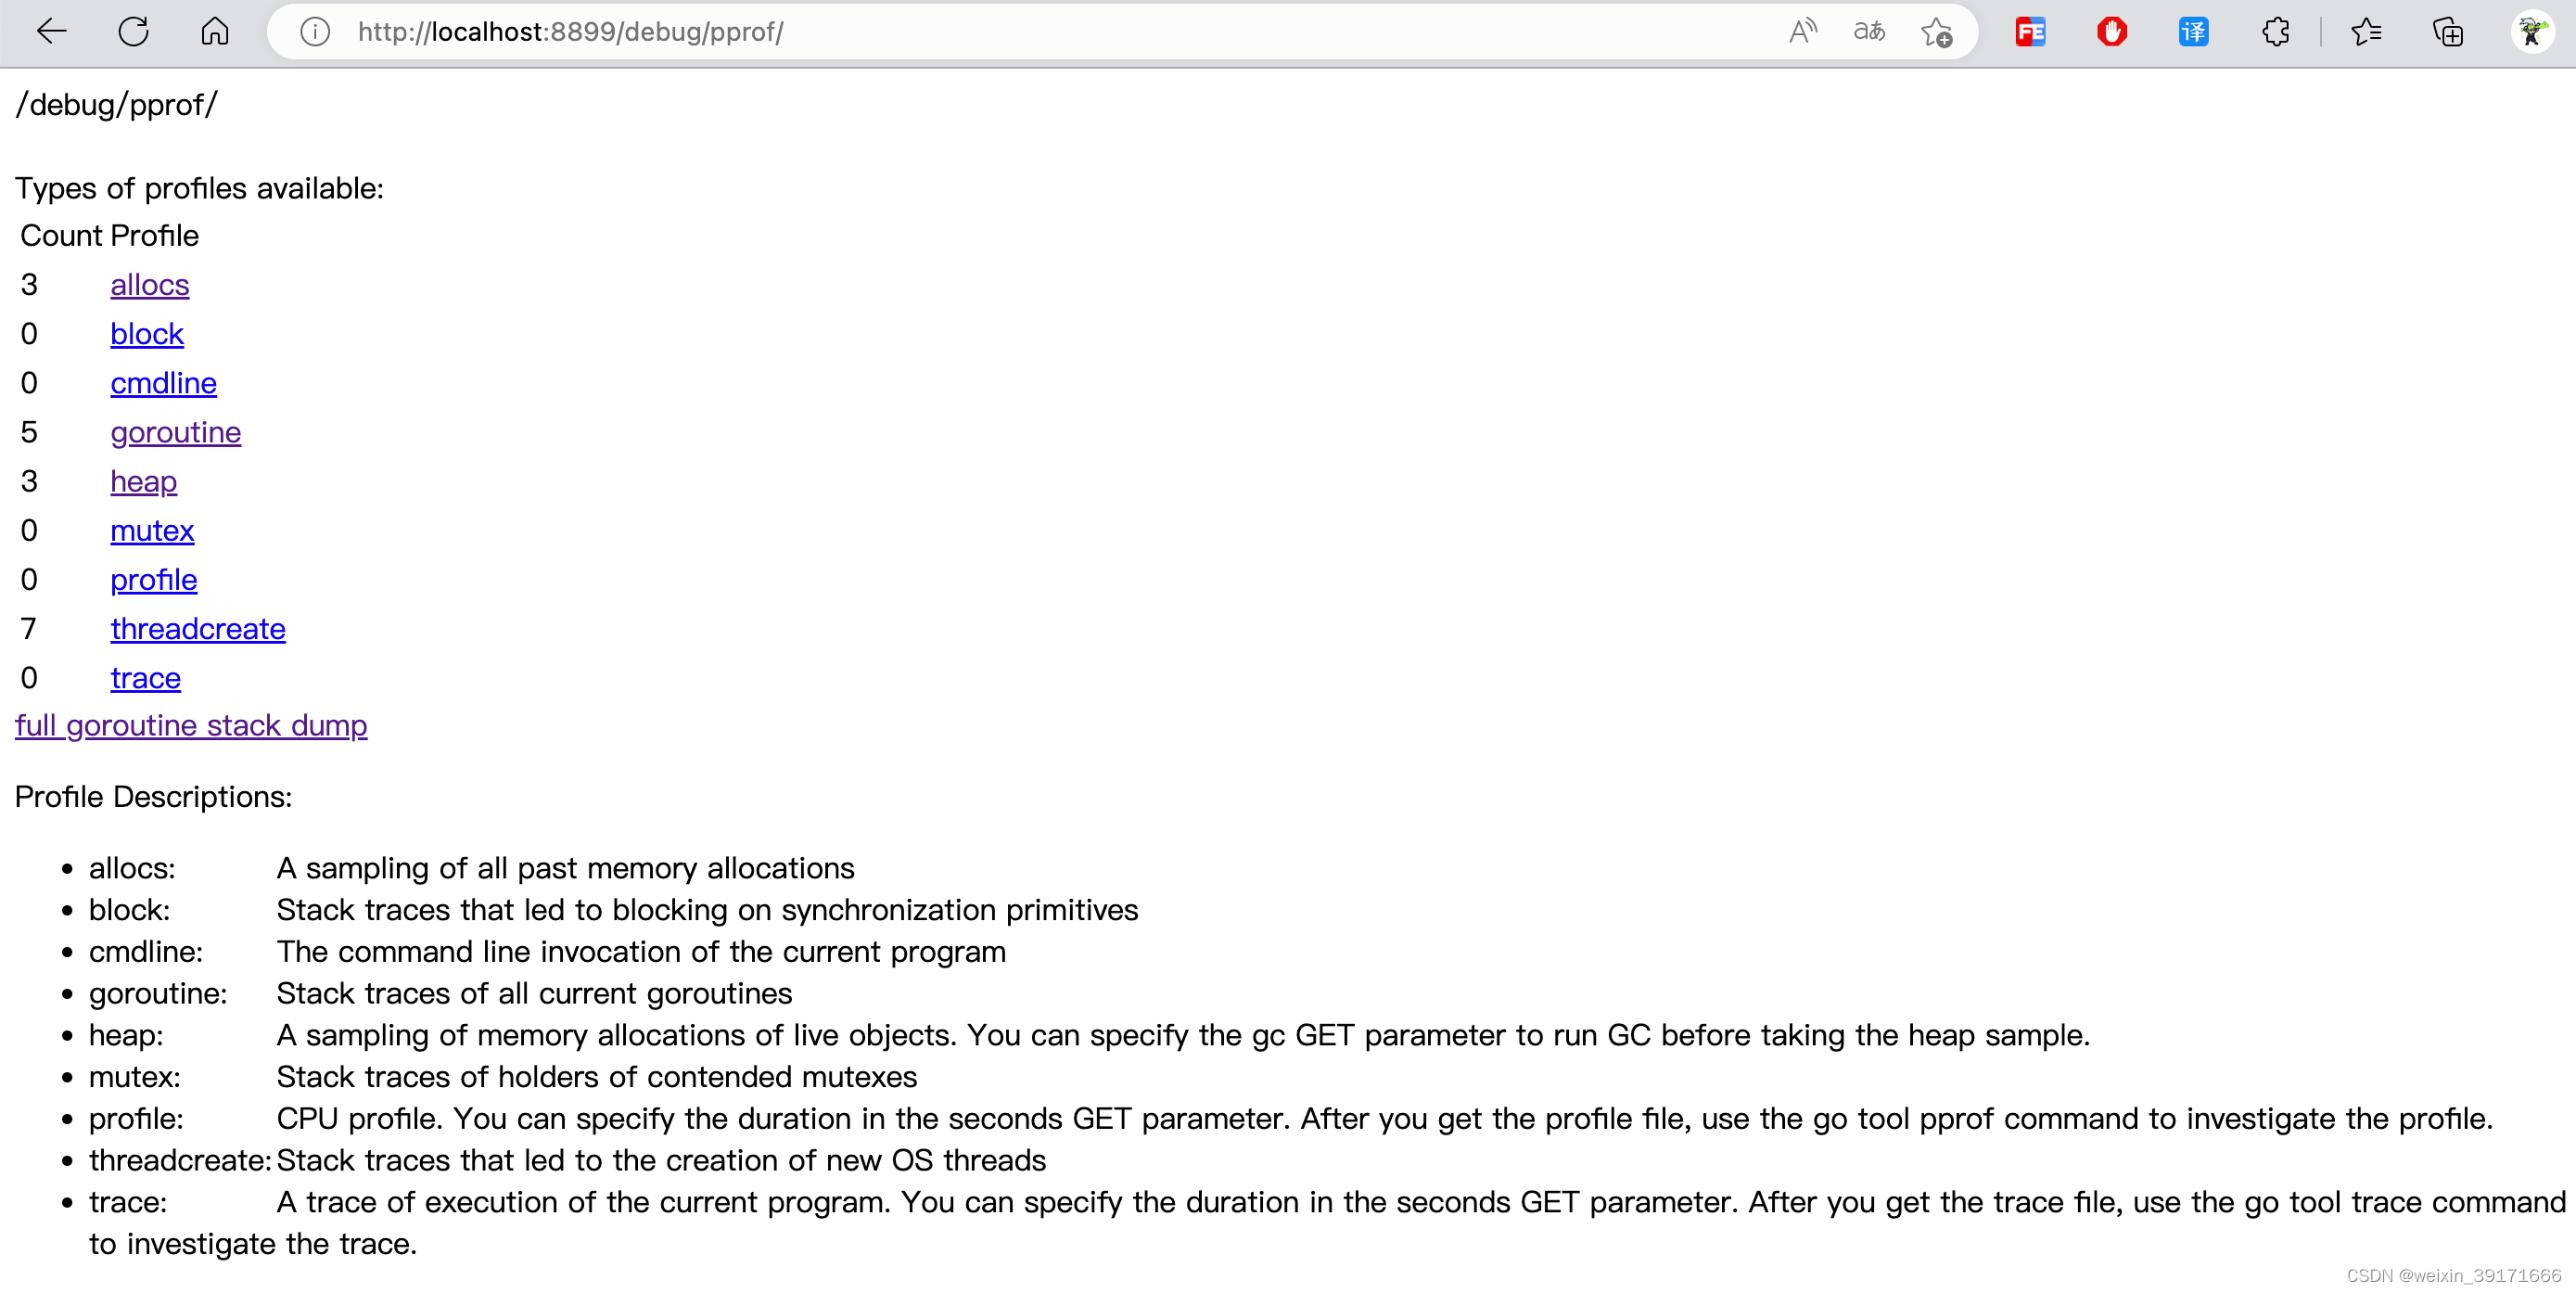
allocs:程序启动之后内存分配的情况,浏览器可读性不好!
block:导致阻塞操作的一些堆栈跟踪信息,浏览器可读性不好!
cmdline:当前程序启动的命令行以及参数,浏览器可读性不好!
goroutine:所有当前 goroutine 的堆栈跟踪信息,浏览器可读性不好!
heap:程序在当前堆上内存分配的情况,浏览器可读性不好!
mutex:锁资源的竞争的堆栈信息,浏览器可读性不好!
profile:分析一定持续时间内CPU的使用情况。可以在 debug/pprof?seconds=x秒 GET 参数中指定持续时间。获取pprof文件后,使用 go tool pprof x.prof命令分析pprof文件。浏览器打开会下载文件!
threadcreate:系统线程的使用情况,浏览器可读性不好!
trace:当前系统的代码执行的链路情况,浏览器打开会下载文件!
所以我们一般都是通过命令行交互使用!
使用pprof工具主要分析以下几种指标:
- CPU Profiling:CPU 分析,按照一定的频率采集所监听的应用程序 CPU(含寄存器)的使用情况,可确定应用程序在主动消耗CPU 周期时花费时间的位置
- Memory Profiling:内存分析,在应用程序进行堆分配时记录堆栈跟踪,用于监视当前和历史内存使用情况,以及检查内存泄漏
- Block Profiling:阻塞分析,记录 goroutine 阻塞等待同步(包括定时器通道)的位置
- Mutex Profiling:互斥锁分析,报告互斥锁的竞争情况。
当程序存在内存或者CPU飙升的情况时,我们可以通过pprof工具来查询问题出现的根源。
1、当 CPU 性能分析启用后,Go runtime 会每 10ms 就暂停一下,记录当前运行的 goroutine 的调用堆栈及相关数据。当性能分析数据保存到硬盘后,我们就可以分析代码中的热点了。
2、内存性能分析则是在堆(Heap)分配的时候,记录一下调用堆栈。默认情况下,是每 1000 次分配,取样一次,这个数值可以改变。栈(Stack)分配 由于会随时释放,因此不会被内存分析所记录。由于内存分析是取样方式,并且也因为其记录的是分配内存,而不是使用内存。因此使用内存性能分析工具来准确判断程序具体的内存使用是比较困难的。
3、阻塞分析是一个很独特的分析,它有点儿类似于 CPU 性能分析,但是它所记录的是 goroutine 等待资源所花的时间。阻塞分析对分析程序并发瓶颈非常有帮助,阻塞性能分析可以显示出什么时候出现了大批的 goroutine 被阻塞了。阻塞性能分析是特殊的分析工具,在排除 CPU 和内存瓶颈前,不应该用它来分析。
注意这里的内存分析,分析的一般都是堆内存,栈内存不会统计!
这里内存主要是堆内存,一般的栈内存是不会被统计到。不过出现内存逃逸就另说了。
怎么使用pprof
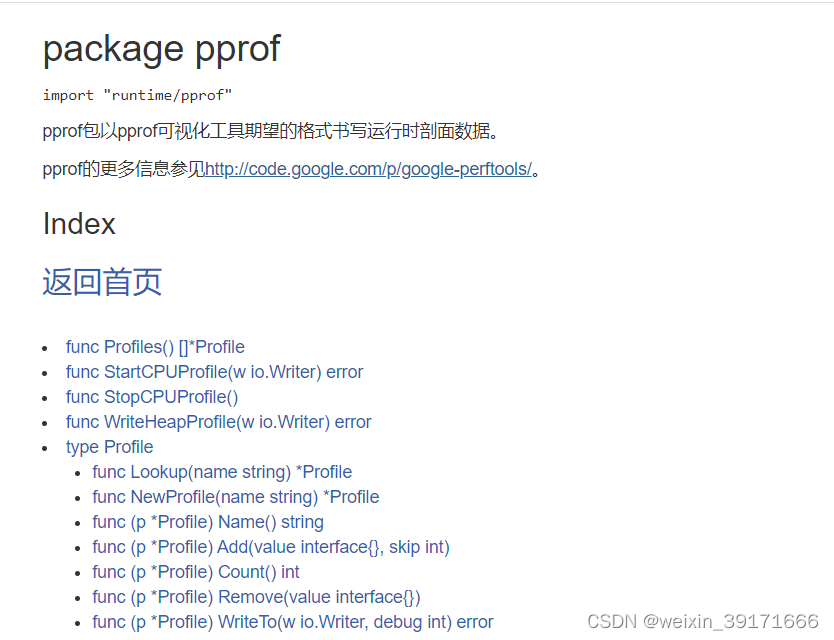
pprof包含两个相关的库:
-
runtime/pprof(基本所有的pprof库都是基于此实现的)
- 主要应用于工具型应用。包含脚本、定时任务等。
- 如:对于只跑一次的程序,例如每天只跑一次的离线预处理程序,调用 pprof 包提供的函数,手动开启性能数据采集
-
net/http/pprof
- 主要应用于服务型应用。包含HTTP服务,GRPC服务等。
- 如:对于在线服务,对于一个 HTTP Server,访问 pprof 提供的 HTTP 接口,获得性能数据。当然,实际上这里底层也是调用的 runtime/pprof提供的函数,封装成接口对外提供网络访问。
(非常驻进程)工具型应用(runtime/pprof)
工具型应用主要使用runtime/pprof包实现性能分析。
该扩展生成的性能分析文件,必须得在程序执行完毕即退出之后,才能查看完整的分析结果!
扩展大概
具体代码
/*
 * @Description:
 * @version:
 * @Author: Steven
 * @Date: 2023-03-17 14:19:57
 */

package main

import (
    "fmt"
    "os"
    "runtime/pprof"
)

func main() {
    // --- cpu 分析示例 start---
    // 创建cpu分析文件
    fc, err := os.Create("./cpu.prof")
    if err != nil {
        fmt.Println("create cpu.prof err:", err.Error())
        return
    }
    defer fc.Close()

    // 开始分析cpu
    err = pprof.StartCPUProfile(fc)
    if err == nil {
        defer pprof.StopCPUProfile()
    }
    // --- cpu 分析示例 end---

    //业务逻辑代码写到WriteHeapProfile函数上面,可以看到业务逻辑代码消耗内存情况
    ptr1, ptr2 := func1_1()
    v1, v2 := func2_1()
    fmt.Println(v1[0], v2[0])
    fmt.Println((*ptr1)[0], (*ptr2)[0])

    // --- 内存 分析示例 start---
    fm, err := os.Create("./memory.prof")
    if err != nil {
        fmt.Println("create memory.prof err:", err.Error())
        return
    }
    defer fm.Close()

    // 开始分析内存
    err = pprof.WriteHeapProfile(fm) //内存分析,不需要调用关闭之类的函数
    if err != nil {
        fmt.Println("write heap prof err:", err.Error())
        return
    }
    // --- 内存 分析示例 end---

    //将业务逻辑写在WriteHeapProfile下面,不知为什么看不到业务逻辑代码所占用内存情况
    // ptr1, ptr2 := func1_1()
    // fmt.Println((*ptr1)[0], (*ptr2)[0])
    // v1, v2 := func2_1()
    // fmt.Println(v1[0], v2[0])
}

func func1_1() (*[]byte, *[]byte) {
    fmt.Println("call func1_1")
    sl := make([]byte, 0)
    for i := 0; i < 1024*1024*400; i++ {
        sl = append(sl, byte(i))
    }
    for i := 0; i < 200*1024*1024; i++ {

    }
    ptr := func1_2()
    return &sl, ptr
}

var container []byte

func func1_2() *[]byte {
    fmt.Println("call func1_2")
    container = make([]byte, 0)
    for i := 0; i < 1024*1024*200; i++ {
        container = append(container, byte(i))
    }
    return &container
}

func func2_1() ([]byte, []byte) {
    fmt.Println("call func1_1")
    sl := make([]byte, 0)
    for i := 0; i < 1024*1024*400; i++ {
        sl = append(sl, byte(i))
    }
    for i := 0; i < 200*1024*1024; i++ {

    }
    ptr := func2_2()
    return sl, ptr
}

func func2_2() []byte {
    fmt.Println("call func1_2")
    container = make([]byte, 0)
    for i := 0; i < 1024*1024*200; i++ {
        container = append(container, byte(i))
    }
    return container
}
运行代码:
D:\GOMOD\sheji_shixian\first>go run .
call func1_1
call func1_2
call func1_1
call func1_2
0 0
0 0
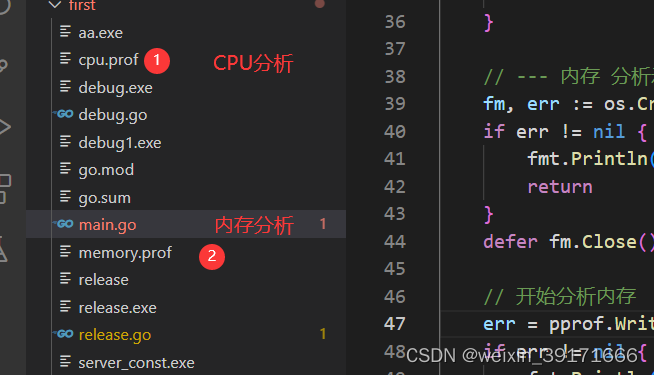
可以看到生成了cpu.prof和memory.prof文件。
开始分析
命令行分析内存
go tool pprof memory.prof
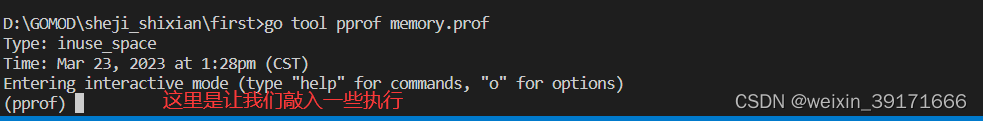
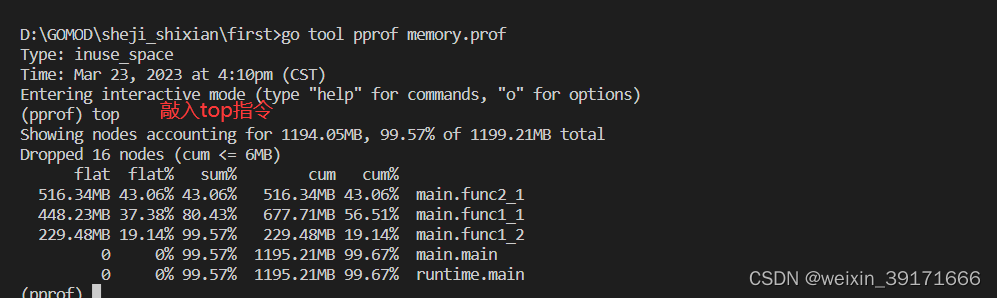
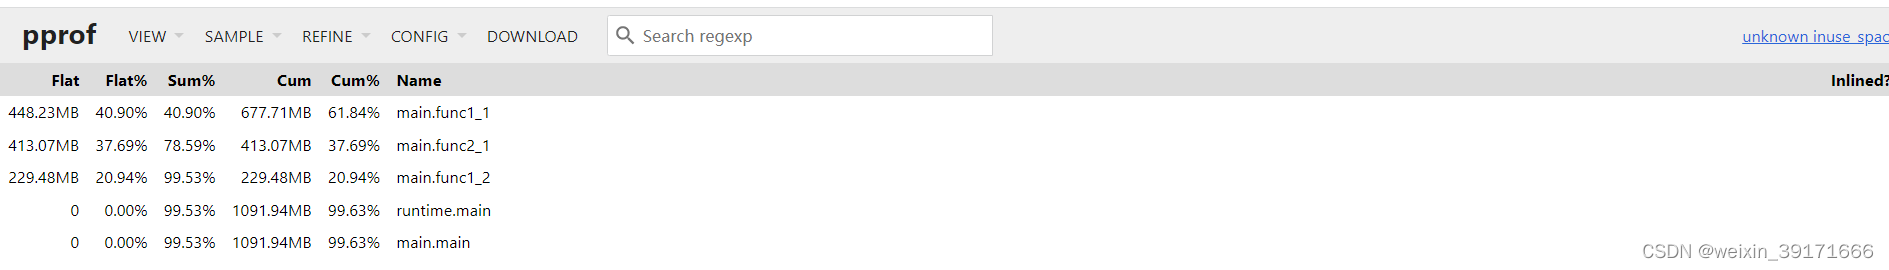
每一行表示一个函数的信息,列信息字段解释:
* flat:代表当前函数(不包含当前函数的调用函数所占用的内存)所分配的内存值
* flat%:代表当前函数所分配的内存值的总消耗内存的占比;
* sum%:代表当前topN函数分配的内存占比。例如第二行44.48%,是指第二行和第一行flat%之和,即top2的内存占比总和。
* cum:代表当前函数以及其调用的函数所申请的总内存;
* cum%:代表当前函数以及其调用的函数所申请的总内存占进程总内存的比值。
* 最后一列:函数的名字
上面结果
* 第一行表示:func2_1函数申请了516.34M内存,而子函数func2_2没有显示出来,不知为什么?我的理解就是被垃圾回收回收了,但是fun2_1为什么不会被回收
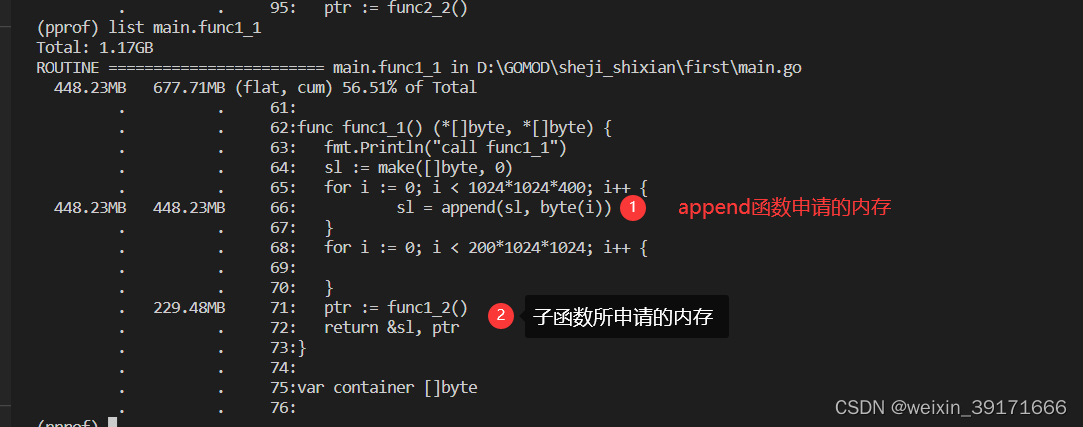
* 第二行表示:func1_1函数本身申请了448.23M内存,而加上子函数即func1_1函数内部调用的函数即func1_2共申请了677.7M内存
* 第三行表示:func1_2函数本身申请了229.48M内存,没有调用子函数,所以cum列上的值等于flat列上的值
* 第二行第三行的flat数加起来,其值正好等于第二行cum列的值
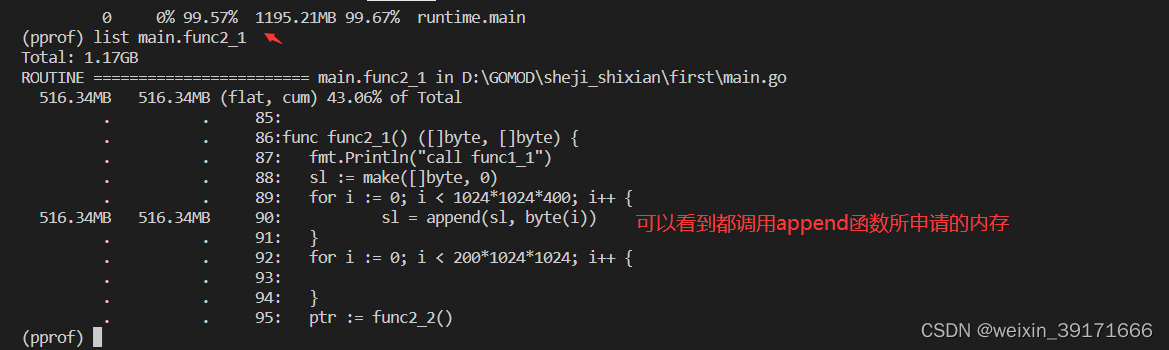
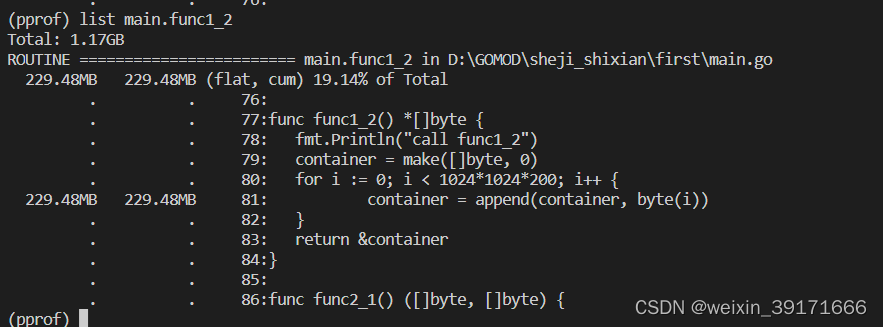
- 在交互模式下,输入list命令 + 函数名称可以进一步看到内存申请在函数中的具体位置:
如果函数名不明确,会进行模糊匹配,比如list main会列出main.main和runtime.main
如:
list main.func2_1
D:\GOMOD\sheji_shixian\first>go tool pprof memory1.prof
Type: inuse_space
Time: Mar 23, 2023 at 4:16pm (CST)
Entering interactive mode (type "help" for commands, "o" for options)
(pprof) top5
Showing nodes accounting for 1090.78MB, 99.53% of 1095.95MB total
Dropped 18 nodes (cum <= 5.48MB)
      flat  flat%   sum%        cum   cum%
  448.23MB 40.90% 40.90%   677.71MB 61.84%  main.func1_1
  413.07MB 37.69% 78.59%   413.07MB 37.69%  main.func2_1
  229.48MB 20.94% 99.53%   229.48MB 20.94%  main.func1_2
         0     0% 99.53%  1091.94MB 99.63%  main.main
         0     0% 99.53%  1092.44MB 99.68%  runtime.main
(pprof) list main
Total: 1.07GB
ROUTINE ======================== main.func1_1 in D:\GOMOD\sheji_shixian\first\main.go
  448.23MB   677.71MB (flat, cum) 61.84% of Total
         .          .     61:
         .          .     62:func func1_1() (*[]byte, *[]byte) {
         .          .     63:   fmt.Println("call func1_1")
         .          .     64:   sl := make([]byte, 0)
         .          .     65:   for i := 0; i < 1024*1024*400; i++ {
  448.23MB   448.23MB     66:           sl = append(sl, byte(i))
         .          .     67:   }
         .          .     68:   for i := 0; i < 200*1024*1024; i++ {
         .          .     69:
         .          .     70:   }
         .   229.48MB     71:   ptr := func1_2()
         .          .     72:   return &sl, ptr
         .          .     73:}
         .          .     74:
         .          .     75:var container []byte
         .          .     76:
ROUTINE ======================== main.func1_2 in D:\GOMOD\sheji_shixian\first\main.go
  229.48MB   229.48MB (flat, cum) 20.94% of Total
         .          .     76:
         .          .     77:func func1_2() *[]byte {
         .          .     78:   fmt.Println("call func1_2")
         .          .     79:   container = make([]byte, 0)
         .          .     80:   for i := 0; i < 1024*1024*200; i++ {
  229.48MB   229.48MB     81:           container = append(container, byte(i))
         .          .     82:   }
         .          .     83:   return &container
         .          .     84:}
         .          .     85:
         .          .     86:func func2_1() ([]byte, []byte) {
ROUTINE ======================== main.func2_1 in D:\GOMOD\sheji_shixian\first\main.go
  413.07MB   413.07MB (flat, cum) 37.69% of Total
         .          .     85:
         .          .     86:func func2_1() ([]byte, []byte) {
         .          .     87:   fmt.Println("call func1_1")
         .          .     88:   sl := make([]byte, 0)
         .          .     89:   for i := 0; i < 1024*1024*400; i++ {
  413.07MB   413.07MB     90:           sl = append(sl, byte(i))
         .          .     91:   }
         .          .     92:   for i := 0; i < 200*1024*1024; i++ {
         .          .     93:
         .          .     94:   }
         .          .     95:   ptr := func2_2()
ROUTINE ======================== main.main in D:\GOMOD\sheji_shixian\first\main.go
         0     1.07GB (flat, cum) 99.63% of Total
         .          .     22:           return
         .          .     23:   }
         .          .     24:   defer fc.Close()
         .          .     25:
         .          .     26:   // 开始分析cpu
         .     1.16MB     27:   err = pprof.StartCPUProfile(fc)
         .          .     28:   if err == nil {
         .          .     29:           defer pprof.StopCPUProfile()
         .          .     30:   }
         .          .     31:   // --- cpu 分析示例 end---
         .          .     32:
         .          .     33:   //业务逻辑代码写到WriteHeapProfile函数上面,可以看到业务逻辑代码消耗内存情况
         .   677.71MB     34:   ptr1, ptr2 := func1_1()
         .   413.07MB     35:   v1, v2 := func2_1()
         .          .     36:   fmt.Println(v1[0], v2[0])
         .          .     37:   fmt.Println((*ptr1)[0], (*ptr2)[0])
         .          .     38:
         .          .     39:   // --- 内存 分析示例 start---
         .          .     40:   fm, err := os.Create("./memory.prof")
ROUTINE ======================== runtime.main in D:\program\GO\src\runtime\proc.go
         0     1.07GB (flat, cum) 99.68% of Total
         .          .    228:           // a C-created thread and need to create a new thread.
         .          .    229:           startTemplateThread()
         .          .    230:           cgocall(_cgo_notify_runtime_init_done, nil)
         .          .    231:   }
         .          .    232:
         .   519.03kB    233:   doInit(&main_inittask)
         .          .    234:
         .          .    235:   // Disable init tracing after main init done to avoid overhead
         .          .    236:   // of collecting statistics in malloc and newproc
         .          .    237:   inittrace.active = false
         .          .    238:
         .          .    239:   close(main_init_done)
         .          .    240:
         .          .    241:   needUnlock = false
         .          .    242:   unlockOSThread()
         .          .    243:
         .          .    244:   if isarchive || islibrary {
         .          .    245:           // A program compiled with -buildmode=c-archive or c-shared
         .          .    246:           // has a main, but it is not executed.
         .          .    247:           return
         .          .    248:   }
         .          .    249:   fn := main_main // make an indirect call, as the linker doesn't know the address of the main package when laying down the runtime
         .     1.07GB    250:   fn()
         .          .    251:   if raceenabled {
         .          .    252:           racefini()
         .          .    253:   }
         .          .    254:
         .          .    255:   // Make racy client program work: if panicking on
(pprof)
- traces 打印所有调用栈,以及调用栈的指标信息。使用方式为traces+函数名(模糊匹配)
D:\GOMOD\sheji_shixian\first>go tool pprof memory1.prof
Type: inuse_space
Time: Mar 23, 2023 at 4:16pm (CST)
Entering interactive mode (type "help" for commands, "o" for options)
(pprof) top
Showing nodes accounting for 1090.78MB, 99.53% of 1095.95MB total
Dropped 18 nodes (cum <= 5.48MB)
      flat  flat%   sum%        cum   cum%
  448.23MB 40.90% 40.90%   677.71MB 61.84%  main.func1_1
  413.07MB 37.69% 78.59%   413.07MB 37.69%  main.func2_1
  229.48MB 20.94% 99.53%   229.48MB 20.94%  main.func1_2
         0     0% 99.53%  1091.94MB 99.63%  main.main
         0     0% 99.53%  1092.44MB 99.68%  runtime.main
(pprof) tarces main.func1_1
unrecognized command: "tarces"
(pprof) traces main.func1_1
Type: inuse_space
Time: Mar 23, 2023 at 4:16pm (CST)
-----------+-------------------------------------------------------
     bytes:  229.48MB
  229.48MB   main.func1_2
             main.func1_1
             main.main
             runtime.main
-----------+-------------------------------------------------------
     bytes:  183.59MB
         0   main.func1_2
             main.func1_1
             main.main
             runtime.main
-----------+-------------------------------------------------------
     bytes:  146.87MB
         0   main.func1_2
             main.func1_1
             main.main
             runtime.main
-----------+-------------------------------------------------------
     bytes:  117.49MB
         0   main.func1_2
             main.func1_1
             main.main
             runtime.main
-----------+-------------------------------------------------------
     bytes:  93.99MB
         0   main.func1_2
             main.func1_1
             main.main
             runtime.main
-----------+-------------------------------------------------------
     bytes:  75.19MB
         0   main.func1_2
             main.func1_1
             main.main
             runtime.main
-----------+-------------------------------------------------------
     bytes:  60.15MB
         0   main.func1_2
             main.func1_1
             main.main
             runtime.main
-----------+-------------------------------------------------------
     bytes:  48.12MB
         0   main.func1_2
             main.func1_1
             main.main
             runtime.main
-----------+-------------------------------------------------------
     bytes:  38.49MB
         0   main.func1_2
             main.func1_1
             main.main
             runtime.main
-----------+-------------------------------------------------------
     bytes:  30.79MB
         0   main.func1_2
             main.func1_1
             main.main
             runtime.main
-----------+-------------------------------------------------------
     bytes:  24.62MB
         0   main.func1_2
             main.func1_1
             main.main
             runtime.main
-----------+-------------------------------------------------------
     bytes:  19.70MB
         0   main.func1_2
             main.func1_1
             main.main
             runtime.main
-----------+-------------------------------------------------------
     bytes:  15.75MB
         0   main.func1_2
             main.func1_1
             main.main
             runtime.main
-----------+-------------------------------------------------------
     bytes:  12.59MB
         0   main.func1_2
             main.func1_1
             main.main
             runtime.main
-----------+-------------------------------------------------------
     bytes:  10.07MB
         0   main.func1_2
             main.func1_1
             main.main
             runtime.main
-----------+-------------------------------------------------------
     bytes:  8.05MB
         0   main.func1_2
             main.func1_1
             main.main
             runtime.main
-----------+-------------------------------------------------------
     bytes:  6.44MB
         0   main.func1_2
             main.func1_1
             main.main
             runtime.main
-----------+-------------------------------------------------------
     bytes:  5.15MB
         0   main.func1_2
             main.func1_1
             main.main
             runtime.main
-----------+-------------------------------------------------------
     bytes:  4.12MB
         0   main.func1_2
             main.func1_1
             main.main
             runtime.main
-----------+-------------------------------------------------------
     bytes:  2.62MB
         0   main.func1_2
             main.func1_1
             main.main
             runtime.main
-----------+-------------------------------------------------------
     bytes:  2.09MB
         0   main.func1_2
             main.func1_1
             main.main
             runtime.main
-----------+-------------------------------------------------------
     bytes:  1.67MB
         0   main.func1_2
             main.func1_1
             main.main
             runtime.main
-----------+-------------------------------------------------------
     bytes:  1.34MB
         0   main.func1_2
             main.func1_1
             main.main
             runtime.main
-----------+-------------------------------------------------------
     bytes:  1.06MB
         0   main.func1_2
             main.func1_1
             main.main
             runtime.main
-----------+-------------------------------------------------------
     bytes:  864kB
         0   main.func1_2
             main.func1_1
             main.main
             runtime.main
-----------+-------------------------------------------------------
     bytes:  432kB
         0   main.func1_2
             main.func1_1
             main.main
             runtime.main
-----------+-------------------------------------------------------
     bytes:  344kB
         0   main.func1_2
             main.func1_1
             main.main
             runtime.main
-----------+-------------------------------------------------------
     bytes:  128kB
         0   main.func1_2
             main.func1_1
             main.main
             runtime.main
-----------+-------------------------------------------------------
     bytes:  16kB
         0   main.func1_2
             main.func1_1
             main.main
             runtime.main
-----------+-------------------------------------------------------
     bytes:  448.23MB
  448.23MB   main.func1_1
             main.main
             runtime.main
-----------+-------------------------------------------------------
     bytes:  358.58MB
         0   main.func1_1
             main.main
             runtime.main
-----------+-------------------------------------------------------
     bytes:  286.86MB
         0   main.func1_1
             main.main
             runtime.main
-----------+-------------------------------------------------------
     bytes:  229.48MB
         0   main.func1_1
             main.main
             runtime.main
-----------+-------------------------------------------------------
     bytes:  183.59MB
         0   main.func1_1
             main.main
             runtime.main
-----------+-------------------------------------------------------
     bytes:  146.87MB
         0   main.func1_1
             main.main
             runtime.main
-----------+-------------------------------------------------------
     bytes:  117.49MB
         0   main.func1_1
             main.main
             runtime.main
-----------+-------------------------------------------------------
     bytes:  93.99MB
         0   main.func1_1
             main.main
             runtime.main
-----------+-------------------------------------------------------
     bytes:  75.19MB
         0   main.func1_1
             main.main
             runtime.main
-----------+-------------------------------------------------------
     bytes:  60.15MB
         0   main.func1_1
             main.main
             runtime.main
-----------+-------------------------------------------------------
     bytes:  48.12MB
         0   main.func1_1
             main.main
             runtime.main
-----------+-------------------------------------------------------
     bytes:  38.49MB
         0   main.func1_1
             main.main
             runtime.main
-----------+-------------------------------------------------------
     bytes:  30.79MB
         0   main.func1_1
             main.main
             runtime.main
-----------+-------------------------------------------------------
     bytes:  24.62MB
         0   main.func1_1
             main.main
             runtime.main
-----------+-------------------------------------------------------
     bytes:  19.70MB
         0   main.func1_1
             main.main
             runtime.main
-----------+-------------------------------------------------------
     bytes:  15.75MB
         0   main.func1_1
             main.main
             runtime.main
-----------+-------------------------------------------------------
     bytes:  12.59MB
         0   main.func1_1
             main.main
             runtime.main
-----------+-------------------------------------------------------
     bytes:  10.07MB
         0   main.func1_1
             main.main
             runtime.main
-----------+-------------------------------------------------------
     bytes:  8.05MB
         0   main.func1_1
             main.main
             runtime.main
-----------+-------------------------------------------------------
     bytes:  6.44MB
         0   main.func1_1
             main.main
             runtime.main
-----------+-------------------------------------------------------
     bytes:  5.15MB
         0   main.func1_1
             main.main
             runtime.main
-----------+-------------------------------------------------------
     bytes:  4.12MB
         0   main.func1_1
             main.main
             runtime.main
-----------+-------------------------------------------------------
     bytes:  3.29MB
         0   main.func1_1
             main.main
             runtime.main
-----------+-------------------------------------------------------
     bytes:  2.62MB
         0   main.func1_1
             main.main
             runtime.main
-----------+-------------------------------------------------------
     bytes:  2.09MB
         0   main.func1_1
             main.main
             runtime.main
-----------+-------------------------------------------------------
     bytes:  1.67MB
         0   main.func1_1
             main.main
             runtime.main
-----------+-------------------------------------------------------
     bytes:  1.34MB
         0   main.func1_1
             main.main
             runtime.main
-----------+-------------------------------------------------------
     bytes:  1.06MB
         0   main.func1_1
             main.main
             runtime.main
-----------+-------------------------------------------------------
     bytes:  544kB
         0   main.func1_1
             main.main
             runtime.main
-----------+-------------------------------------------------------
     bytes:  432kB
         0   main.func1_1
             main.main
             runtime.main
-----------+-------------------------------------------------------
     bytes:  344kB
         0   main.func1_1
             main.main
             runtime.main
-----------+-------------------------------------------------------
(pprof)
- 在命令行之中,还有一个重要的参数 -base,假设我们已经通过命令行得到profile1与profile2,使用go tool pprof -base profile1 profile2,便可以以profile1为基础,得出profile2在profile1之上出现了哪些变化。通过两个时间切片的比较,我们可以清晰的了解到,两个时间节点之中发生的变化,方便我们定位问题(很重要!!!!)
D:\GOMOD\sheji_shixian\first>go tool pprof -base memory.prof memory1.prof
Type: inuse_space
Time: Mar 23, 2023 at 4:36pm (CST)
Entering interactive mode (type "help" for commands, "o" for options)
(pprof) top
Showing nodes accounting for -1MB, 0.046% of 2190.88MB total
Showing top 10 nodes out of 11
      flat  flat%   sum%        cum   cum%
      -1MB 0.046% 0.046%       -1MB 0.046%  runtime.allocm
         0     0% 0.046%    -0.50MB 0.023%  runtime.mcall
         0     0% 0.046%    -0.50MB 0.023%  runtime.mstart
         0     0% 0.046%    -0.50MB 0.023%  runtime.mstart0
         0     0% 0.046%    -0.50MB 0.023%  runtime.mstart1
         0     0% 0.046%       -1MB 0.046%  runtime.newm
         0     0% 0.046%    -0.50MB 0.023%  runtime.park_m
         0     0% 0.046%       -1MB 0.046%  runtime.resetspinning
         0     0% 0.046%       -1MB 0.046%  runtime.schedule
         0     0% 0.046%       -1MB 0.046%  runtime.startm
(pprof) list runtime.allocm
Total: 2.14GB
ROUTINE ======================== runtime.allocm in D:\program\GO\src\runtime\proc.go
      -1MB       -1MB (flat, cum) 0.046% of Total
         .          .   1746:           }
         .          .   1747:           sched.freem = newList
         .          .   1748:           unlock(&sched.lock)
         .          .   1749:   }
         .          .   1750:
      -1MB       -1MB   1751:   mp := new(m)
         .          .   1752:   mp.mstartfn = fn
         .          .   1753:   mcommoninit(mp, id)
         .          .   1754:
         .          .   1755:   // In case of cgo or Solaris or illumos or Darwin, pthread_create will make us a stack.
         .          .   1756:   // Windows and Plan 9 will layout sched stack on OS stack.
(pprof)
web界面分析内存
再此之前,将代码复原为之前的代码!
//业务逻辑代码写到WriteHeapProfile函数上面,可以看到业务逻辑代码消耗内存情况
    ptr1, ptr2 := func1_1()
    v1, v2 := func2_1()
    fmt.Println(v1[0], v2[0])
    fmt.Println((*ptr1)[0], (*ptr2)[0])

    // --- 内存 分析示例 start---
    fm, err := os.Create("./memory.prof")
    if err != nil {
        fmt.Println("create memory.prof err:", err.Error())
        return
    }
    defer fm.Close()

    // 开始分析内存
    err = pprof.WriteHeapProfile(fm) //内存分析,不需要调用关闭之类的函数
    if err != nil {
        fmt.Println("write heap prof err:", err.Error())
        return
    }
    // --- 内存 分析示例 end---

    //将业务逻辑写在WriteHeapProfile下面,不知为什么看不到业务逻辑代码所占用内存情况
    // ptr1, ptr2 := func1_1()
    // fmt.Println((*ptr1)[0], (*ptr2)[0])
    // v1, v2 := func2_1()
    // fmt.Println(v1[0], v2[0])
运行源代码,先使用命令行查看一下分析结果,之后再使用命令
go tool pprof -http=:8888 ./memory.prof
进行web分析:
D:\GOMOD\sheji_shixian\first>go run .
call func1_1
call func1_2
call func1_1
call func1_2
0 0
0 0

D:\GOMOD\sheji_shixian\first>go tool pprof memory.prof
Type: inuse_space
Time: Mar 23, 2023 at 4:36pm (CST)
Entering interactive mode (type "help" for commands, "o" for options)
(pprof) top
Showing nodes accounting for 1090.78MB, 99.53% of 1095.94MB total
Dropped 20 nodes (cum <= 5.48MB)
      flat  flat%   sum%        cum   cum%
  448.23MB 40.90% 40.90%   677.71MB 61.84%  main.func1_1
  413.07MB 37.69% 78.59%   413.07MB 37.69%  main.func2_1
  229.48MB 20.94% 99.53%   229.48MB 20.94%  main.func1_2
         0     0% 99.53%  1091.94MB 99.63%  main.main
         0     0% 99.53%  1091.94MB 99.63%  runtime.main
(pprof)
D:\GOMOD\sheji_shixian\first>go tool pprof -http=:8888  ./memory.prof
Serving web UI on http://localhost:8888
打开页面就是这样的:
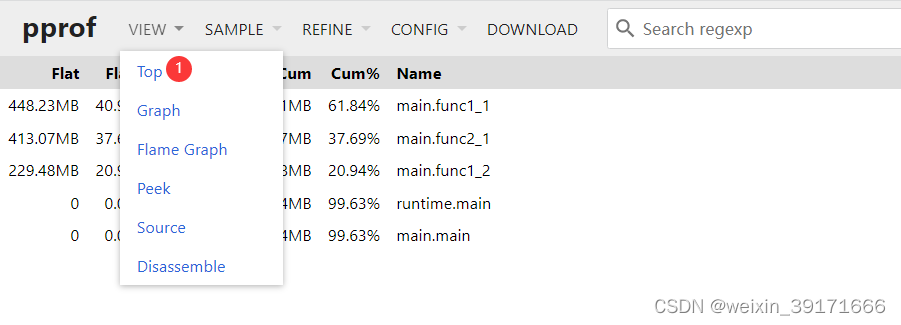
VIEW菜单栏(展现形式):
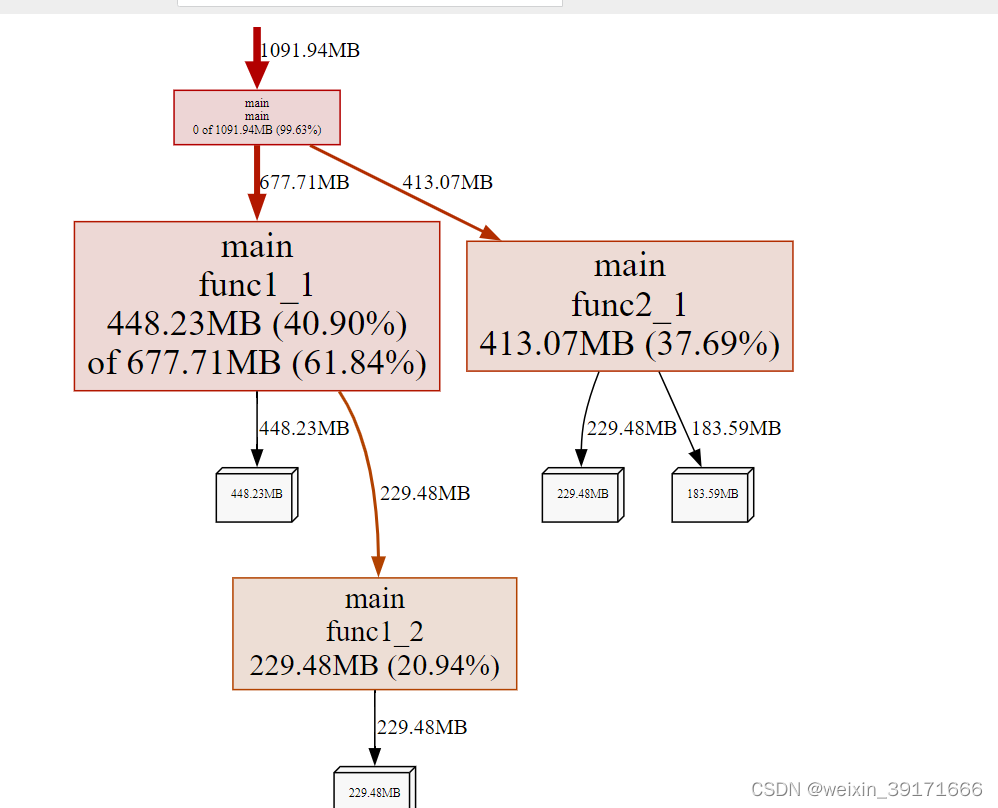
Graph(默认打开的就是这个):
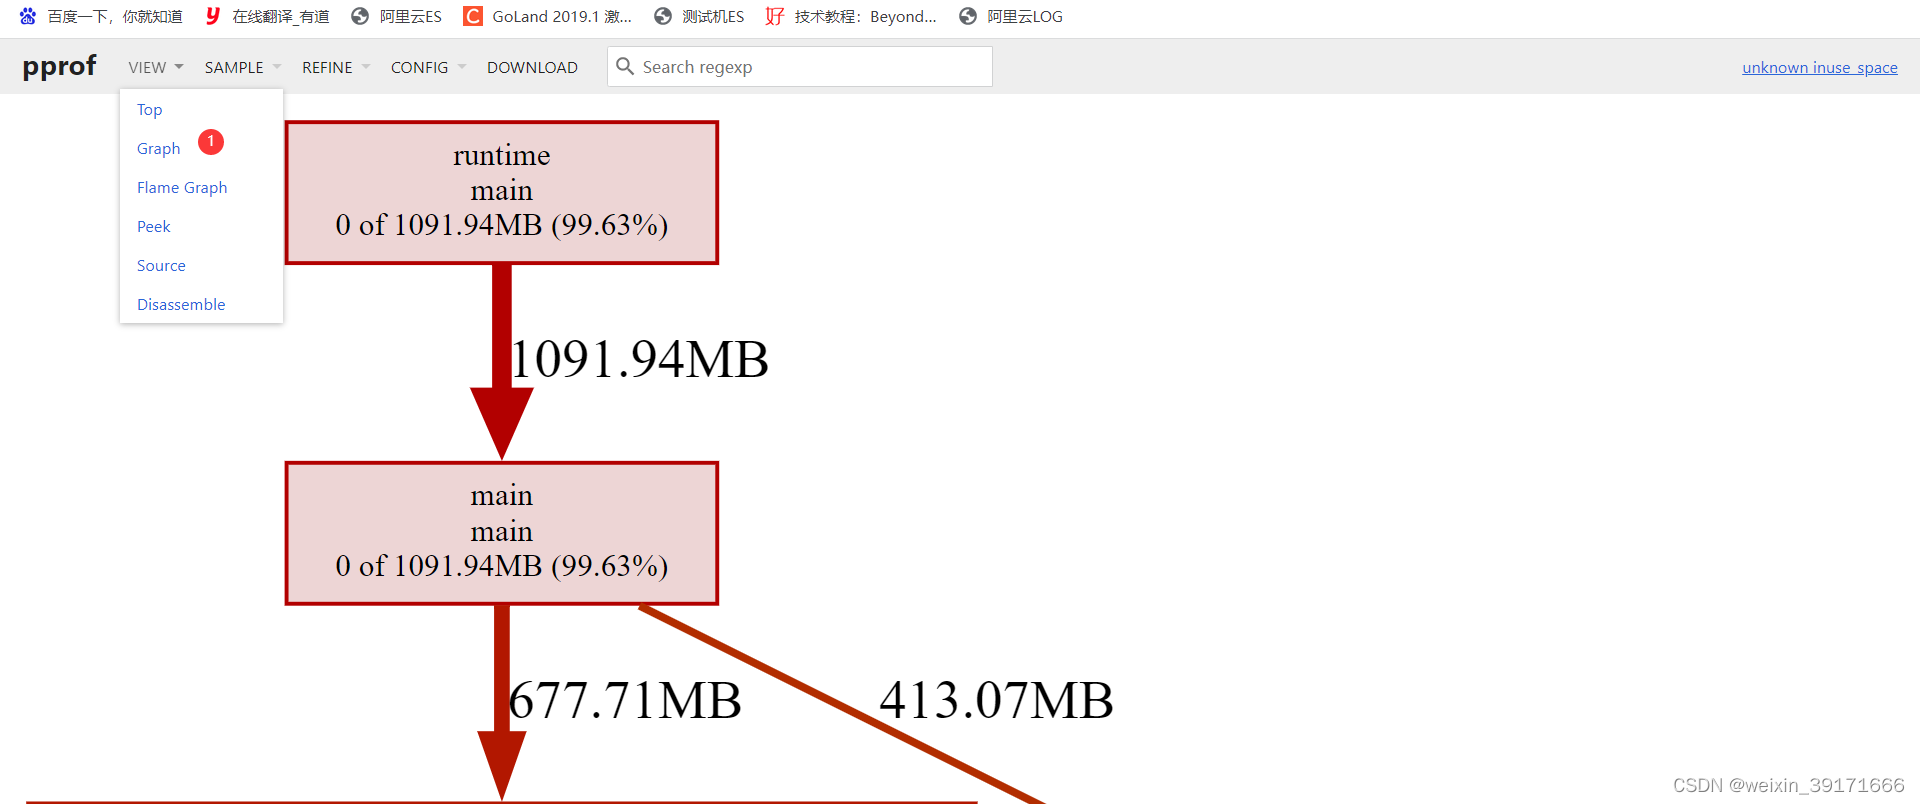
top:
火焰图:
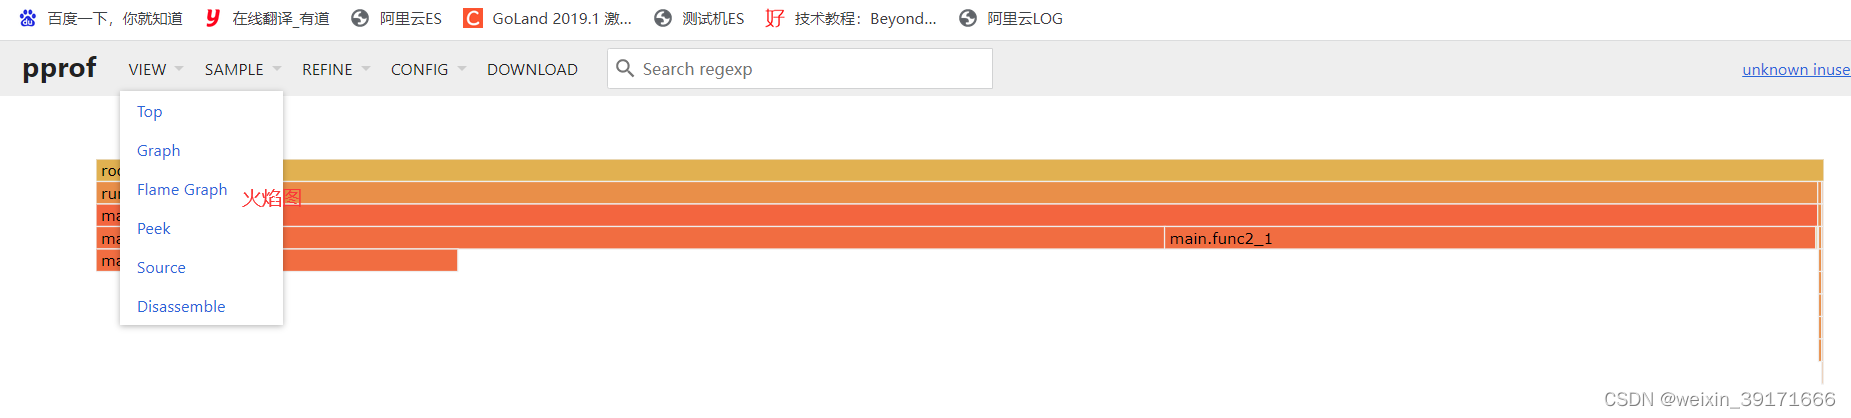
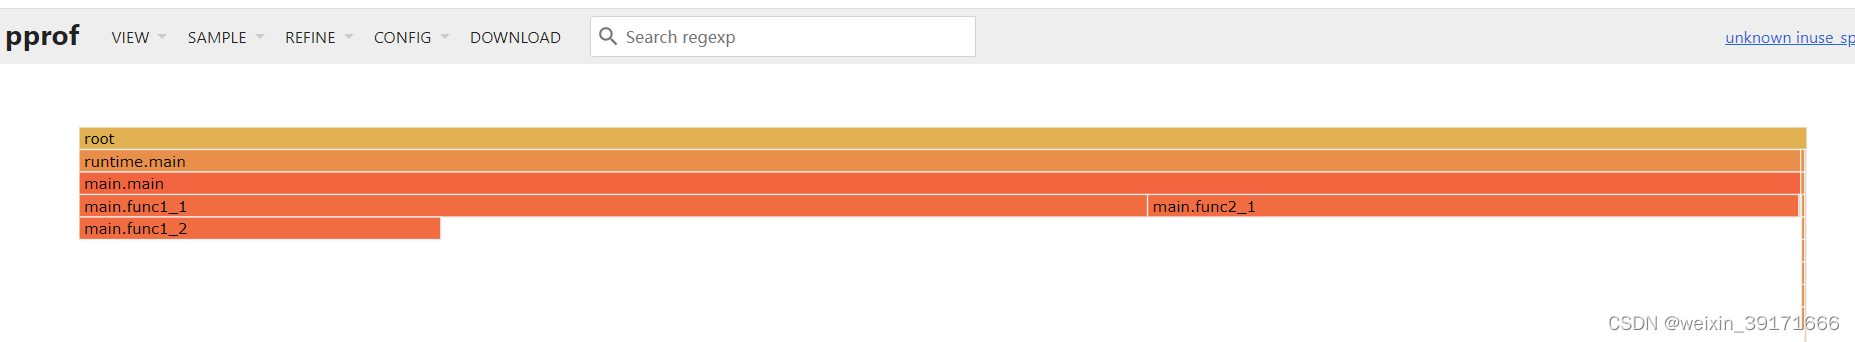
火焰图说明:
Y轴表示调用栈,每一层都是一个函数,调用栈越深火焰就越高,最底部是正在执行的函数,上面是它的父函数,X轴表示这个函数的抽样数,如果一个函数在X轴占的越宽,代表抽样数越高,执行CPU的时间越长(或者申请的内存更多),注意,X轴不代表时间,而是所有的调用栈合并后,按字母顺序排列的.
火焰图就是看顶层的哪个函数占据的宽度最大。只要有"平顶"(plateaus),就表示该函数可能存在性能问题!
如上面的火焰图,
- main.fun1_1和main.fun2_1都属于main函数下的,即他俩的父函数是main
- main.fun1_1的宽度要比fun2_1宽,因为fun1_1申请的内存更大!
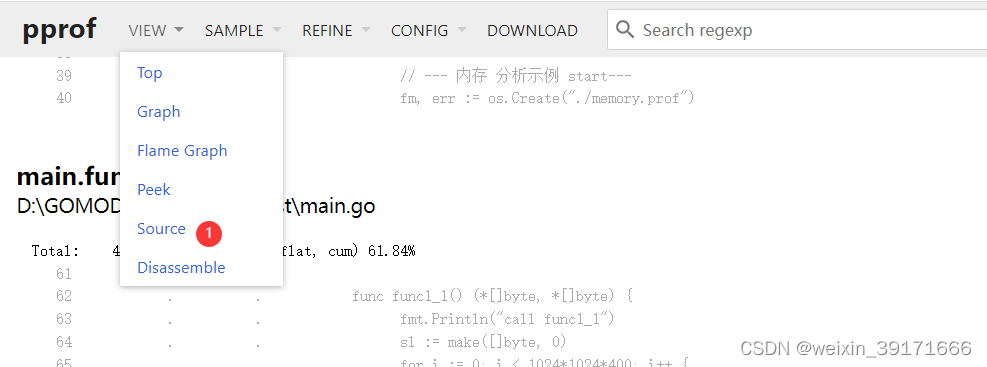
Source(其实就是命令行下的list命令)
SAMPLE(抽样)
VIEW和SAMPLE两个菜单是可以组合的,根据不同的抽样,不同的展现形式,有多种组合结果!
默认查看的是抽样为:inuse_space,展现形式为:Graph的结果

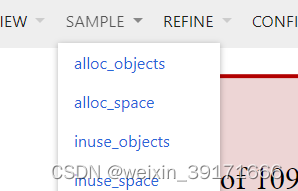
alloc_objects,alloc_space表示应用程序分配过的资源,不管有没有释放,inuse_objects,inuse_space表示应用程序的还未释放的资源常配情况。
inuse_space :已分配且尚未释放的内存量
inuse_objects :已分配且尚未释放的对象数量(个人理解为为多少对象分配的内存,比如append扩容的时候,需要重新定义变量,为变量分配内存。这个定义的变量数就是objects,分配的内存多少就是space)
alloc_space :已分配的内存总量(无论释放与否)
alloc_objects :已分配对象的总数(不管是否已释放)
tips:
* 程序运行占用较大的内存,可以通过 inuse_space 来体现.
* 存在非常频繁的 GC 活动,通常意味着 alloc_space非常高,而程序运行过程中并没有消耗太多的内存(体现为 inuse_space 并不高),当然也可能出现 GC 来不及回收,因此c出现inuse_space 也变高的情况。这种情况下同样会大量消耗CPU。
* 内存泄漏,通常 alloc_space 较高,且inuse_space 也较高。
意思更加明确:
- inuse:当前的(这一次采集)内存或对象的分配。当我们要进行采集,并且分析本次采集数据时,使用inuse_*抽样策略
- alloc:从程序运行到现在所有的内存分配,不管是否已经被 gc 过了。当我们不进行采集,而想查看从程序启动到现在的秦广,使用alloc_*抽样策略
REFINE:主要是依据右边的 Search regexp 输入框对 SAMPLE 做一些结果筛选分析
- Focus:聚焦在选中元素的上下游元素
- Ignore:忽略选中当元素,包含其后继元素
- Hide:隐藏选中当元素,但不会隐藏其后继元素
- Show:只显示选中的元素,不包含后继元素
- Show from:从选中当某一个元素开始,只列出其后继元素
CONFIG:能将当前已精细化的页面保存起来
(常驻进程)服务型应用(net/http/pprof )
对于服务类型的应用,主要在服务内部匿名引入net/http/pprof包,然后通过HTTP访问pprof页面。
匿名引入方式为:import _ “net/http/pprof”
基本使用
/*
 * @Description:
 * @version:
 * @Author: Steven
 * @Date: 2023-03-17 14:19:57
 */
package main

import (
    "fmt"
    "net/http"
    _ "net/http/pprof"
)

func main() {
    http.HandleFunc("/", hello)
    err := http.ListenAndServe("127.0.0.1:8080", nil)
    if err != nil {
        fmt.Println("ListenAndServe Err:", err.Error())
        return
    }
}

func hello(resp http.ResponseWriter, req *http.Request) {
    fmt.Fprintln(resp, "Hello World, Are You OK?")
}
D:\GOMOD\sheji_shixian\first>go run main.go
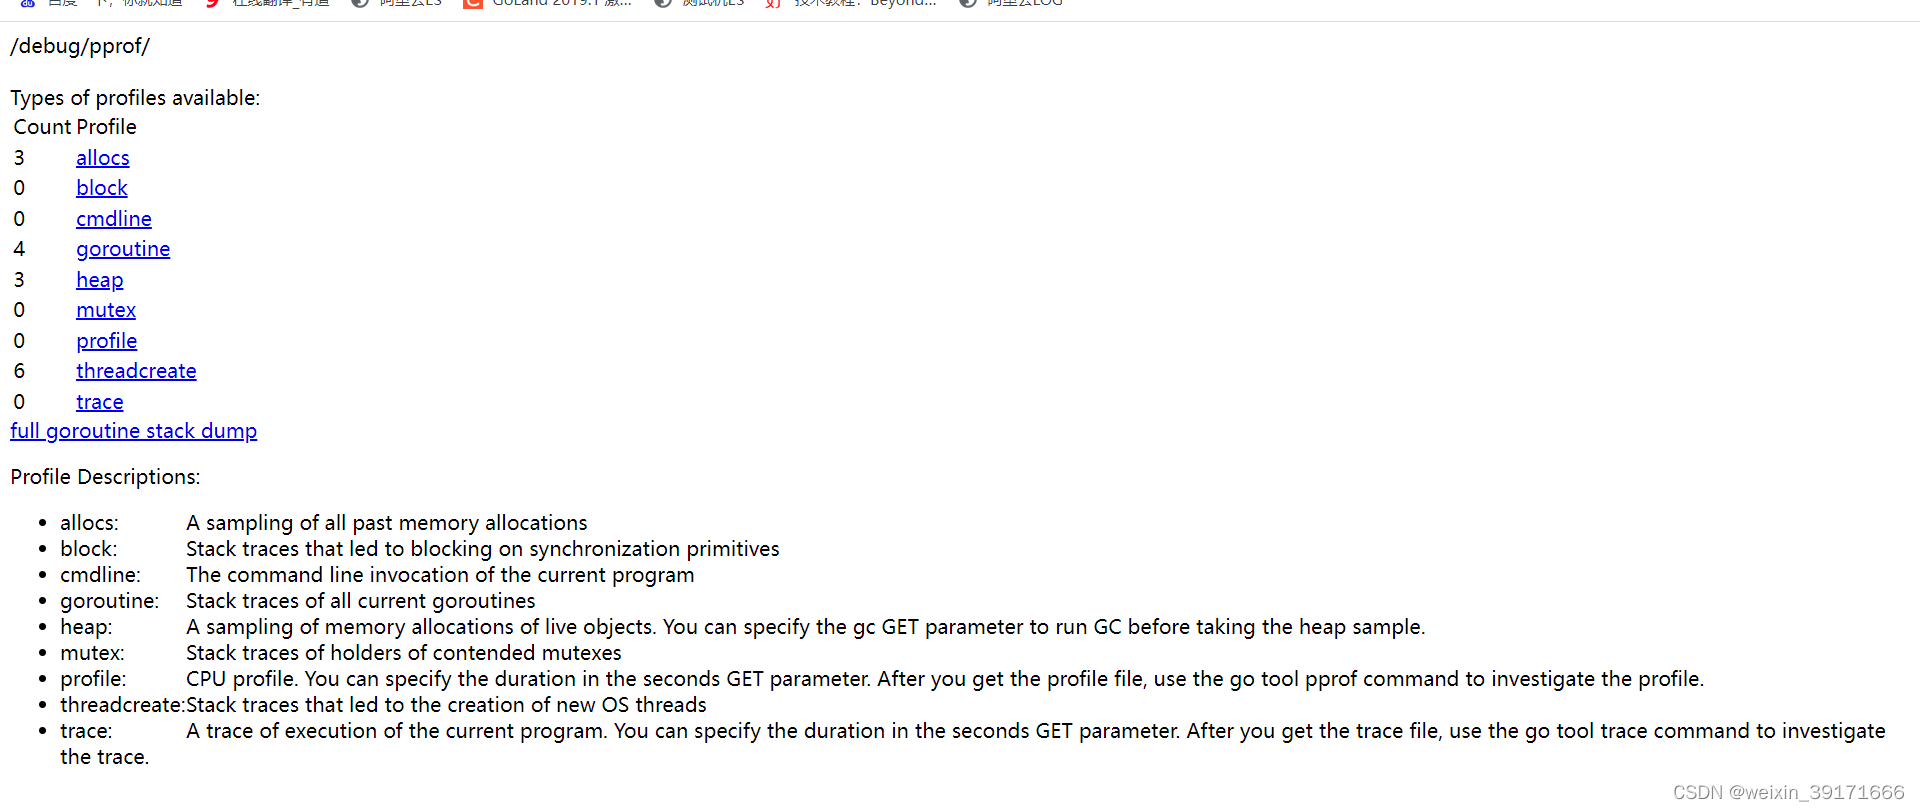
http://localhost:8080/debug/pprof/
自定义服务的话就得自己来注册路由
因为net/http/pprof包中,有init函数,是基于默认服务器而注册的路由
func init() {
    http.HandleFunc("/debug/pprof/", Index)
    http.HandleFunc("/debug/pprof/cmdline", Cmdline)
    http.HandleFunc("/debug/pprof/profile", Profile)
    http.HandleFunc("/debug/pprof/symbol", Symbol)
    http.HandleFunc("/debug/pprof/trace", Trace)
}
func HandleFunc(pattern string, handler func(ResponseWriter, *Request)) {
    DefaultServeMux.HandleFunc(pattern, handler)
}
自己来注册:
    mux := http.NewServeMux()
// 自己注册这几个函数
mux.HandleFunc("/debug/pprof/", pprof.Index)
mux.HandleFunc("/debug/pprof/cmdline", pprof.Cmdline)
mux.HandleFunc("/debug/pprof/profile", pprof.Profile)
mux.HandleFunc("/debug/pprof/symbol", pprof.Symbol)
mux.HandleFunc("/debug/pprof/trace", pprof.Trace)
生产环境中更加常用的形式
通过协程另起一个HTTP服务,单独用作pprof分析:
func RegisterProf() {
    go func() {
        if err := http.ListenAndServe(":6060", nil); err != nil {
            panic("pprof server start error: " + err.Error())
        }
    }()
}
/*
 * @Description:
 * @version:
 * @Author: Steven
 * @Date: 2023-03-17 14:19:57
 */
package main

import (
    "fmt"
    "net/http"
    _ "net/http/pprof"
)

func main() {
    RegisterProf()
    http.HandleFunc("/", hello)
    fmt.Println("server start")
    err := http.ListenAndServe("127.0.0.1:8080", nil)
    if err != nil {
        fmt.Println("ListenAndServe Err:", err.Error())
        return
    }

}

func hello(resp http.ResponseWriter, req *http.Request) {
    fmt.Fprintln(resp, "Hello World, Are You OK?")
}

func RegisterProf() {
    go func() {
        defer func() {
            if err := recover(); err != nil {
                fmt.Println(err)
            }
        }()
        fmt.Println("pprof server start")
        if err := http.ListenAndServe("127.0.0.1:6060", nil); err != nil {
            panic("pprof server start error: " + err.Error()) //这个panic,主协程是捕获不到的
        }

    }()
}
服务运行成功之后:我们就可以通过6060端口来进行性能分析了!

CPU消耗情况
(不方便)浏览器执行:
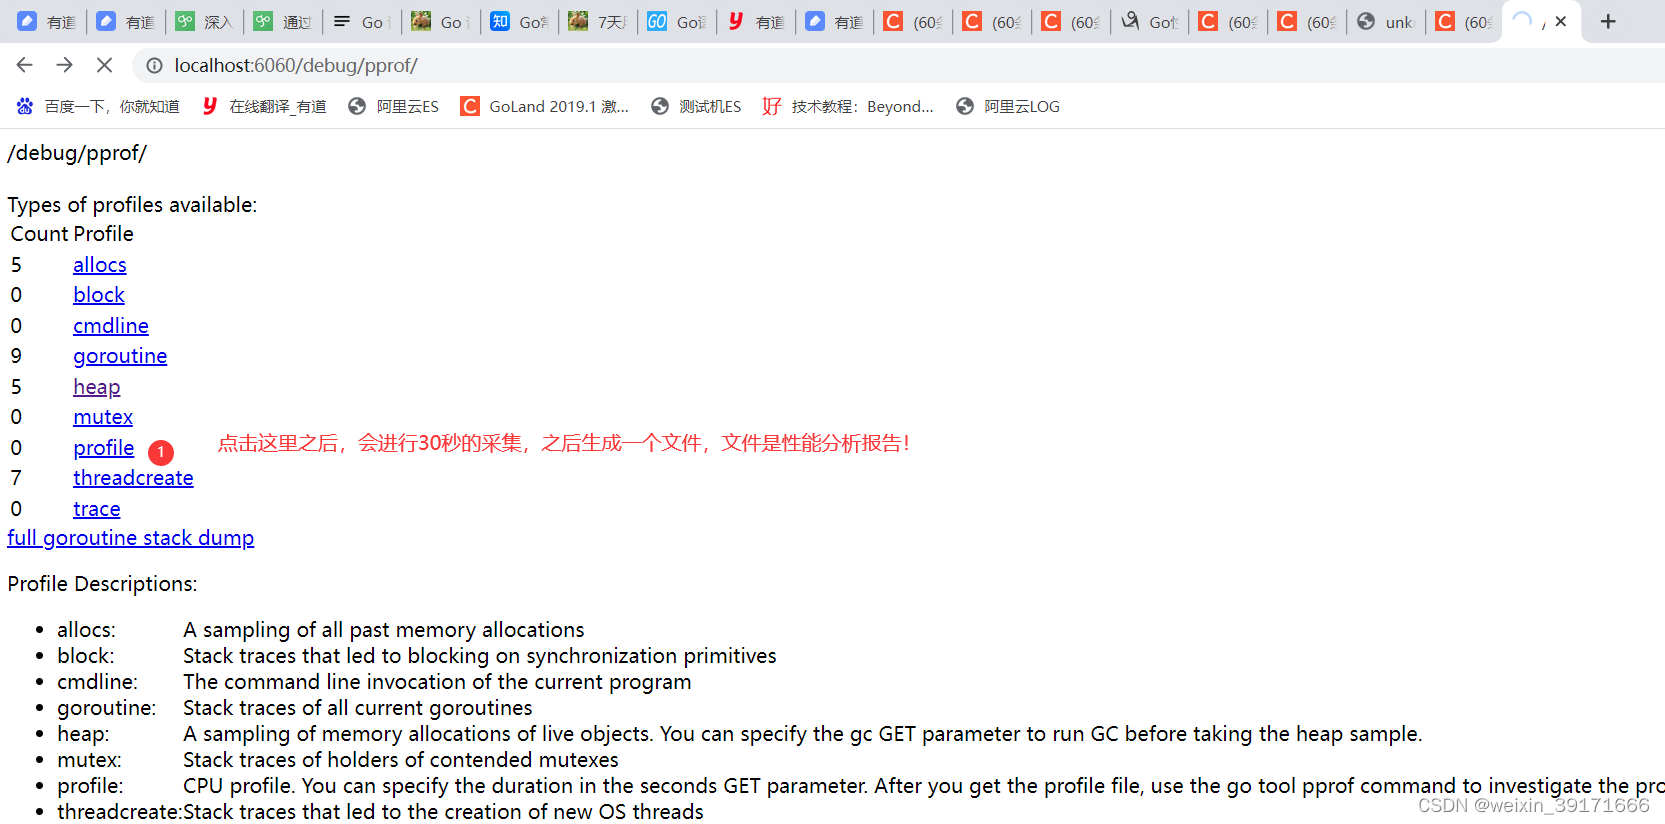
浏览器访问/debug/pprof/profile会自动进行 CPU profiling,默认持续 30s,并生成一个文件供下载,可以通过带参数?seconds=60进行60秒的数据采集。
在采集的过程中必须有请求,如果没有请求,就采集不出数据的!

很明显,通过浏览器
执行下载的文件,咱们还得通过命令行去分析,完了还得找到下载文件的路径!所以很不方便!
命令行执行:
首先得模拟请求:我们进行ab压力测试!
更改源代码:
/*
 * @Description:
 * @version:
 * @Author: Steven
 * @Date: 2023-03-17 14:19:57
 */
package main

import (
    "fmt"
    "net/http"
    _ "net/http/pprof"
)

func main() {
    RegisterProf()
    http.HandleFunc("/", hello)
    fmt.Println("server start")
    err := http.ListenAndServe("127.0.0.1:8080", nil)
    if err != nil {
        fmt.Println("ListenAndServe Err:", err.Error())
        return
    }

}

func hello(resp http.ResponseWriter, req *http.Request) {
    sl := make([]int, 0)
    for i := 0; i < 1024*1024*100; i++ {
        sl = append(sl, i)
    }
    fmt.Fprintln(resp, "Hello World, Are You OK?")
}

func RegisterProf() {
    go func() {
        defer func() {
            if err := recover(); err != nil {
                fmt.Println(err)
            }
        }()
        fmt.Println("pprof server start")
        if err := http.ListenAndServe("127.0.0.1:6060", nil); err != nil {
            panic("pprof server start error: " + err.Error()) //这个panic,主协程是捕获不到的
        }

    }()
}
开启一个终端,进行压测!
D:\GOMOD\sheji_shixian\first>ab -k -c 1 -t 180 -n 10000000 http://localhost:8080/hello
This is ApacheBench, Version 2.3 <$Revision: 1903618 $>
Copyright 1996 Adam Twiss, Zeus Technology Ltd, http://www.zeustech.net/
Licensed to The Apache Software Foundation, http://www.apache.org/

Benchmarking localhost (be patient)
Finished 218 requests


Server Software:
Server Hostname:        localhost
Server Port:            8080

Document Path:          /hello
Document Length:        25 bytes

Concurrency Level:      1
Time taken for tests:   180.128 seconds
Complete requests:      218
Failed requests:        0
Keep-Alive requests:    218
Total transferred:      36188 bytes
HTML transferred:       5450 bytes
Requests per second:    1.21 [#/sec] (mean)
Time per request:       826.277 [ms] (mean)
Time per request:       826.277 [ms] (mean, across all concurrent requests)
Transfer rate:          0.20 [Kbytes/sec] received

Connection Times (ms)
              min  mean[+/-sd] median   max
Connect:        0    0   0.0      0       0
Processing:   534  817 2034.3    591   26997
Waiting:      534  817 2034.3    591   26997
Total:        534  817 2034.3    591   26997

Percentage of the requests served within a certain time (ms)
  50%    591
  66%    615
  75%    637
  80%    649
  90%    695
  95%    751
  98%   1697
  99%   3713
 100%  26997 (longest request)
压测的同时:我们另开终端,进行性能数据采集!
默认30秒采集的终端:
D:\GOMOD\sheji_shixian\first>go tool pprof http://localhost:8080/debug/pprof/profile
Fetching profile over HTTP from http://localhost:8080/debug/pprof/profile
Saved profile in C:\Users\szl32\pprof\pprof.samples.cpu.006.pb.gz
Type: cpu
Time: Mar 23, 2023 at 6:57pm (CST)
Duration: 30.15s, Total samples = 46.50s (154.24%)
Entering interactive mode (type "help" for commands, "o" for options)
(pprof) top
Showing nodes accounting for 44.56s, 95.83% of 46.50s total
Dropped 152 nodes (cum <= 0.23s)
Showing top 10 nodes out of 38
      flat  flat%   sum%        cum   cum%
    21.52s 46.28% 46.28%     21.52s 46.28%  runtime.memmove
    12.68s 27.27% 73.55%     12.68s 27.27%  runtime.procyield
        5s 10.75% 84.30%     29.74s 63.96%  main.hello
     2.75s  5.91% 90.22%      2.75s  5.91%  runtime.memclrNoHeapPointers
     0.62s  1.33% 91.55%      0.63s  1.35%  runtime.markrootSpans
     0.57s  1.23% 92.77%      0.57s  1.23%  runtime.stdcall2
     0.54s  1.16% 93.94%      0.54s  1.16%  runtime.stdcall3
     0.34s  0.73% 94.67%     13.61s 29.27%  runtime.suspendG
     0.30s  0.65% 95.31%      0.31s  0.67%  runtime.stdcall1
     0.24s  0.52% 95.83%      0.24s  0.52%  runtime.stdcall7
(pprof)
采集60秒的终端:
D:\GOMOD\sheji_shixian\first>go tool pprof http://localhost:8080/debug/pprof/profile?seconds=60
Fetching profile over HTTP from http://localhost:8080/debug/pprof/profile?seconds=60
Saved profile in C:\Users\szl32\pprof\pprof.samples.cpu.007.pb.gz
Type: cpu
Time: Mar 23, 2023 at 6:58pm (CST)
Duration: 60s, Total samples = 40.97s (68.28%)
Entering interactive mode (type "help" for commands, "o" for options)
(pprof) top
Showing nodes accounting for 39.09s, 95.41% of 40.97s total
Dropped 154 nodes (cum <= 0.20s)
Showing top 10 nodes out of 37
flat flat% sum% cum cum%
18.20s 44.42% 44.42% 18.20s 44.42% runtime.memmove
10.85s 26.48% 70.91% 10.85s 26.48% runtime.procyield
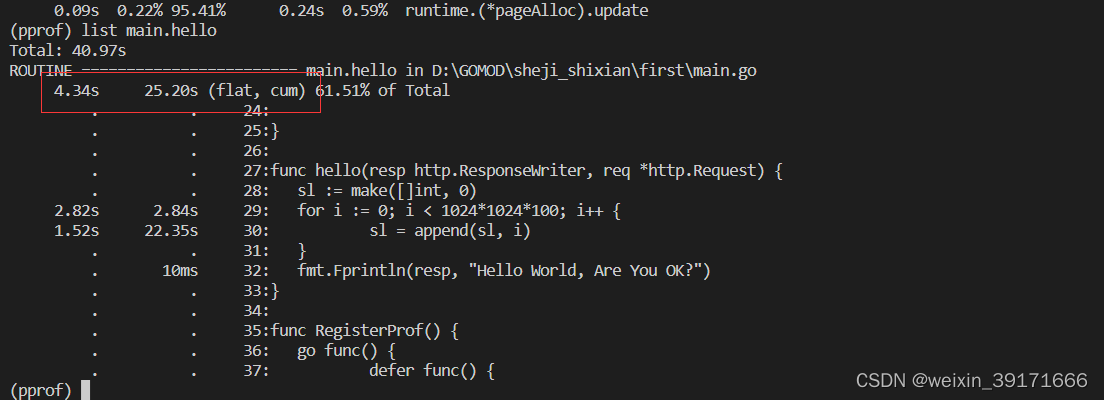
4.34s 10.59% 81.50% 25.20s 61.51% main.hello
2.33s 5.69% 87.19% 2.33s 5.69% runtime.memclrNoHeapPointers
2.15s 5.25% 92.43% 2.15s 5.25% runtime.stdcall3
0.39s 0.95% 93.39% 0.39s 0.95% runtime.markrootSpans
0.32s 0.78% 94.17% 0.32s 0.78% runtime.stdcall2
0.23s 0.56% 94.73% 11.48s 28.02% runtime.suspendG
0.19s 0.46% 95.19% 0.32s 0.78% runtime.scanobject
0.09s 0.22% 95.41% 0.24s 0.59% runtime.(*pageAlloc).update
(pprof)
每一行表示一个函数的信息,列信息字段解释:
flat:函数在 CPU 上运行的时间
flat%:函数在CPU上运行时间的百分比
sum%:是从第一行到当前行所有函数累加使用 CPU 的比例,如第二行sum=53.85=30.77+23.08
cum:这个函数以及子函数运行所占用的时间,应该大于等于flat
cum%:这个函数以及子函数运行所占用的比例,应该大于等于flat%
最后一列:函数的名字
web指令生成图示
在交互模式下输入 web,会自动生成一个 svg 文件,并跳转到浏览器打开

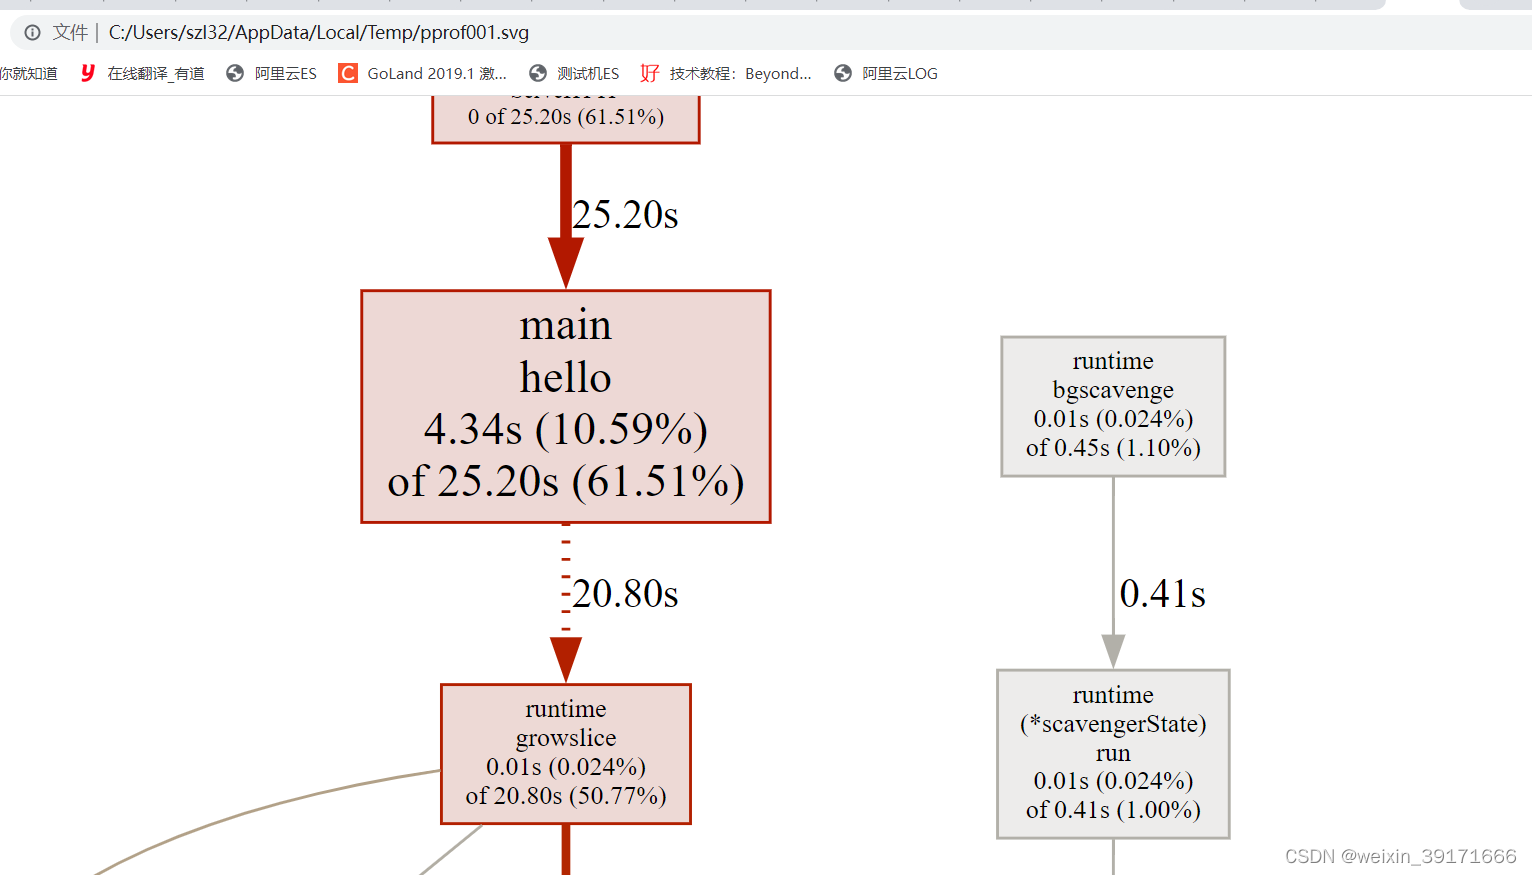
以main hello为例:
指向main hello 方框的箭头上的25.20s表示hello函数总共的执行时间,包含自身和下游所有子节点;
方框中的4.34s表示自身的执行时间;
方框中的10.59%表示自身执行时间在该函数总共执行时间的占比在总时间中的占比:2.70 = (4.34/25.20)*61.51%
方框中的61.51%表示总时间占比,即整个程序耗时占比。
list指令分析函数
指定分析策略
有两种内存分析策略:一种是当前的(这一次采集)内存或对象的分配,称为 inuse;另一种是从程序运行到现在所有的内存分配,不管是否已经被 gc 过了,称为 alloc。
- inuse_space :已分配且尚未释放的内存量
- inuse_objects :已分配且尚未释放的对象数量
- alloc_space :已分配的内存总量(无论释放与否)
- alloc_objects :已分配对象的总数(不管是否已释放)
默认是:inuse_space
内存分配分析
- 分析当前采集已分配并且还没释放的内存结果:
go tool pprof  http://localhost:8080/debug/pprof/heap
=
go tool pprof -inuse_space http://localhost:8080/debug/pprof/heap
D:\GOMOD\sheji_shixian>go tool pprof  http://localhost:8080/debug/pprof/heap
Fetching profile over HTTP from http://localhost:8080/debug/pprof/heap
Saved profile in C:\Users\szl32\pprof\pprof.alloc_objects.alloc_space.inuse_objects.inuse_space.008.pb.gz
Type: inuse_space
Time: Mar 23, 2023 at 9:22pm (CST)
Entering interactive mode (type "help" for commands, "o" for options)
(pprof) top
Showing nodes accounting for 1008.52MB, 99.70% of 1011.52MB total
Dropped 15 nodes (cum <= 5.06MB)
      flat  flat%   sum%        cum   cum%
 1008.52MB 99.70% 99.70%  1008.52MB 99.70%  main.hello
         0     0% 99.70%  1008.52MB 99.70%  net/http.(*ServeMux).ServeHTTP
         0     0% 99.70%  1008.52MB 99.70%  net/http.(*conn).serve
         0     0% 99.70%  1008.52MB 99.70%  net/http.HandlerFunc.ServeHTTP
         0     0% 99.70%  1008.52MB 99.70%  net/http.serverHandler.ServeHTTP
D:\GOMOD\sheji_shixian\first>go tool pprof -inuse_space http://localhost:8080/debug/pprof/heap
Fetching profile over HTTP from http://localhost:8080/debug/pprof/heap
Saved profile in C:\Users\szl32\pprof\pprof.alloc_objects.alloc_space.inuse_objects.inuse_space.009.pb.gz
Type: inuse_space
Time: Mar 23, 2023 at 9:22pm (CST)
Entering interactive mode (type "help" for commands, "o" for options)
(pprof) top
Showing nodes accounting for 806.80MB, 99.63% of 809.81MB total
Dropped 15 nodes (cum <= 4.05MB)
      flat  flat%   sum%        cum   cum%
  806.80MB 99.63% 99.63%   806.80MB 99.63%  main.hello
         0     0% 99.63%   806.80MB 99.63%  net/http.(*ServeMux).ServeHTTP
         0     0% 99.63%   806.80MB 99.63%  net/http.(*conn).serve
         0     0% 99.63%   806.80MB 99.63%  net/http.HandlerFunc.ServeHTTP
         0     0% 99.63%   806.80MB 99.63%  net/http.serverHandler.ServeHTTP
使用list进一步查看,发现都是append函数产生的大量内存消耗!

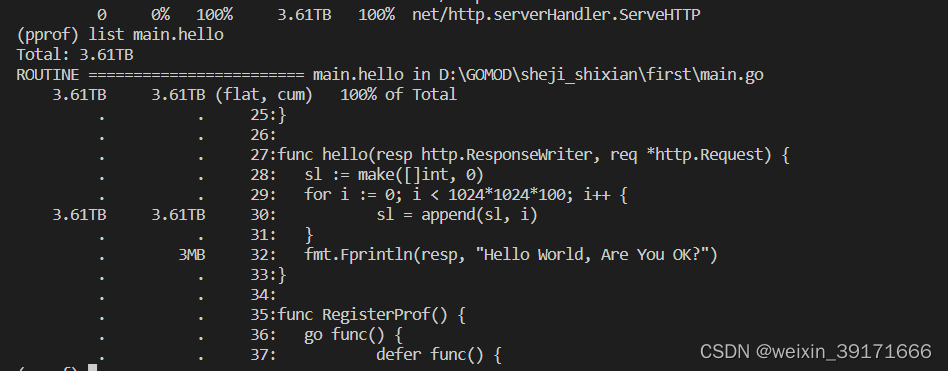
- 从程序运行到目前,内存消耗情况:发现main.hello已经消耗了内存3.61T
D:\GOMOD\sheji_shixian\first>go tool pprof -alloc_space http://localhost:8080/debug/pprof/heap
Fetching profile over HTTP from http://localhost:8080/debug/pprof/heap
Saved profile in C:\Users\szl32\pprof\pprof.alloc_objects.alloc_space.inuse_objects.inuse_space.014.pb.gz
Type: alloc_space
Time: Mar 23, 2023 at 9:29pm (CST)
Entering interactive mode (type "help" for commands, "o" for options)
(pprof) top
Showing nodes accounting for 3.61TB, 100% of 3.61TB total
Dropped 79 nodes (cum <= 0.02TB)
      flat  flat%   sum%        cum   cum%
    3.61TB   100%   100%     3.61TB   100%  main.hello
         0     0%   100%     3.61TB   100%  net/http.(*ServeMux).ServeHTTP
         0     0%   100%     3.61TB   100%  net/http.(*conn).serve
         0     0%   100%     3.61TB   100%  net/http.HandlerFunc.ServeHTTP
         0     0%   100%     3.61TB   100%  net/http.serverHandler.ServeHTTP
发现也都是appen函数扩容导致的:
我们来看一下切片append操作预分配内存的性能提升
不预分配:
func hello(resp http.ResponseWriter, req *http.Request) {
    sl := make([]byte, 0)//不进行预分配
    for i := 0; i < 1024*1024*100; i++ {
        sl = append(sl, byte(i))
    }
    fmt.Fprintln(resp, "Hello World, Are You OK?")
}
进行压测,压测完,来查看alloc的数据,即从服务开启到压测结束,消耗的内存数据!
压测:
D:\GOMOD\sheji_shixian\first>ab -k -c 1 -t 180 -n 1000 http://localhost:8080/hello
This is ApacheBench, Version 2.3 <$Revision: 1903618 $>
Copyright 1996 Adam Twiss, Zeus Technology Ltd, http://www.zeustech.net/
Licensed to The Apache Software Foundation, http://www.apache.org/

Benchmarking localhost (be patient)
Completed 100 requests
Completed 200 requests
Completed 300 requests
Completed 400 requests
Completed 500 requests
Completed 600 requests
Completed 700 requests
Completed 800 requests
Completed 900 requests
Completed 1000 requests
Finished 1000 requests


Server Software:
Server Hostname:        localhost
Server Port:            8080

Document Path:          /hello
Document Length:        25 bytes

Concurrency Level:      1
Time taken for tests:   163.658 seconds
Complete requests:      1000
Failed requests:        0
Keep-Alive requests:    1000
Total transferred:      166000 bytes
HTML transferred:       25000 bytes
Requests per second:    6.11 [#/sec] (mean)
Time per request:       163.658 [ms] (mean)
Time per request:       163.658 [ms] (mean, across all concurrent requests)
Transfer rate:          0.99 [Kbytes/sec] received

Connection Times (ms)
              min  mean[+/-sd] median   max
Connect:        0    0   0.0      0       1
Processing:   137  162  17.2    158     399
Waiting:      137  162  17.2    158     399
Total:        137  162  17.2    158     399

Percentage of the requests served within a certain time (ms)
  50%    158
  66%    162
  75%    167
  80%    170
  90%    180
  95%    189
  98%    213
  99%    232
 100%    399 (longest request)

D:\GOMOD\sheji_shixian\first>
alloc_space:先来查看内存分配情况:
D:\GOMOD\sheji_shixian>go tool pprof -alloc_space http://localhost:8080/debug/pprof/heap
Fetching profile over HTTP from http://localhost:8080/debug/pprof/heap
Saved profile in C:\Users\szl32\pprof\pprof.alloc_objects.alloc_space.inuse_objects.inuse_space.031.pb.gz
Type: alloc_space
Time: Mar 23, 2023 at 9:51pm (CST)
Entering interactive mode (type "help" for commands, "o" for options)
(pprof) top
Showing nodes accounting for 572.71GB, 100% of 572.72GB total
Dropped 66 nodes (cum <= 2.86GB)
      flat  flat%   sum%        cum   cum%
  572.71GB   100%   100%   572.71GB   100%  main.hello
         0     0%   100%   572.71GB   100%  net/http.(*ServeMux).ServeHTTP
         0     0%   100%   572.71GB   100%  net/http.(*conn).serve
         0     0%   100%   572.71GB   100%  net/http.HandlerFunc.ServeHTTP
         0     0%   100%   572.71GB   100%  net/http.serverHandler.ServeHTTP
(pprof) list main.hello
Total: 572.72GB
ROUTINE ======================== main.hello in D:\GOMOD\sheji_shixian\first\main.go
  572.71GB   572.71GB (flat, cum)   100% of Total
         .          .     25:}
         .          .     26:
         .          .     27:func hello(resp http.ResponseWriter, req *http.Request) {
         .          .     28:   sl := make([]byte, 0)
         .          .     29:   for i := 0; i < 1024*1024*100; i++ {
  572.71GB   572.71GB     30:           sl = append(sl, byte(i))
         .          .     31:   }
         .   512.50kB     32:   fmt.Fprintln(resp, "Hello World, Are You OK?")
         .          .     33:}
         .          .     34:
         .          .     35:func RegisterProf() {
         .          .     36:   go func() {
         .          .     37:           defer func() {
(pprof)
alloc_objects:再查看分配对象情况
D:\GOMOD\sheji_shixian\first>go tool pprof -alloc_objects http://localhost:8080/debug/pprof/heap
Fetching profile over HTTP from http://localhost:8080/debug/pprof/heap
Saved profile in C:\Users\szl32\pprof\pprof.alloc_objects.alloc_space.inuse_objects.inuse_space.032.pb.gz
Type: alloc_objects
Time: Mar 23, 2023 at 9:52pm (CST)
Entering interactive mode (type "help" for commands, "o" for options)
(pprof) top
Showing nodes accounting for 188814, 99.51% of 189737 total
Dropped 15 nodes (cum <= 948)
Showing top 10 nodes out of 56
      flat  flat%   sum%        cum   cum%
     65536 34.54% 34.54%      65536 34.54%  runtime.doaddtimer
     54826 28.90% 63.44%      55338 29.17%  main.hello
     32768 17.27% 80.71%      32768 17.27%  syscall.ByteSliceFromString
     14597  7.69% 88.40%      14597  7.69%  net/textproto.(*Reader).ReadMIMEHeader
      8194  4.32% 92.72%      22791 12.01%  net/http.readRequest
      7022  3.70% 96.42%      30326 15.98%  net/http.(*conn).readRequest
      2562  1.35% 97.77%       2562  1.35%  runtime.allocm
      2049  1.08% 98.85%       2049  1.08%  sync.(*Pool).pinSlow
      1260  0.66% 99.51%       1260  0.66%  runtime.malg
         0     0% 99.51%       1025  0.54%  bufio.(*Writer).Flush
(pprof) list main.hello
Total: 189737
ROUTINE ======================== main.hello in D:\GOMOD\sheji_shixian\first\main.go
     54826      55338 (flat, cum) 29.17% of Total
         .          .     25:}
         .          .     26:
         .          .     27:func hello(resp http.ResponseWriter, req *http.Request) {
         .          .     28:   sl := make([]byte, 0)
         .          .     29:   for i := 0; i < 1024*1024*100; i++ {
     54826      54826     30:           sl = append(sl, byte(i))
         .          .     31:   }
         .        512     32:   fmt.Fprintln(resp, "Hello World, Are You OK?")
         .          .     33:}
         .          .     34:
         .          .     35:func RegisterProf() {
         .          .     36:   go func() {
         .          .     37:           defer func() {
(pprof)
预分配
func hello(resp http.ResponseWriter, req *http.Request) {
    sl := make([]byte, 0,1024*1024*100)//指定好容量,就是预分配
    for i := 0; i < 1024*1024*100; i++ {
        sl = append(sl, byte(i))
    }
    fmt.Fprintln(resp, "Hello World, Are You OK?")
}
压测:
D:\GOMOD\sheji_shixian\first>ab -k -c 1 -t 180 -n 1000 http://localhost:8080/hello
This is ApacheBench, Version 2.3 <$Revision: 1903618 $>
Copyright 1996 Adam Twiss, Zeus Technology Ltd, http://www.zeustech.net/
Licensed to The Apache Software Foundation, http://www.apache.org/

Benchmarking localhost (be patient)
Completed 100 requests
Completed 200 requests
Completed 300 requests
Completed 400 requests
Completed 500 requests
Completed 600 requests
Completed 700 requests
Completed 800 requests
Completed 900 requests
Completed 1000 requests
Finished 1000 requests


Server Software:
Server Hostname:        localhost
Server Port:            8080

Document Path:          /hello
Document Length:        25 bytes

Concurrency Level:      1
Time taken for tests:   174.800 seconds
Complete requests:      1000
Failed requests:        0
Keep-Alive requests:    1000
Total transferred:      166000 bytes
HTML transferred:       25000 bytes
Requests per second:    5.72 [#/sec] (mean)
Time per request:       174.800 [ms] (mean)
Time per request:       174.800 [ms] (mean, across all concurrent requests)
Transfer rate:          0.93 [Kbytes/sec] received

Connection Times (ms)
              min  mean[+/-sd] median   max
Connect:        0    0   0.0      0       0
Processing:   158  173  18.5    170     649
Waiting:      158  173  18.5    170     649
Total:        158  173  18.5    170     649

Percentage of the requests served within a certain time (ms)
  50%    170
  66%    173
  75%    175
  80%    177
  90%    184
  95%    195
  98%    201
  99%    224
 100%    649 (longest request)
alloc_space:先来查看内存分配情况:
D:\GOMOD\sheji_shixian>go tool pprof -alloc_space http://localhost:8080/debug/pprof/heap
Fetching profile over HTTP from http://localhost:8080/debug/pprof/heap
Saved profile in C:\Users\szl32\pprof\pprof.alloc_objects.alloc_space.inuse_objects.inuse_space.036.pb.gz
Type: alloc_space
Time: Mar 23, 2023 at 10:51pm (CST)
Entering interactive mode (type "help" for commands, "o" for options)
(pprof) top
Showing nodes accounting for 97.56GB, 100% of 97.57GB total
Dropped 44 nodes (cum <= 0.49GB)
      flat  flat%   sum%        cum   cum%
   97.56GB   100%   100%    97.56GB   100%  main.hello
         0     0%   100%    97.56GB   100%  net/http.(*ServeMux).ServeHTTP
         0     0%   100%    97.57GB   100%  net/http.(*conn).serve
         0     0%   100%    97.56GB   100%  net/http.HandlerFunc.ServeHTTP
         0     0%   100%    97.56GB   100%  net/http.serverHandler.ServeHTTP
(pprof) list main.hello
Total: 97.57GB
ROUTINE ======================== main.hello in D:\GOMOD\sheji_shixian\first\main.go
   97.56GB    97.56GB (flat, cum)   100% of Total
         .          .     23:   }
         .          .     24:
         .          .     25:}
         .          .     26:
         .          .     27:func hello(resp http.ResponseWriter, req *http.Request) {
   97.56GB    97.56GB     28:   sl := make([]byte, 0, 1024*1024*100)
         .          .     29:   for i := 0; i < 1024*1024*100; i++ {
         .          .     30:           sl = append(sl, byte(i))
         .          .     31:   }
         .        1MB     32:   fmt.Fprintln(resp, "Hello World, Are You OK?")
         .          .     33:}
         .          .     34:
         .          .     35:func RegisterProf() {
         .          .     36:   go func() {
         .          .     37:           defer func() {
(pprof)
alloc_objects:再查看分配对象情况
D:\GOMOD\sheji_shixian\first>go tool pprof -alloc_objects http://localhost:8080/debug/pprof/heap
Fetching profile over HTTP from http://localhost:8080/debug/pprof/heap
Saved profile in C:\Users\szl32\pprof\pprof.alloc_objects.alloc_space.inuse_objects.inuse_space.038.pb.gz
Type: alloc_objects
Time: Mar 23, 2023 at 10:53pm (CST)
Entering interactive mode (type "help" for commands, "o" for options)
(pprof) top12
Showing nodes accounting for 67747, 100% of 67747 total
Showing top 12 nodes out of 49
      flat  flat%   sum%        cum   cum%
     32768 48.37% 48.37%      32768 48.37%  internal/poll.execIO
     10923 16.12% 64.49%      10923 16.12%  net/textproto.NewReader (inline)
      4612  6.81% 71.30%       4612  6.81%  sync.(*Pool).pinSlow
      4097  6.05% 77.35%      20150 29.74%  net/http.readRequest
      3641  5.37% 82.72%       3641  5.37%  net/url.parse
      2562  3.78% 86.50%       2562  3.78%  runtime.allocm
      2521  3.72% 90.22%       2521  3.72%  runtime.malg
      2341  3.46% 93.68%      23260 34.33%  net/http.(*conn).readRequest
      1489  2.20% 95.88%       1489  2.20%  net/textproto.(*Reader).ReadMIMEHeader
      1024  1.51% 97.39%       1024  1.51%  runtime.allgadd
      1000  1.48% 98.86%       2025  2.99%  main.hello
       769  1.14%   100%        769  1.14%  bufio.NewWriterSize (inline)
(pprof) list main.hello
Total: 67747
ROUTINE ======================== main.hello in D:\GOMOD\sheji_shixian\first\main.go
      1000       2025 (flat, cum)  2.99% of Total
         .          .     23:   }
         .          .     24:
         .          .     25:}
         .          .     26:
         .          .     27:func hello(resp http.ResponseWriter, req *http.Request) {
      1000       1000     28:   sl := make([]byte, 0, 1024*1024*100)
         .          .     29:   for i := 0; i < 1024*1024*100; i++ {
         .          .     30:           sl = append(sl, byte(i))
         .          .     31:   }
         .       1025     32:   fmt.Fprintln(resp, "Hello World, Are You OK?")
         .          .     33:}
         .          .     34:
         .          .     35:func RegisterProf() {
         .          .     36:   go func() {
         .          .     37:           defer func() {
(pprof)
总结:
- 内存占用:预分配明显占用内存更少,只是在预分配的时候占用了97点多g的内存!
未预分配的内存占用:
         .          .     28:   sl := make([]byte, 0)
         .          .     29:   for i := 0; i < 1024*1024*100; i++ {
  572.71GB   572.71GB     30:           sl = append(sl, byte(i))
         .          .     31:   }
         .   512.50kB     32:   fmt.Fprintln(resp, "Hello World, Are You OK?")
预分配的内存占用:
   97.56GB    97.56GB     28:   sl := make([]byte, 0, 1024*1024*100)
         .          .     29:   for i := 0; i < 1024*1024*100; i++ {
         .          .     30:           sl = append(sl, byte(i))
         .          .     31:   }
         .        1MB     32:   fmt.Fprintln(resp, "Hello World, Are You OK?")
- 至于分配对象:
很明显预分配内存更好,分配的对象少了很多,append函数压根不会分配对象;
因为压测是压测1000次,所以预分配声明变量的时候分配了1000次,因为占用空间大,被放到了堆里,所以就会被统计到分配对象里!
而未预分配,因为声明变量sl时没有预分配内存,所以占用空间不大,就被放到了栈里,就不会被统计到!
未预分配内存:
         .          .     28:   sl := make([]byte, 0)
         .          .     29:   for i := 0; i < 1024*1024*100; i++ {
     54826      54826     30:           sl = append(sl, byte(i))
         .          .     31:   }
         .        512     32:   fmt.Fprintln(resp, "Hello World, Are You OK?")
预分配:
      1000       1000     28:   sl := make([]byte, 0, 1024*1024*100)
         .          .     29:   for i := 0; i < 1024*1024*100; i++ {
         .          .     30:           sl = append(sl, byte(i))
         .          .     31:   }
         .       1025     32:   fmt.Fprintln(resp, "Hello World, Are You OK?")
使用GO的benchmark进行测试
/*
 * @Description:
 * @version:
 * @Author: Steven
 * @Date: 2023-03-23 22:20:44
 */
package test_slice

import "testing"

func noAllocation() {
    sl := make([]byte, 0)
    for i := 0; i < 1024*1024*100; i++ {
        sl = append(sl, byte(i))
    }
}

func allocation() {
    sl := make([]byte, 0, 1024*1024*100)
    for i := 0; i < 1024*1024*100; i++ {
        sl = append(sl, byte(i))
    }
}

func BenchmarkAllocation(b *testing.B) {

    for i := 0; i < b.N; i++ {
        allocation()
    }

}

func BenchmarkNoAllocation(b *testing.B) {

    for i := 0; i < b.N; i++ {
        noAllocation()
    }

}
//CPU分析
go test -bench=. -cpuprofile=cpu.prof
//内存分析
go test -bench=All -memprofile=memory.prof
结果:预分配占用内存远比不未预分配占用内存低!
D:\GOMOD\sheji_shixian\first\test_slice>go test -bench=All -memprofile=memory.prof
goos: windows
goarch: amd64
pkg: first/test_slice
cpu: Intel(R) Core(TM) i7-6700HQ CPU @ 2.60GHz
BenchmarkAllocation-8                  9         122416544 ns/op
BenchmarkNoAllocation-8                7         155637100 ns/op
PASS
ok      first/test_slice        7.155s

D:\GOMOD\sheji_shixian\first\test_slice>go tool pprof memory.prof
Type: alloc_space
Time: Mar 23, 2023 at 10:45pm (CST)
Entering interactive mode (type "help" for commands, "o" for options)
(pprof) top
Showing nodes accounting for 8850.76MB, 99.95% of 8855.26MB total
Dropped 25 nodes (cum <= 44.28MB)
      flat  flat%   sum%        cum   cum%
 6450.76MB 72.85% 72.85%  6450.76MB 72.85%  first/test_slice.noAllocation (inline)
    2400MB 27.10% 99.95%     2400MB 27.10%  first/test_slice.allocation (inline)
         0     0% 99.95%     2400MB 27.10%  first/test_slice.BenchmarkAllocation
         0     0% 99.95%  6450.76MB 72.85%  first/test_slice.BenchmarkNoAllocation
         0     0% 99.95%  8162.81MB 92.18%  testing.(*B).launch
         0     0% 99.95%   687.94MB  7.77%  testing.(*B).run1.func1
         0     0% 99.95%  8850.76MB 99.95%  testing.(*B).runN
(pprof) list first/test_slice.noAllocation
Total: 8.65GB
ROUTINE ======================== first/test_slice.noAllocation in D:\GOMOD\sheji_shixian\first\test_slice\append_test.go
    6.30GB     6.30GB (flat, cum) 72.85% of Total
         .          .      9:import "testing"
         .          .     10:
         .          .     11:func noAllocation() {
         .          .     12:   sl := make([]byte, 0)
         .          .     13:   for i := 0; i < 1024*1024*100; i++ {
    6.30GB     6.30GB     14:           sl = append(sl, byte(i))
         .          .     15:   }
         .          .     16:}
         .          .     17:
         .          .     18:func allocation() {
         .          .     19:   sl := make([]byte, 0, 1024*1024*100)
(pprof) list first/test_slice.allocation
Total: 8.65GB
ROUTINE ======================== first/test_slice.allocation in D:\GOMOD\sheji_shixian\first\test_slice\append_test.go
    2.34GB     2.34GB (flat, cum) 27.10% of Total
         .          .     14:           sl = append(sl, byte(i))
         .          .     15:   }
         .          .     16:}
         .          .     17:
         .          .     18:func allocation() {
    2.34GB     2.34GB     19:   sl := make([]byte, 0, 1024*1024*100)
         .          .     20:   for i := 0; i < 1024*1024*100; i++ {
         .          .     21:           sl = append(sl, byte(i))
         .          .     22:   }
         .          .     23:}
         .          .     24:
(pprof)
浏览器点击heap,拉到最底部,可以看到一些重要信息
http://localhost:8080/debug/pprof/heap?debug=1
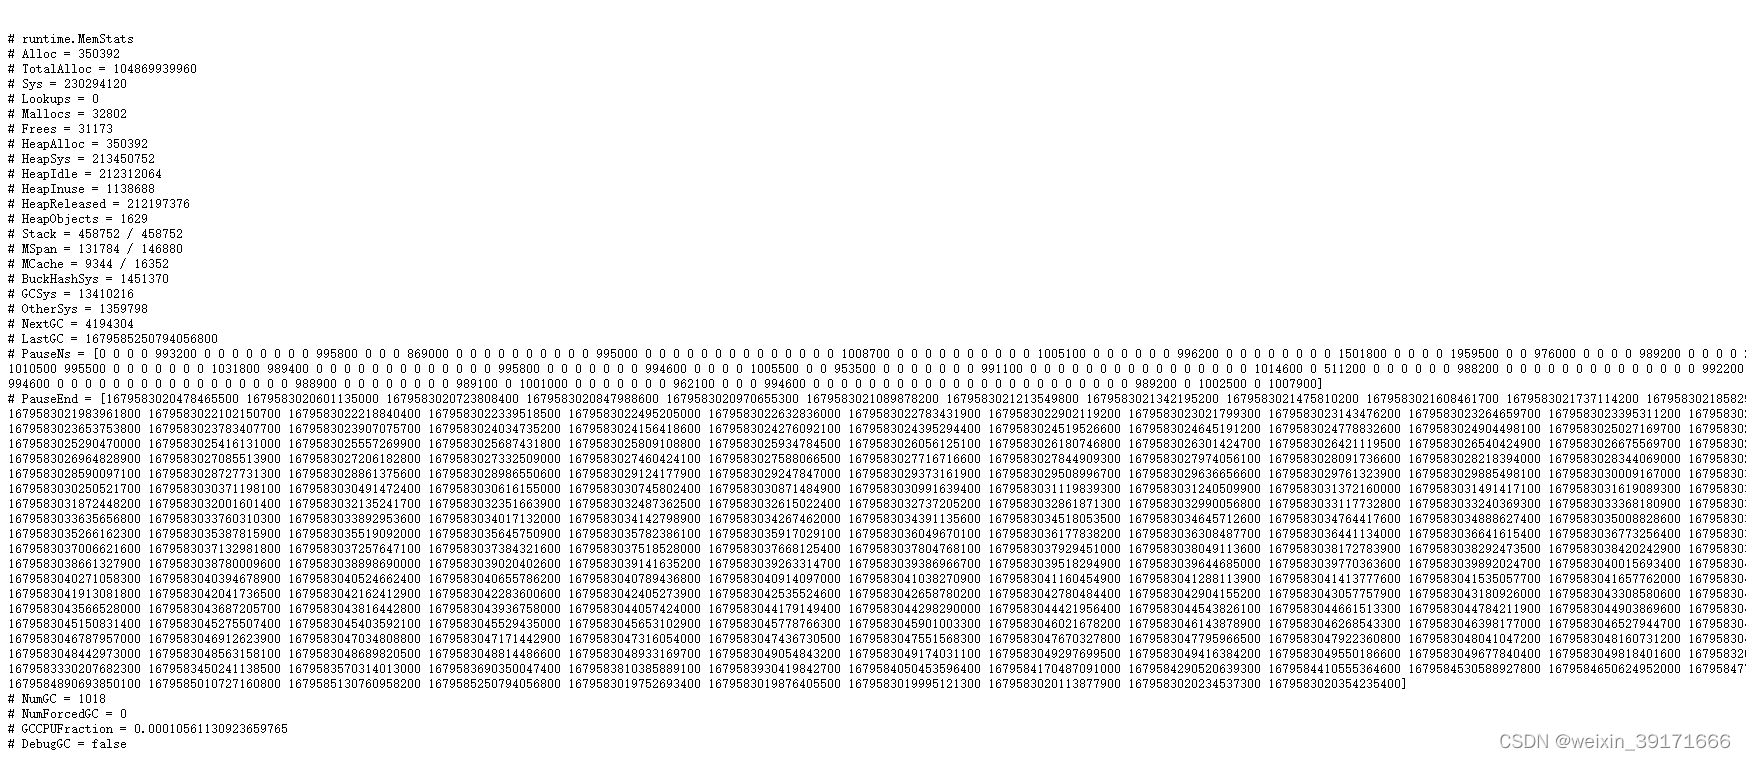
Sys: 进程从系统获得的内存空间,虚拟地址空间
HeapAlloc:进程堆内存分配使用的空间,通常是用户new出来的堆对象,包含未被gc掉的。
HeapSys:进程从系统获得的堆内存,因为golang底层使用TCmalloc机制,会缓存一部分堆内存,虚拟地址空间
PauseNs:记录每次gc暂停的时间(纳秒),最多记录256个最新记录。
NumGC: 记录gc发生的次数
阻塞分析
>go tool pprof -alloc_objects http://localhost:8080/debug/pprof/block
D:\GOMOD\sheji_shixian\first>go tool pprof -alloc_objects http://localhost:8080/debug/pprof/block
Fetching profile over HTTP from http://localhost:8080/debug/pprof/block
Saved profile in C:\Users\szl32\pprof\pprof.contentions.delay.001.pb.gz
Entering interactive mode (type "help" for commands, "o" for options)
(pprof) top
sample_index "alloc_objects" must be one of: [contentions delay]
(pprof) delay
(pprof) top
Showing nodes accounting for 0, 0% of 0 total
      flat  flat%   sum%        cum   cum%
(pprof)
互斥锁分析
go tool pprof -alloc_objects http://localhost:8080/debug/pprof/mutex
D:\GOMOD\sheji_shixian\first>go tool pprof -alloc_objects http://localhost:8080/debug/pprof/mutex
Fetching profile over HTTP from http://localhost:8080/debug/pprof/mutex
Saved profile in C:\Users\szl32\pprof\pprof.contentions.delay.002.pb.gz
Entering interactive mode (type "help" for commands, "o" for options)
(pprof) top
sample_index "alloc_objects" must be one of: [contentions delay]
(pprof) delay
(pprof) top
Showing nodes accounting for 0, 0% of 0 total
      flat  flat%   sum%        cum   cum%
协程泄露分析
什么是goroutine泄漏:
如果你启动了一个 goroutine,但并没有符合预期的退出,直到程序结束,此goroutine才退出,这种情况就是 goroutine 泄露。当 goroutine 泄露发生时,该 goroutine 的栈(一般 2k 内存空间起)一直被占用不能释放,goroutine 里的函数在堆上申请的空间也不能被 垃圾回收器 回收。这样,在程序运行期间,内存占用持续升高,可用内存越来也少,最终将导致系统崩溃。
先来演示防止协程泄露的办法:
代码
/*
 * @Description:
 * @version:
 * @Author: Steven
 * @Date: 2023-03-17 14:19:57
 */
package main

import (
    "fmt"
    "net/http"
    _ "net/http/pprof"
    "time"
)

func main() {
    RegisterProf()
    http.HandleFunc("/", hello)
    fmt.Println("server start")
    err := http.ListenAndServe("127.0.0.1:8080", nil)
    if err != nil {
        fmt.Println("ListenAndServe Err:", err.Error())
        return
    }

}

func hello(resp http.ResponseWriter, req *http.Request) {
    timeout(doBadthing)
    fmt.Fprintln(resp, "Hello World, Are You OK?")
}

func doBadthing(done chan bool) {
    time.Sleep(time.Second)
    done <- true
}

func timeout(f func(chan bool)) error {
    done := make(chan bool, 1) //非阻塞通道,select进入超时分支之后,没有了接收,doBadthing函数里也不会被阻塞
    go f(done)
    select {
    case <-done:
        fmt.Println("done")
        return nil
    case <-time.After(time.Millisecond):
        return fmt.Errorf("timeout")
    }
}

func RegisterProf() {
    go func() {
        defer func() {
            if err := recover(); err != nil {
                fmt.Println(err)
            }
        }()
        fmt.Println("pprof server start")
        if err := http.ListenAndServe("127.0.0.1:6060", nil); err != nil {
            panic("pprof server start error: " + err.Error()) //这个panic,主协程是捕获不到的
        }

    }()
}
压测:
ab -k -c 1 -t 180 -n 1000 http://localhost:8080/hello
分析:
D:\GOMOD\sheji_shixian>go tool pprof  http://localhost:8080/debug/pprof/goroutine
Fetching profile over HTTP from http://localhost:8080/debug/pprof/goroutine
Saved profile in C:\Users\szl32\pprof\pprof.goroutine.004.pb.gz
Type: goroutine
Time: Mar 24, 2023 at 12:04am (CST)
Entering interactive mode (type "help" for commands, "o" for options)
(pprof) top
Showing nodes accounting for 6, 100% of 6 total
Showing top 10 nodes out of 39
      flat  flat%   sum%        cum   cum%
         5 83.33% 83.33%          5 83.33%  runtime.gopark
         1 16.67%   100%          1 16.67%  runtime.goroutineProfileWithLabels
         0     0%   100%          2 33.33%  bufio.(*Reader).ReadLine
         0     0%   100%          2 33.33%  bufio.(*Reader).ReadSlice
         0     0%   100%          2 33.33%  bufio.(*Reader).fill
         0     0%   100%          2 33.33%  internal/poll.(*FD).Accept
         0     0%   100%          3 50.00%  internal/poll.(*FD).Read
         0     0%   100%          2 33.33%  internal/poll.(*FD).acceptOne
         0     0%   100%          5 83.33%  internal/poll.(*pollDesc).wait
         0     0%   100%          5 83.33%  internal/poll.execIO
(pprof)
浏览器也可以查看:http://localhost:8080/debug/pprof/goroutine?debug=1
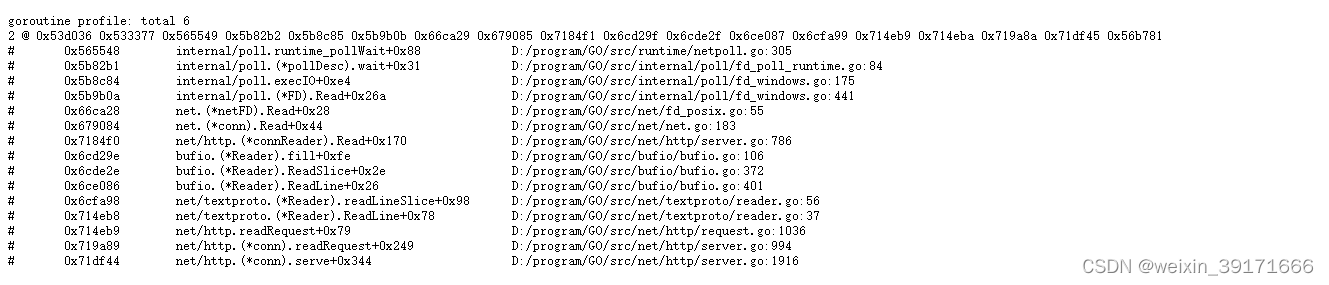
很明显,此时flat总和和浏览器查看最上面的total都是6,并不高!也并没有看到我们写的哪个函数在上面展示出来!
这这种情况,就可以理解为不用优化了!
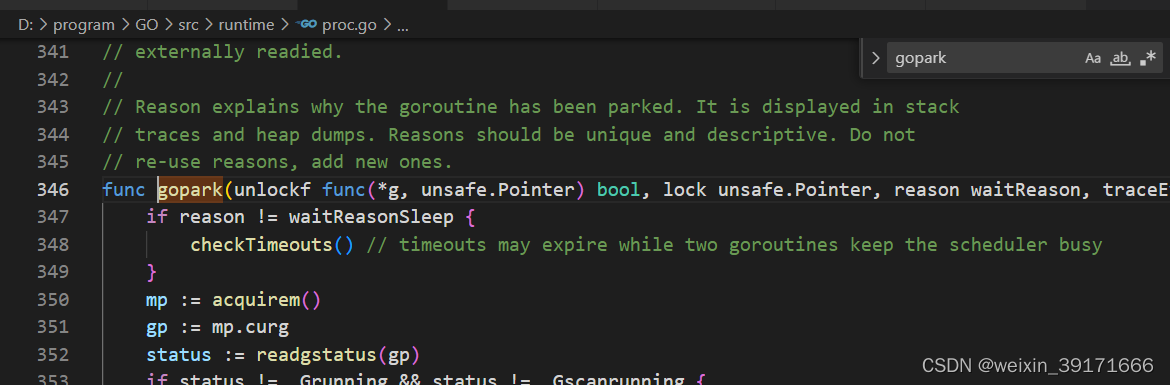
runtime.gopark函数解读(将当前协程修改为等待状态)
//将当前goroutine置于等待状态并调用unlockf
//系统堆栈。
//
//如果unlockf返回false,则继续执行goroutine。
//
// unlockf不能访问这个G的堆栈,因为它可能被移动
//对gopark和unlockf的调用。
//
//注意,因为unlockf是在将G放入waiting中之后调用的
// state, G可能在调用unlockf时已经准备好了
//除非有外部同步阻止G
/ /已经准备好。如果unlockf返回false,则必须保证G不能为false
//外部就绪。
//
//原因解释为什么goroutine已经被停。以堆叠方式显示
//跟踪和堆转储。理由应该是唯一的和描述性的。不
//重复使用理由,添加新的理由。
func gopark(unlockf func(*g, unsafe.Pointer) bool, lock unsafe.Pointer, reason waitReason, traceEv byte, traceskip int) {
    if reason != waitReasonSleep {
        checkTimeouts() // timeouts may expire while two goroutines keep the scheduler busy
    }
    mp := acquirem()//获取当前goroutine所绑定的m,设置各类所需参数。
    gp := mp.curg
    status := readgstatus(gp)
    if status != _Grunning && status != _Gscanrunning {
        throw("gopark: bad g status")
    }
    mp.waitlock = lock
    mp.waitunlockf = unlockf
    gp.waitreason = reason
    mp.waittraceev = traceEv
    mp.waittraceskip = traceskip
    releasem(mp)//调用 releasem 函数将当前 goroutine 和其 m 的绑定关系解除。
    // 不能做任何可能在Ms之间移动G的事情
    mcall(park_m)
}
//go:nosplit
func releasem(mp *m) {
    _g_ := getg()
    mp.locks--
    if mp.locks == 0 && _g_.preempt {
        // 如果我们在newstack中清除了抢占请求,则恢复它
        _g_.stackguard0 = stackPreempt
    }
}
// g0上继续停车
//将当前 goroutine 的状态从 _Grunning 切换为 _Gwaiting,也就是等待状态。删除 m 和当前 goroutine m→curg(简称gp)之间的关联。
func park_m(gp *g) {
    _g_ := getg()

    if trace.enabled {
        traceGoPark(_g_.m.waittraceev, _g_.m.waittraceskip)
    }

    casgstatus(gp, _Grunning, _Gwaiting)
    dropg()

    if fn := _g_.m.waitunlockf; fn != nil {
        ok := fn(gp, _g_.m.waitlock)
        _g_.m.waitunlockf = nil
        _g_.m.waitlock = nil
        if !ok {
            if trace.enabled {
                traceGoUnpark(gp, 2)
            }
            casgstatus(gp, _Gwaiting, _Grunnable)
            execute(gp, true) // Schedule it back, never returns.
        }
    }
    schedule()
}
// McAll从g栈切换到g0栈并调用fn(g),其中g是进行调用的goroutine。
// mcall将g当前的PC/SP保存在g->调度中,以便稍后恢复。
//由fn来安排后面的执行,通常是通过记录
// g,导致稍后调用ready(g)。
//当g被重新调度时,McAll稍后返回到原来的goroutine g。
// fn不能返回;通常它以调用schedule结束,以让m
//运行其他goroutine。
//
// McAll只能从g个堆栈调用(不是g0,不是gsignal)。
//
//如果fn是一个栈分配闭包,那么go:noescape:
// fn将g放到一个运行队列中,并且g在fn返回之前执行
//闭包仍在执行时将失效。
func mcall(fn func(*g))
//mcall:
//仅会在需要进行 goroutiine 切换时会被调用:
//切换当前线程的堆栈,从 g 的堆栈切换到 g0 的堆栈并调用 fn(g) 函数。将 g 的当前 PC/SP 保存在 g->sched 中,以便后续调用 goready 函数时可以恢复运行现场。
综上:该函数的关键作用就是将当前的 goroutine 放入等待状态,这意味着 goroutine 被暂时被搁置了,也就是被运行时调度器暂停了。
所以出现goroutine泄漏一定会调用这个函数,这个函数不是goroutine泄漏的原因,而是goroutine泄漏的结果。
阻塞导致泄露的代码
/*
* @Description:
* @version:
* @Author: Steven
* @Date: 2023-03-17 14:19:57
*/
package main
import (
"fmt"
"net/http"
_ "net/http/pprof"
"time"
)
func main() {
RegisterProf()
http.HandleFunc("/", hello)
fmt.Println("server start")
err := http.ListenAndServe("127.0.0.1:8080", nil)
if err != nil {
fmt.Println("ListenAndServe Err:", err.Error())
return
}
}
func hello(resp http.ResponseWriter, req *http.Request) {
timeout(doBadthing)
fmt.Fprintln(resp, "Hello World, Are You OK?")
}
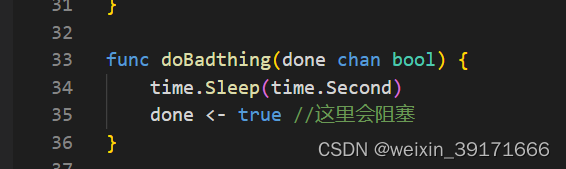
func doBadthing(done chan bool) {
time.Sleep(time.Second)
done <- true //这里会阻塞
}
func timeout(f func(chan bool)) error {
done := make(chan bool) //阻塞通道,select进入超时分支之后,没有了接收,doBadthing函数里done <- true就会阻塞在这里
go f(done)
select {
case <-done:
fmt.Println("done")
return nil
case <-time.After(time.Millisecond):
return fmt.Errorf("timeout")
}
}
func RegisterProf() {
go func() {
defer func() {
if err := recover(); err != nil {
fmt.Println(err)
}
}()
fmt.Println("pprof server start")
if err := http.ListenAndServe("127.0.0.1:6060", nil); err != nil {
panic("pprof server start error: " + err.Error()) //这个panic,主协程是捕获不到的
}
}()
}
压测
ab -k -c 1 -t 180 -n 1000 http://localhost:8080/hello
命令行结果:
D:\GOMOD\sheji_shixian>go tool pprof  http://localhost:8080/debug/pprof/goroutine
Fetching profile over HTTP from http://localhost:8080/debug/pprof/goroutine
Saved profile in C:\Users\szl32\pprof\pprof.goroutine.005.pb.gz
Type: goroutine
Time: Mar 24, 2023 at 12:09am (CST)
Entering interactive mode (type "help" for commands, "o" for options)
(pprof) top
Showing nodes accounting for 1003, 99.90% of 1004 total
Dropped 30 nodes (cum <= 5)
      flat  flat%   sum%        cum   cum%
      1003 99.90% 99.90%       1003 99.90%  runtime.gopark
         0     0% 99.90%       1000 99.60%  main.doBadthing
         0     0% 99.90%       1000 99.60%  runtime.chansend
         0     0% 99.90%       1000 99.60%  runtime.chansend1
(pprof)
D:\GOMOD\sheji_shixian>go tool pprof  http://localhost:8080/debug/pprof/goroutine
Fetching profile over HTTP from http://localhost:8080/debug/pprof/goroutine
Saved profile in C:\Users\szl32\pprof\pprof.goroutine.006.pb.gz
Type: goroutine
Time: Mar 24, 2023 at 12:09am (CST)
Entering interactive mode (type "help" for commands, "o" for options)
(pprof) top
Showing nodes accounting for 1007, 99.90% of 1008 total
Dropped 34 nodes (cum <= 5)
      flat  flat%   sum%        cum   cum%
      1007 99.90% 99.90%       1007 99.90%  runtime.gopark
         0     0% 99.90%          6   0.6%  internal/poll.(*pollDesc).wait
         0     0% 99.90%          6   0.6%  internal/poll.execIO
         0     0% 99.90%          6   0.6%  internal/poll.runtime_pollWait
         0     0% 99.90%       1001 99.31%  main.doBadthing
         0     0% 99.90%       1001 99.31%  runtime.chansend
         0     0% 99.90%       1001 99.31%  runtime.chansend1
         0     0% 99.90%          6   0.6%  runtime.netpollblock
(pprof)
浏览器结果:
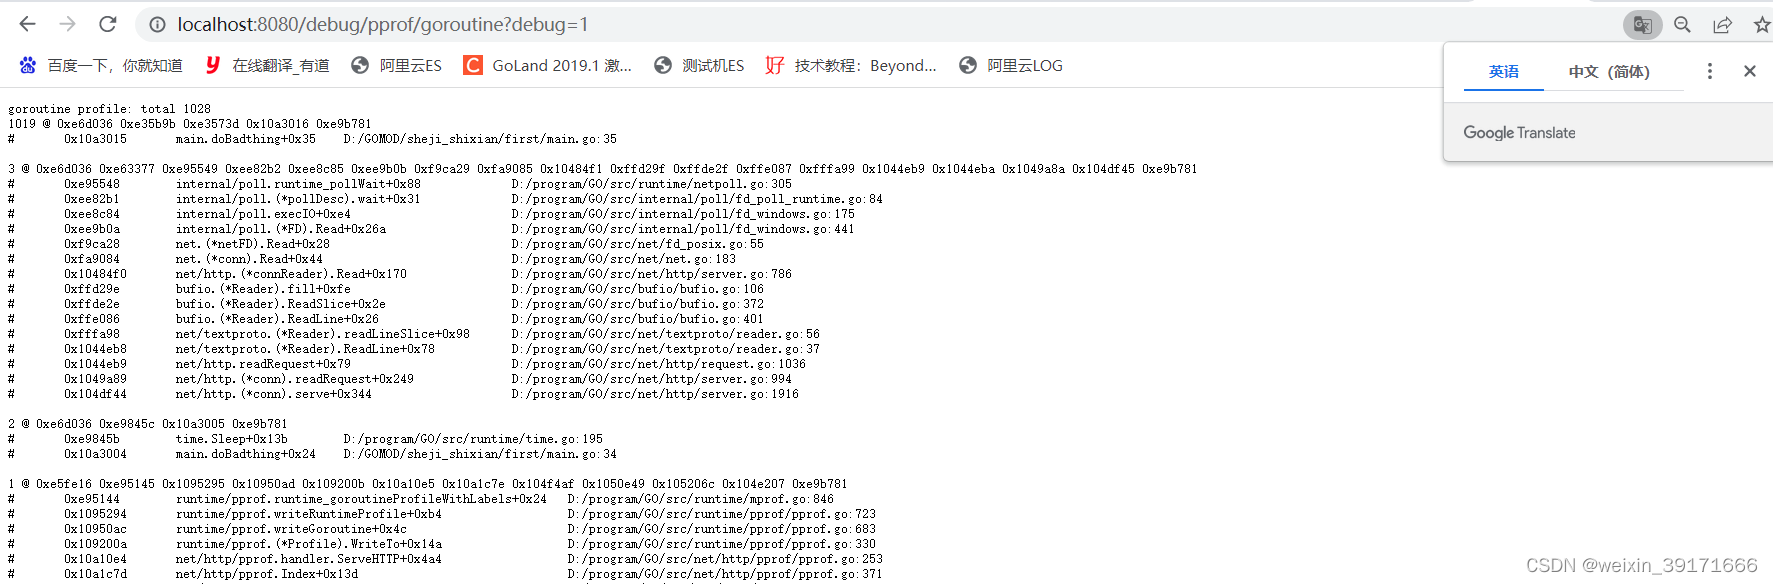
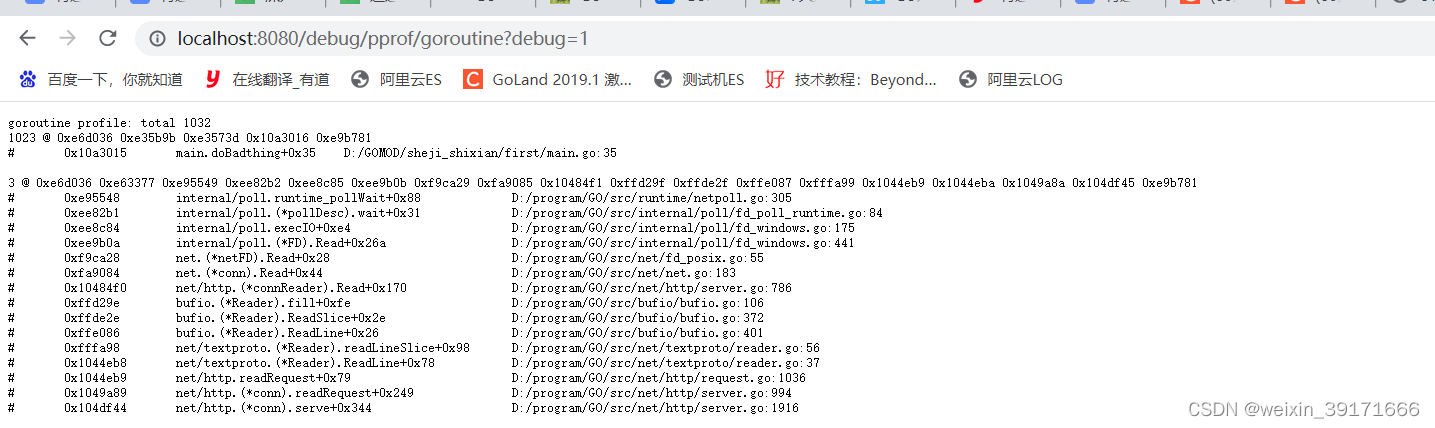
通过命令行多次执行命令或者刷新浏览器来查看结果,数一直都是在变化的!
- 浏览器可以直接看出来导致泄露的代码所在:是main.go第35行导致泄露的次数,total是该程序总共泄露数
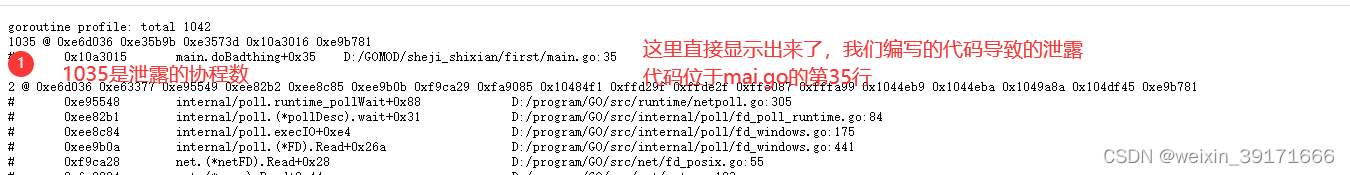
确实就是第35行:
- 通过命令行查看:
*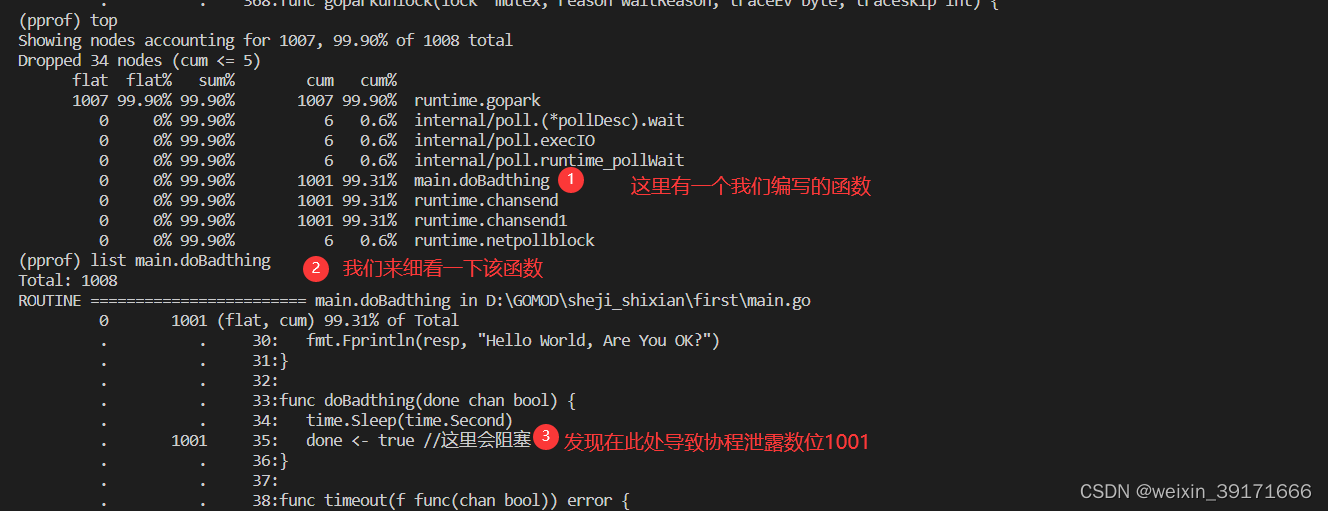
至此就找到了导致协程泄露的地方,我们对此产生的泄露,想办法解决就好了!


 802
802


 被折叠的 条评论
为什么被折叠?
被折叠的 条评论
为什么被折叠?
 到【灌水乐园】发言


