


比较(四)利用python绘制平行坐标图
平行坐标图(Parallel coordinate plot)简介
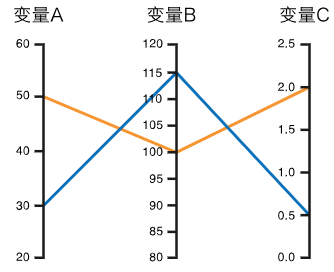
平行坐标图可以显示多变量的数值数据,最适合用来同一时间比较许多变量,并表示它们之间的关系。缺点也很明显,
不同的轴线排列顺序可能会影响读者对数据的理解。
快速绘制
-
基于pandas
import pandas
import matplotlib.pyplot as plt
import seaborn as sns
from pandas.plotting import parallel_coordinates

# 导入数据
data = sns.load_dataset('iris')

# 利用parallel_coordinates快速绘制
parallel_coordinates(data, 'species', colormap=plt.get_cmap("Set2"))
plt.show()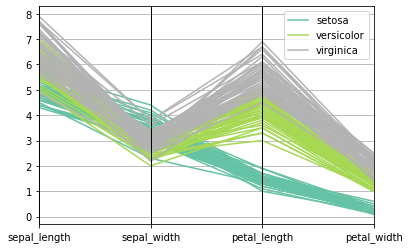
-
基于plotly
import plotly.express as px

# 导入数据
df = px.data.iris()

# 利用parallel_coordinates快速绘制
fig = px.parallel_coordinates(
    df,
    color="species_id",
    labels={

     "species_id": "Species","sepal_width": "Sepal Width", "sepal_length": "Sepal Length", "petal_width": "Petal Width", "petal_length": "Petal Length", },
    color_continuous_scale=px.colors.diverging.Tealrose,
    color_continuous_midpoint=2)

# 隐藏色阶bar
fig.update_layout(coloraxis_showscale=False)

fig.show(
 最低0.47元/天 解锁文章


 898
898

 被折叠的 条评论
为什么被折叠?
被折叠的 条评论
为什么被折叠?
 到【灌水乐园】发言


