


Randomw Forest算法 python实现,该系列文章主要是对常见的机器学习算法的实现。
完整的笔记和代码以上传到Github,地址为(觉得有用的话,欢迎Fork,请给作者个Star):
https://github.com/Vambooo/lihang-dl
随机森林 Random Forest
随机森林是对多棵树组合对样本训练预测的一种分类器,它是Bagging方法的最流行的版本之一。
可以理解为随机森林是个体模型为决策树的Bagging算法。
随机森林由Breiman提出的一种分类算法,它使用Bootstrap重采样技术,从原始训练样本集中有放回的重复随机抽取n个样本生成新的样本集合,以此作为训练集来训练决策树。然后按照上述步骤生成m棵决策树组合而成随机森林。
随机森林算法
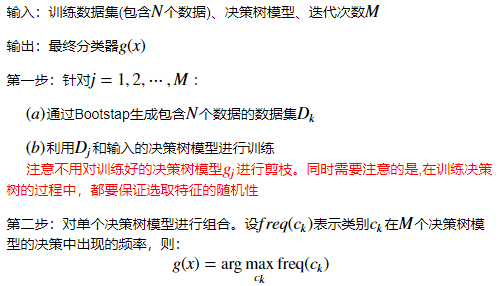
Random Forest算法案例 python实现
(代码可以左右滑动看)
第一步:构建数据(这里用make_blobs()来构建聚类数据)
X, y = make_blobs(n_samples=3000, centers=2, random_state=42, cluster_std=1.0)
n_samples是待生成的样本的总数;
n_features是每个样本的特征数;
centers表示类别数;
cluster_std表示每个类别的方差。
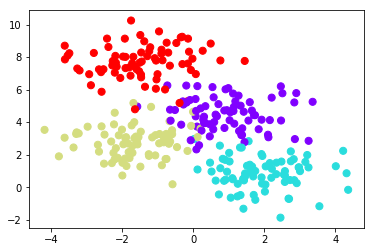
from sklearn.datasets import make_blobs
X, y = make_blobs(n_samples=300, centers=4,
random_state=0, cluster_std=1.0)plt.scatter(X[:, 0], X[:, 1], c=y, s=50, cmap='rainbow');
定义树的可视化方法
def visualize_tree(estimator, X, y, boundaries=True,
xlim=None, ylim=None, ax=None):
ax = ax or plt.gca()
# 绘制训练点 ax.scatter(X[:, 0], X[:, 1], c=y, s=30, cmap='viridis',
clim=(y.min(), y.max()), zorder=3)
ax.axis('tight') ax.axis('off') if xlim is None:
xlim = ax.get_xlim() if ylim is None:
ylim = ax.get_ylim()
# 拟合估计器 estimator.fit(X, y)
xx, yy = np.meshgrid(np.linspace(*xlim, num=200),
np.linspace(*ylim, num=200)) Z = estimator.predict(np.c_[xx.ravel(), yy.ravel()])
# 将结果放入到带颜色的图中 n_classes = len(np.unique(y))
Z = Z.reshape(xx.shape) contours = ax.contourf(xx, yy, Z, alpha=0.3,
levels=np.arange(n_classes + 1) - 0.5,
cmap='viridis',zorder=1)
ax.set(xlim=xlim, ylim=ylim)
# 绘制决策边界 def plot_boundaries(i, xlim, ylim):
if i >= 0:
tree = estimator.tree_
if tree.feature[i] == 0:
ax.plot([tree.threshold[i], tree.threshold[i]], ylim, '-k', zorder=2)
plot_boundaries(tree.children_left[i],
[xlim[0], tree.threshold[i]], ylim)
plot_boundaries(tree.children_right[i],
[tree.threshold[i], xlim[1]], ylim) elif tree.feature[i] == 1:
ax.plot(xlim, [tree.threshold[i], tree.threshold[i]], '-k', zorder=2)
plot_boundaries(tree.children_left[i], xlim,
[ylim[0], tree.threshold[i]])
plot_boundaries(tree.children_right[i], xlim,
[tree.threshold[i], ylim[1]])
if boundaries:
plot_boundaries(0, xlim, ylim)
定义分类器的可视化方法
def visualize_classifier(model, X, y, ax=None, cmap='rainbow'):
ax = ax or plt.gca()
# 绘制训练点 ax.scatter(X[:, 0], X[:, 1], c=y, s=30, cmap=cmap,
clim=(y.min(), y.max()), zorder=3) ax.axis('tight')
ax.axis('off') xlim = ax.get_xlim() ylim = ax.get_ylim()
# 拟合估计器 model.fit(X, y)
xx, yy = np.meshgrid(np.linspace(*xlim, num=200),
np.linspace(*ylim, num=200))
Z = model.predict(np.c_[xx.ravel(), yy.ravel()]).reshape(xx.shape)
# 将拟合结果绘制在带颜色的图中
n_classes = len(np.unique(y))
contours = ax.contourf(xx, yy, Z, alpha=0.3,
levels=np.arange(n_classes + 1) - 0.5,
cmap=cmap,
zorder=1)
ax.set(xlim=xlim, ylim=ylim)
#定义可设置深度的决策树分类器def depth_tree(depth=5): clf = DecisionTreeClassifier(max_depth=depth, random_state=0) visualize_tree(clf, X, y)
深度为1的决策树分类器,分类效果
from sklearn.tree import DecisionTreeClassifiertree = DecisionTreeClassifier().fit(X, y)visualize_classifier(DecisionTreeClassifier(), X, y)
深度为5的决策树分类器,分类效果
depth_tree(depth=5)
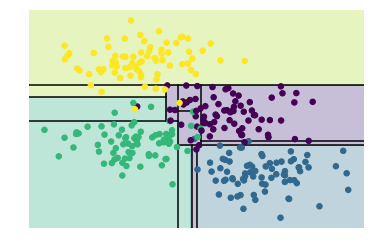
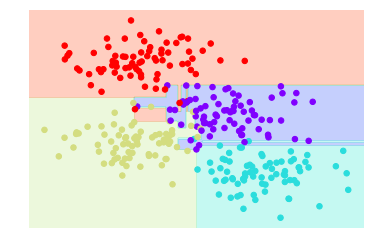
深度为10的决策树分类器,分类效果
depth_tree(depth=10)
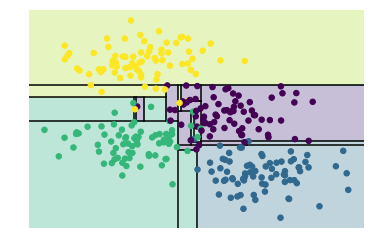
深度为15的决策树分类器,分类效果
depth_tree(depth=15)
如上图,当决策树的深度不断增加时,会出现不同的分类区域,比如当depth=10时,在黄色和蓝色之间存在一条紫色区域,这块数据应该是噪声或者特定采样的结果,这块不能归为紫色一类,这种现象其实就是过拟合。
可以通过组合多个分类器(这里是决策树分类器)来减少这个种过拟合的影响。这也是Bagging的思想。
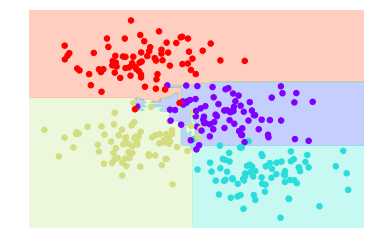
下面就是使用Bagging来组合100个DecisionTreeClassifier来进行测试。其中使用80%的数据来随机化数据
from sklearn.tree import DecisionTreeClassifierfrom sklearn.ensemble import BaggingClassifier
tree = DecisionTreeClassifier()bag = BaggingClassifier(tree, n_estimators=100, max_samples=0.8, random_state=1)
bag.fit(X, y)visualize_classifier(bag, X, y)
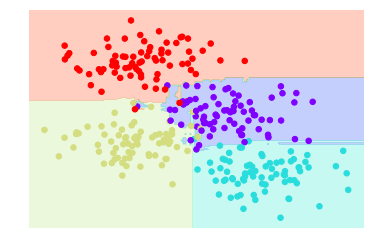
也可以直接使用Scikit-learn中已定义好的RandomForestClassifier来实现
from sklearn.ensemble import RandomForestClassifier
model = RandomForestClassifier(n_estimators=100, random_state=0)visualize_classifier(model, X, y);


 6万+
6万+


 被折叠的 条评论
为什么被折叠?
被折叠的 条评论
为什么被折叠?
 到【灌水乐园】发言


