


来源:性能与架构
整体结构
SpringBoot 的 actuator 提供了监控端点。
Prometheus 是监控系统,可以从 Springboot 获取监控数据,以时序数据的形式存储,并提供了监控数据的查询服务。
Grafana 是专业的 UI 仪表盘系统,支持非常多的数据源,其中就包括 Prometheus,可以便利的从中获取数据,使用仪表盘展示出来。
springboot 2 中引入了 micrometer,它可以更方便的对接各种监控系统,包括 Prometheus。
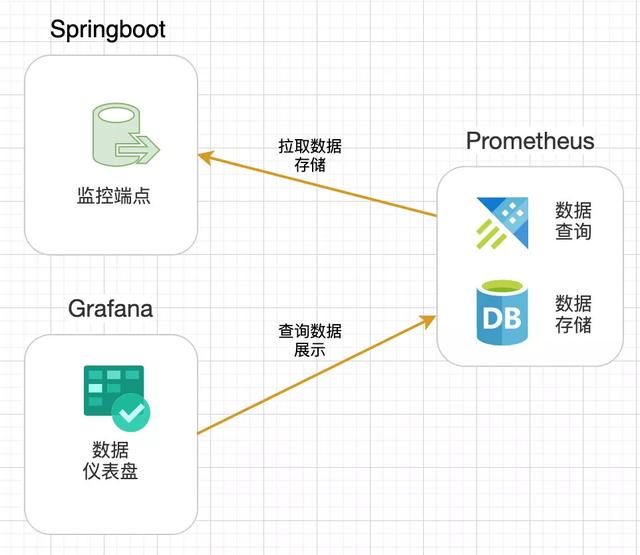
所以整体的结构就是:
- springboot(micrometer)产生监控数据。
- Prometheus 获取 springboot 应用的监控数据,存储,并提供数据查询服务。
- Grafana 对接 Prometheus 数据源,调用其数据查询服务,用专业的仪表盘 UI 进行展示。
实践步骤
- 创建应用 -- 作为监控目标,产生监控数据。
- 集成度量库 micrometer -- 以便对接监控系统 Prometheus。
- 部署 prometheus
- 配置 prometheus -- 监控之前创建的 springboot 应用,了解 Prometheus 的查询服务。
- 部署 Grafana
- 添加 Prometheus 数据源
- 添加 JVM 监控仪表盘 -- 展示之前 springboot 应用的 JVM 状态。
- 自定义监控指标 -- 自有的监控指标都是底层基础数据,业务相关指标需要我们自己写代码。
- 动态变更监控目标 -- 如果监控目标发生变动就改一次 Prometheus 的配置文件,并重新启动,这是不适合的,需要使用动态配置的方式。
1. 创建应用 集成 micrometer
创建一个最简的 springboot 应用,添加 micrometer 依赖。
pom.xml :
<?xml version="1.0" encoding="UTF-8"?> 4.0.0org.springframework.bootspring-boot-starter-parent2.2.4.RELEASEcom.examplespringboot2demo0.0.1-SNAPSHOTspringboot2demoDemo project for Spring Boot1.8org.springframework.bootspring-boot-starter-actuatororg.springframework.bootspring-boot-starter-webio.micrometermicrometer-registry-prometheus1.1.4org.springframework.bootspring-boot-starter-testtestorg.junit.vintagejunit-vintage-engineorg.springframework.bootspring-boot-maven-pluginapplication.properties
spring.application.name=springboot2demo# 打开所有 Actuator 服务management.endpoints.web.exposure.include=* # 将应用名称添加到计量器的 tag 中去# 以便 Prometheus 根据应用名区分不同服务management.metrics.tags.application=${spring.application.name}在启动类中添加Bean,用于监控JVM性能指标:
package com.example.springboot2demo;import io.micrometer.core.instrument.MeterRegistry;import org.springframework.beans.factory.annotation.Value;import org.springframework.boot.SpringApplication;import org.springframework.boot.actuate.autoconfigure.metrics.MeterRegistryCustomizer;import org.springframework.boot.autoconfigure.SpringBootApplication;import org.springframework.context.annotation.Bean;@SpringBootApplicationpublic class Springboot2demoApplication { public static void main(String[] args) { SpringApplication.run(Springboot2demoApplication.class, args); } @Bean MeterRegistryCustomizer configurer( @Value("${spring.application.name}") String applicationName) { return (registry) -> registry.config().commonTags("application", applicationName); }}启动服务。
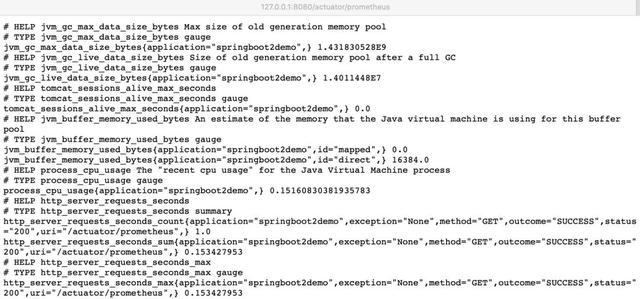
查看监控端点信息:
2. 部署 Prometheus
官网:
https://prometheus.io/
可以下载安装包来安装,但下载速度极其慢,几乎下载不了。
可以使用 docker 部署,因为国内有docker镜像,所以速度很快。
docker 方式启动:
$ docker run --name prometheus -d -p 127.0.0.1:9090:9090 prom/prometheus执行完成后就OK了,可以看一下 Prometheus 的界面。
http://localhost:9090/targets 是监控目标列表页:

http://localhost:9090/graph 是查询控制台,也有简单的图表展示:
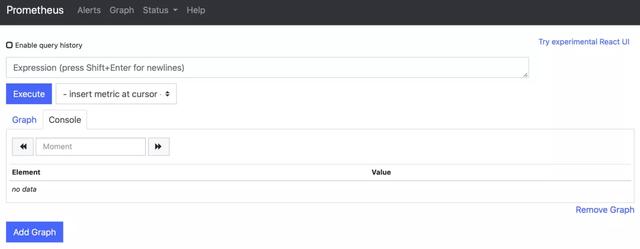
现在还没对接应用,后面对接之后可以看到详细的内容。
3. Prometheus + Springboot应用
监控应用,需要在 Prometheus 配置文件中添加应用的相关信息。
配置文件在容器中的路径:/etc/prometheus。
查看一下配置文件的默认内容:
$ docker exec -it [容器ID] cat /etc/prometheus/prometheus.yml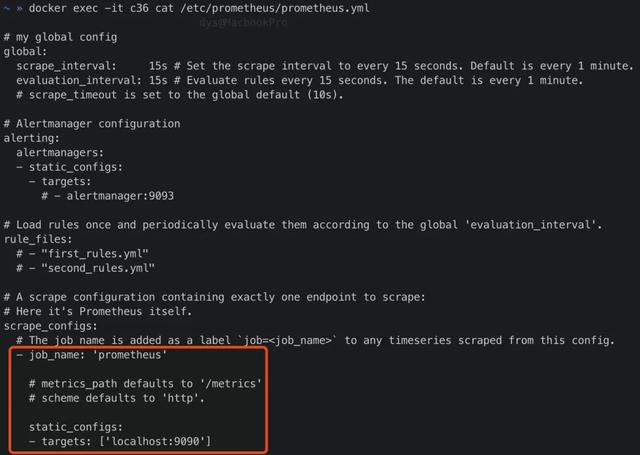
红框内是我们要关注的部分,按照这个形式添加我们的应用即可。
需要添加的内容为:
- job_name: 'springboot_app' scrape_interval: 5s metrics_path: '/actuator/prometheus' static_configs: - targets: ['192.168.31.6:8080'] "labels": { "instance": "springboot2-A", "service": "springboot2-A-service" }metrics_path 指定监控端点的路径。
targets 指定应用的IP端口,这里使用了IP,没有使用localhost,因为 Prometheus 是容器运行的,如果使用 localhost 就会访问容器内部。
配置不是直接在容器内部修改,可以把容器内部的配置文件拷贝出来一份,修改后,重启启动容器,挂载本地修改过的配置文件。
拷贝容器中的配置文件:
$ docker cp [容器ID]:/etc/prometheus/prometheus.yml .修改配置文件,添加配置,最终的内容:
# my global configglobal: scrape_interval: 15s # Set the scrape interval to every 15 seconds. Default is every 1 minute. evaluation_interval: 15s # Evaluate rules every 15 seconds. The default is every 1 minute. # scrape_timeout is set to the global default (10s).# Alertmanager configurationalerting: alertmanagers: - static_configs: - targets: # - alertmanager:9093# Load rules once and periodically evaluate them according to the global 'evaluation_interval'.rule_files: # - "first_rules.yml" # - "second_rules.yml"# A scrape configuration containing exactly one endpoint to scrape:# Here it's Prometheus itself.scrape_configs: # The job name is added as a label `job=` to any timeseries scraped from this config. - job_name: 'prometheus' # metrics_path defaults to '/metrics' # scheme defaults to 'http'. static_configs: - targets: ['localhost:9090'] - job_name: 'springboot_app' scrape_interval: 5s metrics_path: '/actuator/prometheus' static_configs: - targets: ['192.168.31.6:8080'] "labels": { "instance": "springboot2-A", "service": "springboot2-A-service" }停掉之前的容器,重新启动:
$ docker run --name prometheus -d -p 9090:9090 -v [PATH]/prometheus.yml:/etc/prometheus/prometheus.yml prom/prometheus访问监控列表页 http://localhost:9090/targets 就可以看到我们的应用了:
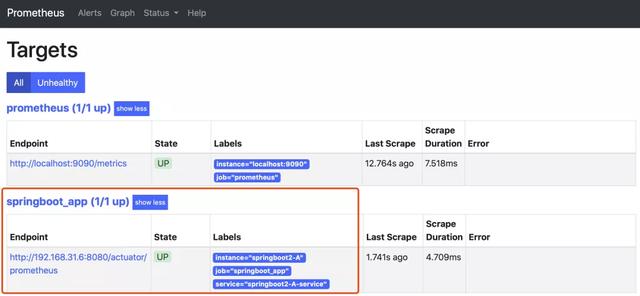
点击端点链接,可以看到监控数据,例如:

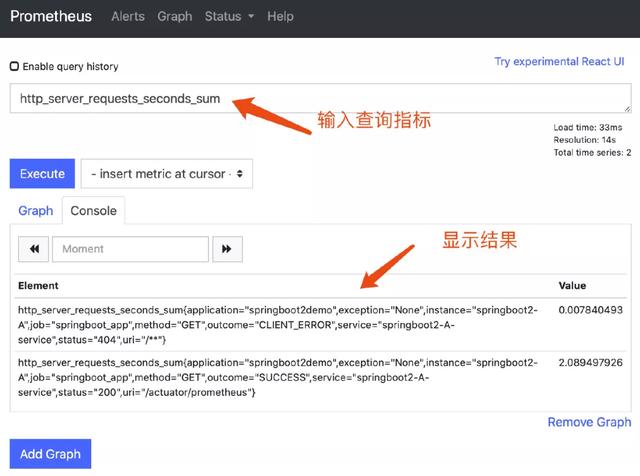
进入查询控制台页面 http://localhost:9090/graph,可以查询一个指标,例如 http_server_requests_seconds_sum,效果:
4. 部署 Grafana
docker方式运行:
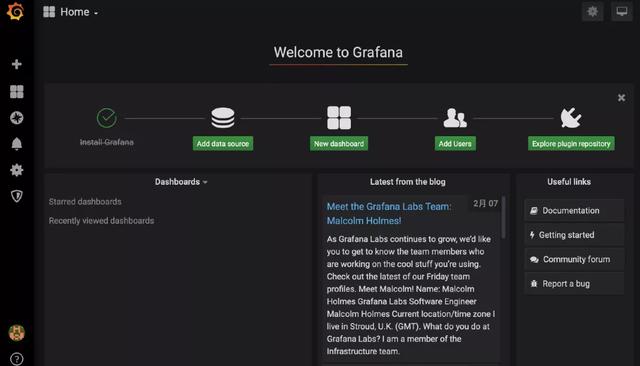
$ docker run -d -p 3000:3000 --name=grafana grafana/grafana启动后,访问:http://localhost:3000,默认用户名密码 admin/admin。

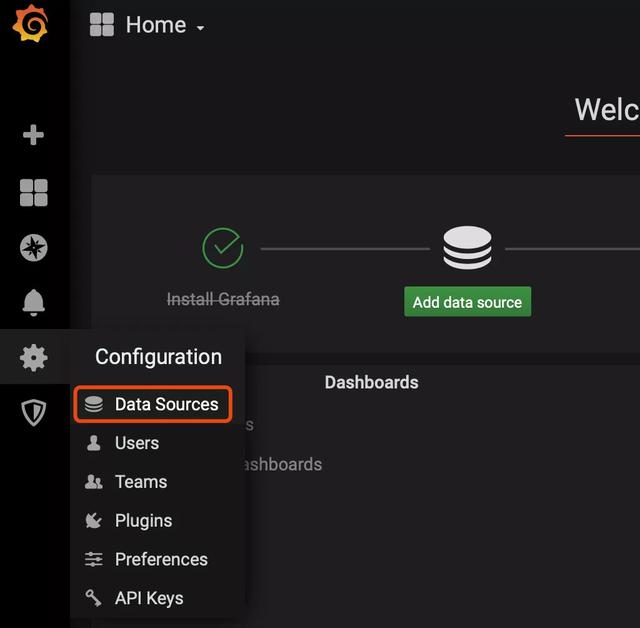
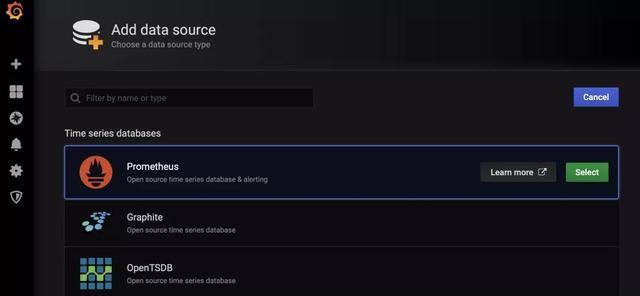
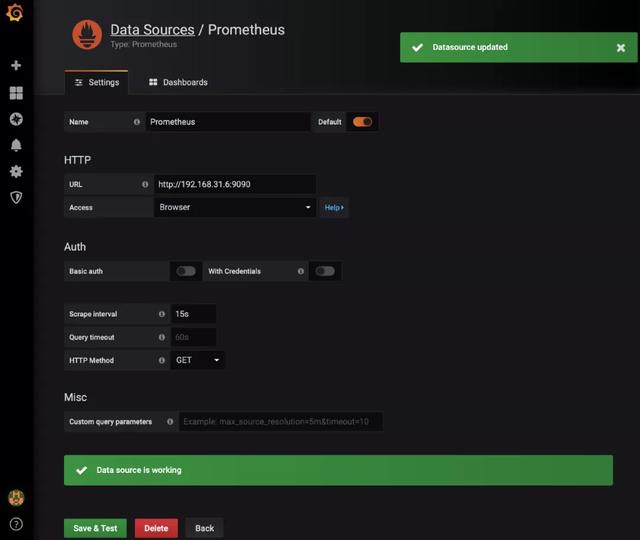
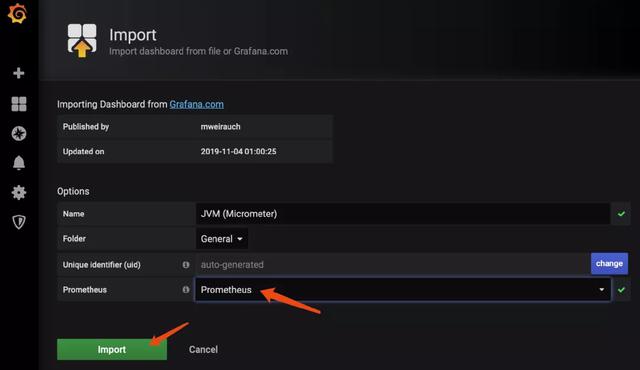
5. 添加 Prometheus 数据源
6. 展示应用的 JVM 信息
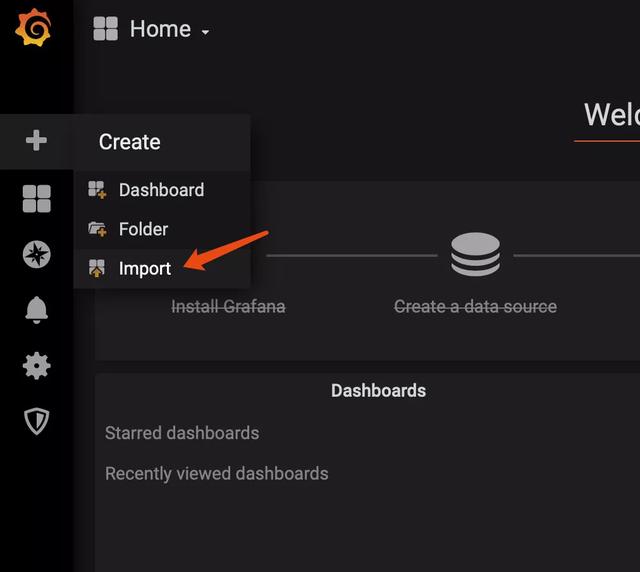
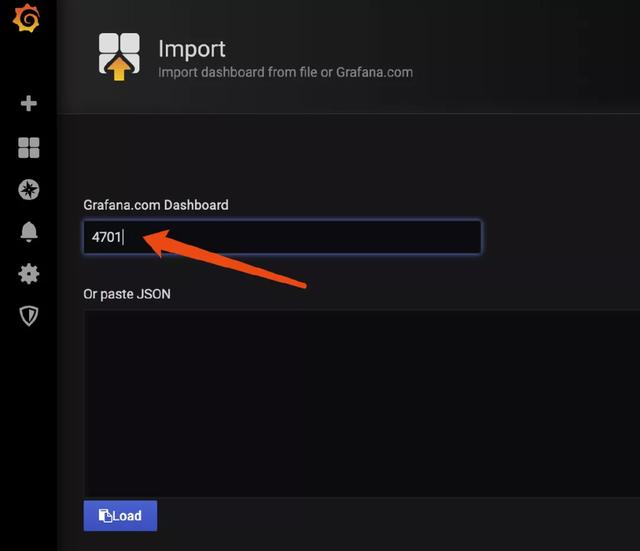
Grafana 中已经有现成的 JVM 仪表盘,我们直接导入使用即可。
这个仪表盘的编号为 4701。
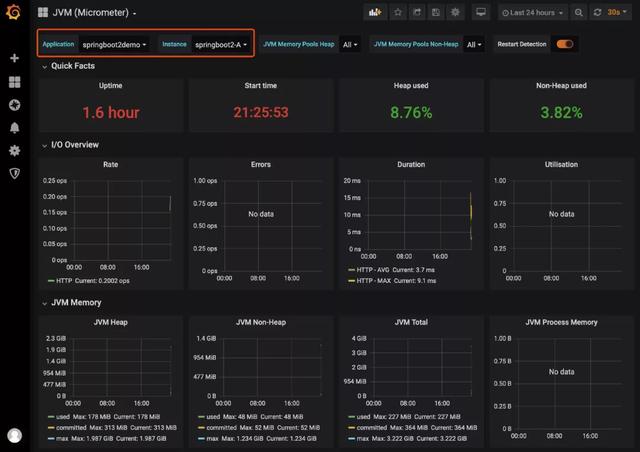
至此,Prometheus + Grafana + Springboot 的整体流程已经跑通了。
但是,这些指标都是底层通用指标,在业务层面一定会有个性需求,下面我们自己定义一些监控指标。
7. 自定义监控指标
需求:监控所有接口的请求次数。
应用中添加依赖:
org.aspectjaspectjrt1.9.4org.aspectjaspectjweaver1.9.4cglibcglib3.2.12使用AOP方式对接口请求计数:
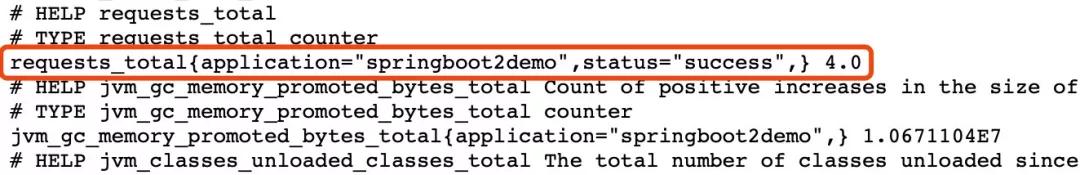
package com.example.springboot2demo;import io.micrometer.core.instrument.Counter;import io.micrometer.core.instrument.MeterRegistry;import org.aspectj.lang.JoinPoint;import org.aspectj.lang.annotation.AfterReturning;import org.aspectj.lang.annotation.Aspect;import org.aspectj.lang.annotation.Before;import org.aspectj.lang.annotation.Pointcut;import org.springframework.beans.factory.annotation.Autowired;import org.springframework.stereotype.Component;import javax.annotation.PostConstruct;@Component@Aspectpublic class APICounterAop { @Pointcut("execution(public * com.example.springboot2demo.*.*(..))") public void pointCut() { } ThreadLocal startTime = new ThreadLocal<>(); @Autowired MeterRegistry registry; private Counter counter; @PostConstruct private void init() { counter = registry.counter("requests_total", "status", "success"); } @Before("pointCut()") public void doBefore(JoinPoint joinPoint) throws Throwable { System.out.println("do before"); counter.increment(); //请求计数 } @AfterReturning(returning = "returnVal", pointcut = "pointCut()") public void doAfterReturning(Object returnVal) { System.out.println("do after"); }}创建一个测试接口:
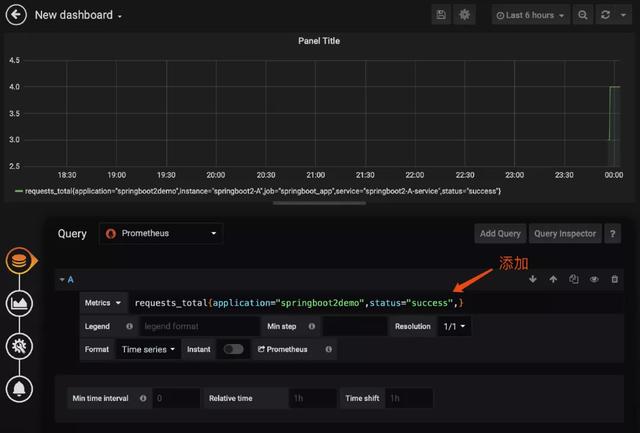
package com.example.springboot2demo;import org.springframework.web.bind.annotation.RequestMapping;import org.springframework.web.bind.annotation.RestController;@RestControllerpublic class TestController { @RequestMapping("/hello") public String hello() { return "hello"; }}重启应用,多访问几次测试接口,然后查看 Prometheus 中的应用监控端点页面,就可以看到监控结果:
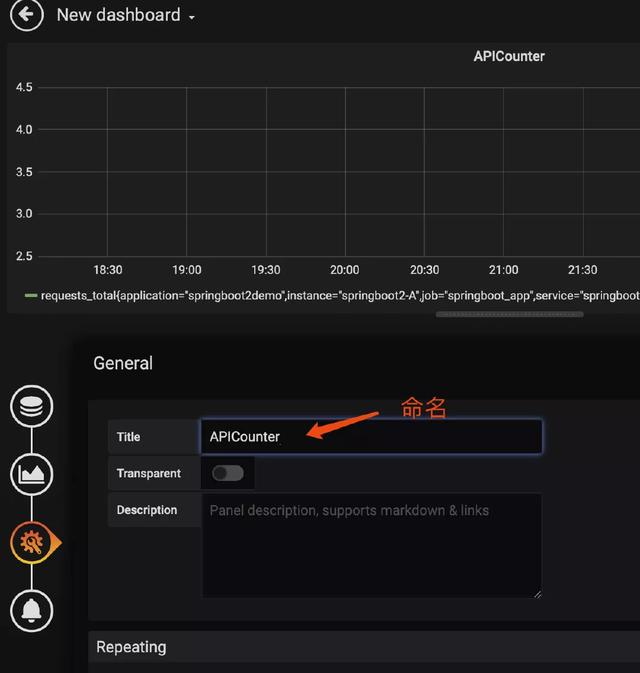
然后,我们把这个指标在 Grafana 中显示出来。
8. 动态变更监控目标
上面 Prometheus 配置文件中定义的监控目标使用的是静态方式,改配置文件后需要重启。
如果服务变更了,或者增加服务了,经常重启 Prometheus 肯定不合适。
Prometheus 提供了动态加载的方式,把服务信息放到一个单独的文件中,Prometheus 配置中指定这个外部文件,内容变化后,Prometheus 就会自动重新加载。
服务信息配置文件例如:
[ { "targets": [ "192.168.31.6:8080" ], "labels": { "instance": "springboot2-A", "service": "springboot2-A-service" } }]Prometheus 配置文件中的写法:
... - job_name: 'springboot_app' scrape_interval: 5s metrics_path: '/actuator/prometheus' file_sd_configs: - files: - /home/*.json refresh_interval: 1m启动 Prometheus 容器时要挂载这个服务信息配置文件的目录:
$ docker run --name prometheus -d -p 9090:9090 -v [PATH]/prometheus.yml:/etc/prometheus/prometheus.yml -v [PATH]:/home prom/prometheus


 328
328


 被折叠的 条评论
为什么被折叠?
被折叠的 条评论
为什么被折叠?
 到【灌水乐园】发言


