


1.核心函数及核心参数介绍
bar(x,height,width,bottom,color)常用参数意义介绍
x--柱形的标识;
height--纵坐标取值;
width--柱形的宽度;
bottom--纵坐标起始值;
color--柱形的颜色;
备注:前两个参数需给定值,其余参数均可缺省。
上述参数中,color取值与散点图、折线图中均相同,详细取值见文章"matplotlib库:散点图",这里不再赘述。
2.单柱形图实例展示
import matplotlib.pyplot as pltnames = ['小王', '小李', '小赵', '小张', '小孙']weights = [100, 200, 150, 180, 90]plt.rc('font', family='STSong')plt.title('柱形图')rects = plt.bar(x=names, height=weights, width=0.4, color='orange')# 向柱形图上添加数值def autolabel(rects): for rect in rects: height = rect.get_height() x = rect.get_x() width = rect.get_width() plt.annotate(s=height, xy=(x+width/2, height), ha='center', va='bottom', xytext=(0, 1), textcoords='offset points')autolabel(rects)plt.ylabel('体重', fontsize=15)plt.tight_layout()plt.show()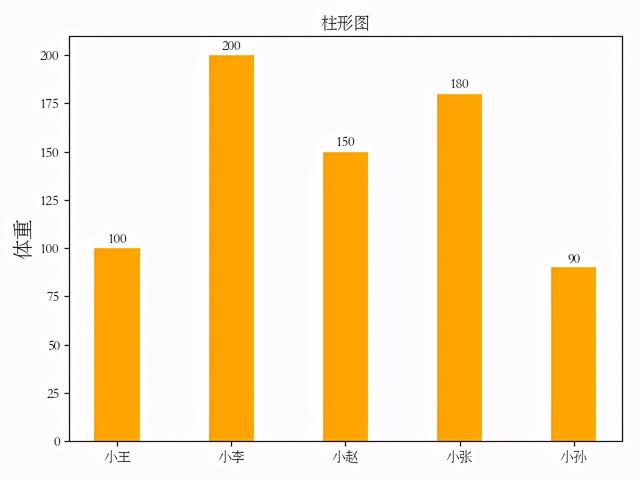
上述代码结果图
3.组合柱形图实例展示
组合柱状图应用场景较多,比如我们想观察到每名学生各科目成绩,为了同时观察到每名学生各科目成绩以及不同学生同一科目成绩情况,此时我们可以采用组合柱状图。我们构造一个班级内几个同学的各科目成绩如下所示。

import numpy as npimport matplotlib.pyplot as plt# 数据subjects = ['English', 'math', 'Chinese', 'Physics', 'Chemistry']wang_scores = [80, 60, 70, 88, 77]zhang_scores = [90, 60, 90, 66, 50]li_scores = [60, 70, 50, 80, 40]x = np.arange(len(subjects))width = 0.25# 向柱形图上添加数值def autolabel(rects): for rect in rects: x = rect.get_x() width = rect.get_width() height = rect.get_height() plt.annotate(s=height, xy=(x+width/2, height), ha='center', va='bottom', xytext=(0, 1), textcoords='offset points')plt.rc('font', family='STSong')plt.title('柱形图')rects1 = plt.bar(x-width, height=wang_scores, width=width, label='小张')rects2 = plt.bar(x, height=zhang_scores, width=width, label='小王')rects3 = plt.bar(x+width, height=li_scores, width=width, label='小李')plt.ylabel('成绩', fontsize=15)plt.gca().set_xticklabels(['']+subjects)autolabel(rects1)autolabel(rects2)autolabel(rects3)plt.legend(loc='upper right')plt.tight_layout()plt.show()
上述代码结果图
参考资料
https://matplotlib.org/api/_as_gen/matplotlib.pyplot.bar.html#matplotlib.pyplot.bar


 8万+
8万+


 被折叠的 条评论
为什么被折叠?
被折叠的 条评论
为什么被折叠?
 到【灌水乐园】发言


