


数字图像个人学习笔记:简单二值化,纯粹个人理解,代码或者论述如有错误请帮我指出!!!
图像的深度如果是8bit,也就是能存储0-255种不同数值,这就是常见的jpg格式的位数,也就是灰度级别。0表示黑色,255表示白色,值越大图片越亮。
图像有RGB三个通道,RGB三个通道的取值都在0-255之间,根据色彩原理可以显示出各种颜色。
下面就是一张常见的三通道图片:

毫无疑问,帅!!!!!!
言归正传,二值化算法就是设定一个“阈值”!假设图片的长宽分别是256和128(灰度图),那么这个图片一共就是256x128=32768个像素点。现在,对每个像素点进行判别,如果这个像素点的值大于“阈值”,就把这个像素值重新赋值为255,也就是白色;如果这个像素点的值小于“阈值”,那么就把这个像素点赋值为0,也就是黑色。
生命苦短,show me code!
import imageio
import numpy as np
import matplotlib.pyplot as plt
idaqi = imageio.imread("idaqi_jieyin.jpg")
def rgb2gray(rgb):
    """
    rgb 2 gray
    Args:
        rgb image
    Returns:
        gray image
    """
    gray = rgb[:, :, 0] * 0.299 + rgb[:, :, 1] * 0.587 + rgb[:, :, 2] * 0.114
    return gray
def thre_bin(image, threshold=170):
    """
    binary image
    """
    threshold_image = np.zeros(shape=(image.shape[0], image.shape[1]), dtype=np.uint8)
    gray = rgb2gray(image)
    # loop for every pixel
    for i in range(gray.shape[0]):
        for j in range(gray.shape[1]):
            if gray[i][j] > threshold:
                threshold_image[i][j] = 255
            else:
                threshold_image[i][j] = 0
    return threshold_image, gray

bin_image, gray = thre_bin(idaqi)
plt.figure()
plt.subplot(1, 2, 1)
plt.imshow(gray/255, cmap="gray")
plt.subplot(1, 2, 2)
plt.imshow(bin_image/255, cmap="gray")
plt.show()
上面包含了两个函数,一个是rgb2gray()用来将彩色图像转为灰度图像,一个是thre_bin(),也就是二值化函数。二值化函数的核心就是双层循环,对每个像素点进行判断并重新赋值,得到了下面的图:
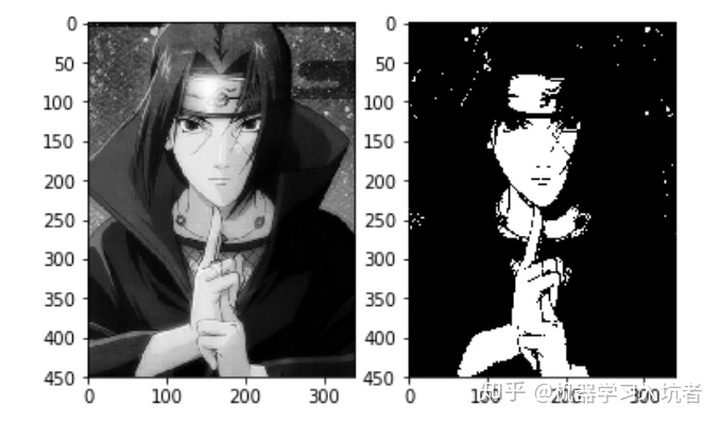
这里threshold也就是阈值的选择是170,这样皮肤这种比较亮的地方就被赋值为255,比较暗的背景和衣服就被赋值为0。换一个threshold=200试一下:

所以,这个算法的参数就是阈值的选择。这仅仅是最简单的二值化算法,后续会补充其它二值化方法。


 9601
9601


 被折叠的 条评论
为什么被折叠?
被折叠的 条评论
为什么被折叠?
 到【灌水乐园】发言


