


前言
玩转ECharts系列,主要为大家讲解我们基于ECharts如何实现企业级大屏项目中较为常用的 各种“奇奇怪怪”的 图表,接下来我们将通过几篇文章从基础图表开始为大家详细讲解实现 这些 图表样式的一些 “小心机” 。分享计划
《如何实现顶端装饰》
《如何实现动态的label颜色》
《如何实现自定义的icon》
《如何实现环形渐变》
《如何实现1/2圆的玫瑰图》
导读
阅读完此文,你会了解基于ECharts: 1、如何实现各种形状的条形 图顶端装饰 2、如何实现环形图的矩形装饰
背景
顶端装饰:顾名思义是在图形的端点处添加一些装饰形状,本文包含“矩形装饰”、“圆形装饰”、“图片装饰”。如图所示,条形图是我们常用的图表,为了增加柱子的美观性,在柱子顶端添加”矩形装饰“,这该如何实现呢?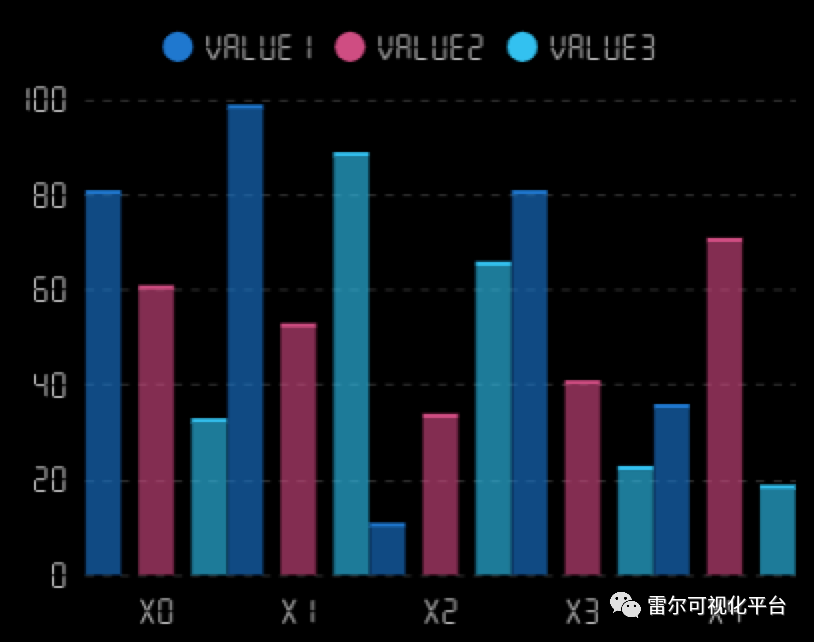
基础实现
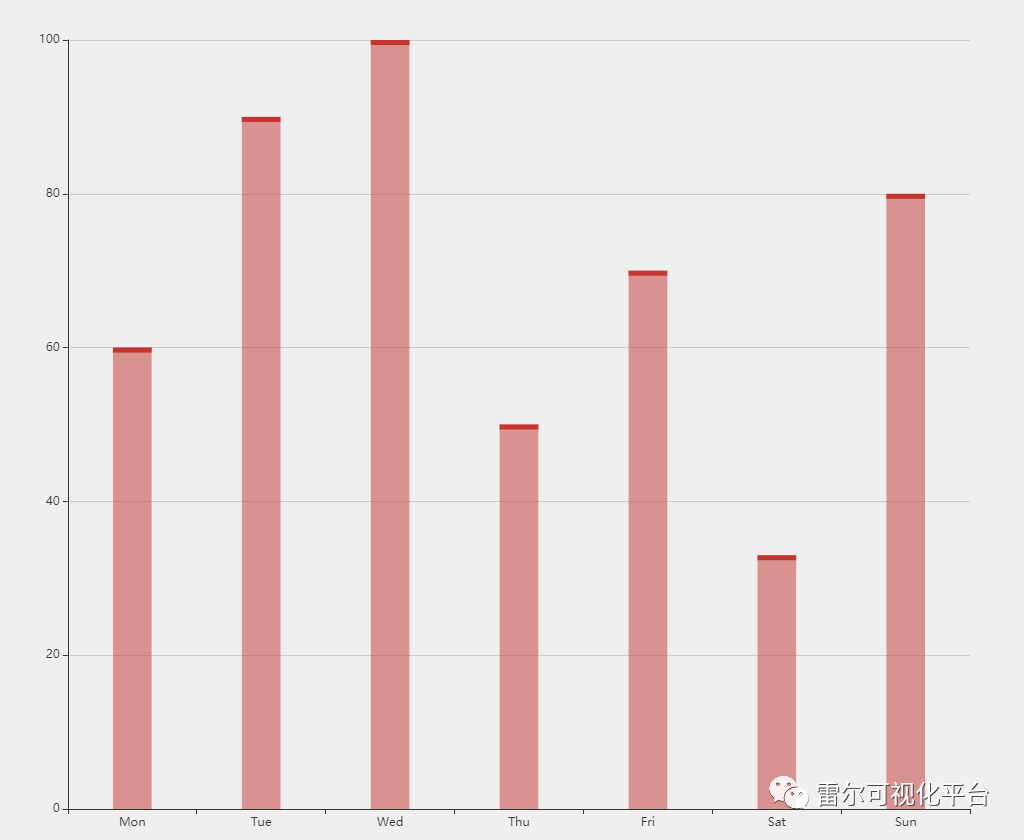
option = { xAxis: { type: 'category', data: ['Mon', 'Tue', 'Wed', 'Thu', 'Fri', 'Sat', 'Sun'] }, yAxis: { type: 'value' }, series: [{ type: 'bar', stack: 'myBar', data: [60, 90, 100, 50, 70, 33, 80], barMaxWidth: '22%', itemStyle: { normal: { opacity: 0.5, color: '#c23531' } } }, { type: 'bar', stack: 'myBar', data: [1, 1, 1, 1, 1, 1, 1], tooltip: { show: false }, barMaxWidth: '22%', itemStyle: { normal: { color: '#c23531' } } }]};1)装饰的高度是由传入的数值经过ECharts自身的算法转换后得到的,不利于灵活的应对数据动态变化的情况;
2)根据不同的实现标准(以装饰顶端还是低端作为读数标准),数据处理和代码实现修改麻烦;
3)需要大量额外的处理来保障在交互响应时装饰与数据bar本身被视为一个整体,比如鼠标移动到装饰上时会出现独立的tooltip;
4)容易影响坐标轴的展示效果,比如上例中y轴的最大值应为100,但显示为120。
为了解决这些问题,笔者推荐使用自定义的方式来实现。参考示例:https://gallery.echartsjs.com/editor.html?c=xgXJrYsd7z&v=7
function renderItem(params, api) { const topCenter = api.coord([api.value(0), api.value(1)]) const height = api.size([0, api.value(1)])[1] const width = api.size([0, 1])[0] * 0.3; const ceilHeight = 10 return { type: 'group', children: [{ type: 'rect', shape: { x: topCenter[0] - width / 2, y: topCenter[1], width: width, height: height }, style: api.style({ opacity: 0.5 }) }, { type: 'rect', shape: { x: topCenter[0] - width / 2, y: topCenter[1], width: width, height: ceilHeight }, style: api.style() } ] }}option = { xAxis: { type: 'category', data: ['Mon', 'Tue', 'Wed', 'Thu', 'Fri', 'Sat', 'Sun'] }, yAxis: { type: 'value' }, series: [{ data: [60, 90, 100, 50, 70, 33, 80], type: 'custom', renderItem: renderItem, }]};可以看到,通过调用回调函数的参数params和api,就能动态的获取矩形的宽高和位置。之后,可以按需直接给定装饰的高度,而不用考虑如何配合ECharts预置的计算方法来保证效果了。
当然,在实际使用时,柱状图往往是由多组series组成的。下例展示了如何对这种情况进行计算。同时,为了保有ECharts柱状图的动画效果,这里采用type. bar和type.custom混合的方式来实现。参考示例:https://gallery.echartsjs.com/editor.html?c=x6eewnhHrH&v=4 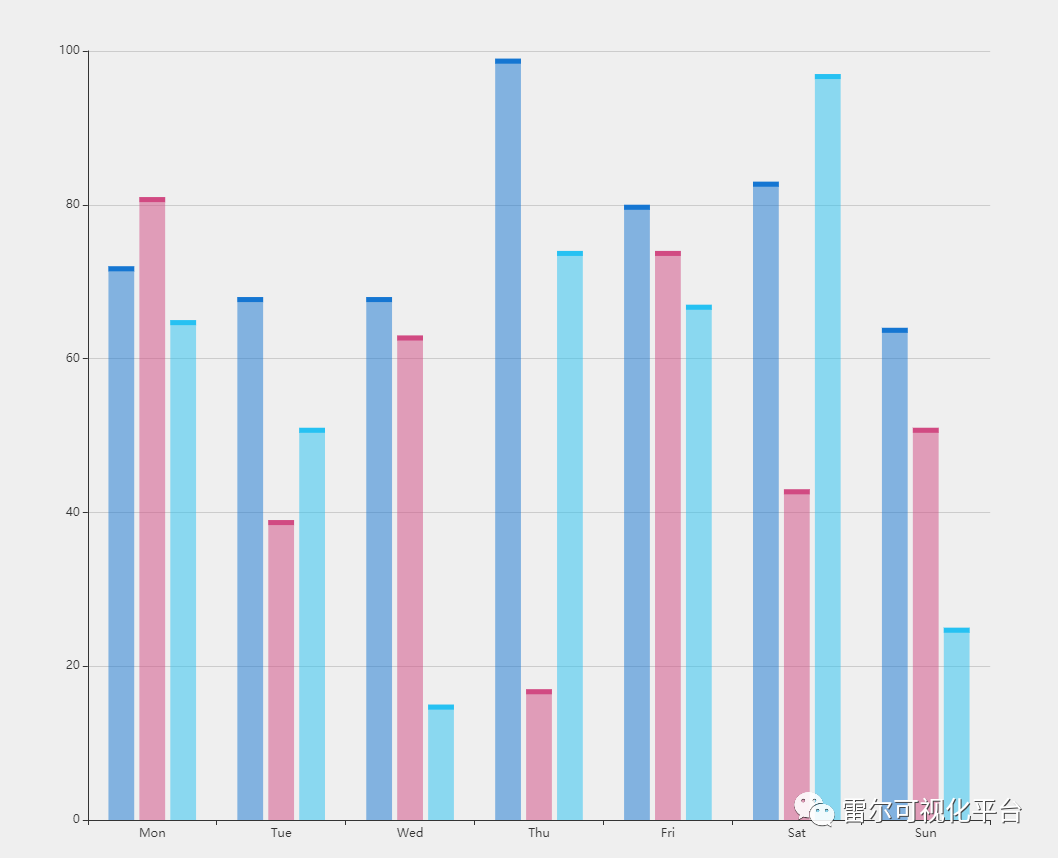
const customSeriesLength = 3const xAxisData = ['Mon', 'Tue', 'Wed', 'Thu', 'Fri', 'Sat', 'Sun']const colors = ["#1576d2", "#d14a82", "#26c1f2", "#a166ff", "#9C2BB6"]const barWidth = 0.2 // 柱条占比const barGap = 0.2 // 不同系列的柱间距离function renderItem(params, api) { const ceilHeight = 5 // 装饰的高度 const topCenter = api.coord([api.value(0), api.value(1)]) // 顶点中心 const unitWidth = api.size([0, 1])[0] const height = api.size([0, api.value(1)])[1] // 高度 const width = unitWidth * barWidth; // 宽度 const unitGapWidth = barGap * barWidth * unitWidth const GapsWidth = (customSeriesLength - 1) * unitGapWidth const showWidth = GapsWidth + width * customSeriesLength const decorateIdx = parseInt(params.seriesName.split('_')[1]) // 绘制时的排序 const xPosi = topCenter[0] - showWidth / 2 + decorateIdx * (width + unitGapWidth) return { type: 'rect', // 装饰 shape: { x: xPosi, y: topCenter[1], width: width, height: height > ceilHeight ? ceilHeight : height }, style: api.style() }}let series = []for (let i = 0; i < customSeriesLength; i++) { const data = xAxisData.map(d => ~~(Math.random() * 100)) const color = colors[i] series.push({ name: 'basicRect_' + i, type: 'bar', barWidth: barWidth * 100 + '%', barGap: barGap * 100 + '%', data: data, itemStyle: { opacity: 0.5, color: color } }) series.push({ name: 'decorateRect_' + i, type: 'custom', renderItem: renderItem, data: data, zlevel: 2, itemStyle: { color: color } })}option = { xAxis: { type: 'category', data: xAxisData }, yAxis: { type: 'value' }, series: series};扩展实现
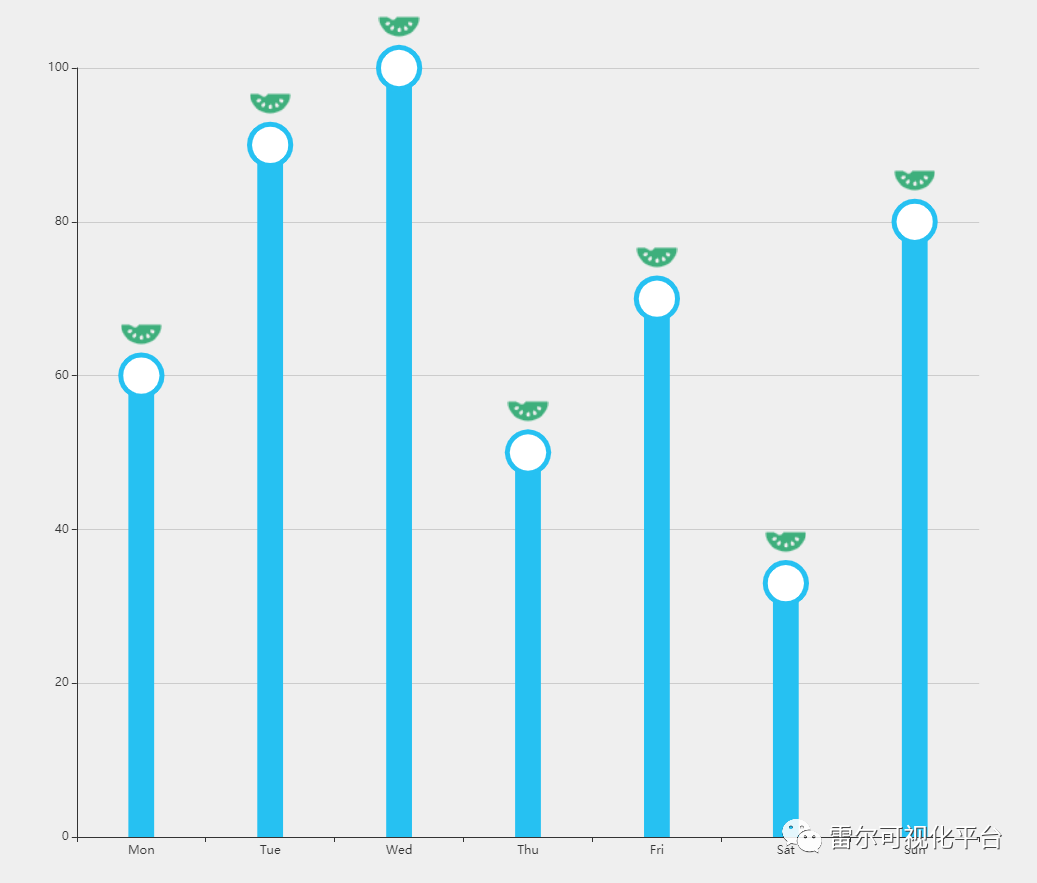
柱状图其他形状的装饰
知道了如何计算位置信息,那么想要再做一些别的效果也就不在话下了。 不论是想要顶个球,还是顶瓜瓜,想顶什么就顶什么。参考示例:https://gallery.echartsjs.com/editor.html?c=x1JrLwF7dO&v=6
饼图末端矩形装饰
基于同样的设计逻辑,我们还可以在环形图中也加入这样的装饰效果。
需要注意的是,饼图的装饰需要使用极坐标系polar来构建。而此时api.coord、api.size返回的是极坐标系下柱状图的相关参数,因此不能直接使用。
参考示例:https://gallery.echartsjs.com/editor.html?c=x_EocBD0B5&v=2

实例展示
这里有一些我们在实际应用中使用的的效果,抛砖引玉,为大家设计时提供一个思路。


 3万+
3万+


 被折叠的 条评论
为什么被折叠?
被折叠的 条评论
为什么被折叠?
 到【灌水乐园】发言


