


李宏毅老师的机器学习视频是机器学习领域经典的中文视频之一,也被称为中文世界中最好的机器学习视频。李老师以幽默风趣的上课风格让很多晦涩难懂的机器学习理论变得轻松易懂,并且老师会通过很多有趣的例子结合机器学习理论在课堂上展现出来,并且逐步推导深奥的理论知识。比如老师会经常用宝可梦来结合很多机器学习算法。对于想入门机器学习又想看中文讲解的人来说绝对是非常推荐的。来自:开源最前线(ID:OpenSourceTop)
综合自:https://github.com/datawhalechina/leeml-notes、https://datawhalechina.github.io/leeml-notes


x_data = [338., 333., 328., 207., 226., 25., 179., 60., 208., 606.]
y_data = [640., 633., 619., 393., 428., 27., 193., 66., 226., 1591.]
x_d = np.asarray(x_data)
y_d = np.asarray(y_data)
# linear regression
b = -120
w = -4
lr = 0.0000001
iteration = 100000

b_history = [b]
w_history = [w]

import time
start = time.time()
for i in range(iteration):
    b_grad=0.0
    w_grad=0.0
    for n in range(len(x_data))
        b_grad=b_grad-2.0*(y_data[n]-n-w*x_data[n])*1.0
         w_grad= w_grad-2.0*(y_data[n]-n-w*x_data[n])*x_data[n]

    # update param
    b -= lr * b_grad
    w -= lr * w_grad

    b_history.append(b)
    w_history.append(w)
# plot the figure
plt.subplot(1, 2, 1)
C = plt.contourf(x, y, Z, 50, alpha=0.5, cmap=plt.get_cmap('jet')) # 填充等高线
# plt.clabel(C, inline=True, fontsize=5)
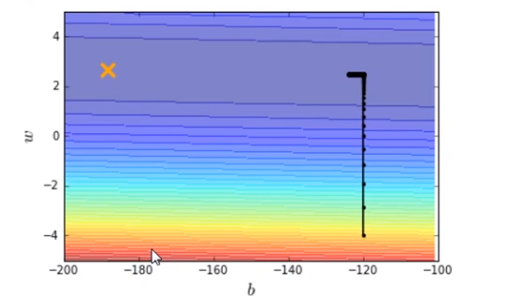
plt.plot([-188.4], [2.67], 'x', ms=12, mew=3, color="orange")
plt.plot(b_history, w_history, 'o-', ms=3, lw=1.5, color='black')
plt.xlim(-200, -100)
plt.ylim(-5, 5)
plt.xlabel(r'$b$')
plt.ylabel(r'$w$')
plt.title("线性回归")
plt.subplot(1, 2, 2)
loss = np.asarray(loss_history[2:iteration])
plt.plot(np.arange(2, iteration), loss)
plt.title("损失")
plt.xlabel('step')
plt.ylabel('loss')
plt.show()
输出结果如图

除了内容丰富充实之外,创建者还专门整理了一个在线阅读的网站,在线阅读十分方便
地址:https://datawhalechina.github.io/leeml-notes
李宏毅视频教程在线观看地址:https://www.bilibili.com/video/av59538266
●编号3979,输入编号直达本文
●输入m获取文章目录
推荐↓↓↓
开源最前线


 2909
2909


 被折叠的 条评论
为什么被折叠?
被折叠的 条评论
为什么被折叠?
 到【灌水乐园】发言


