点击上方蓝色字体“高中数学王晖”关注王晖老师,免费获取各种知识干货和学习经验~~~您的点赞转发是对老师的最大鼓舞~~~
距高考还有298天

定义法
运用解析几何中一些常用定义(例如圆,椭圆,双曲线和抛物线),可从曲线定义出发直接写出轨迹方程,或从曲线定义出发建立关系式,从而求出轨迹方程。
常见一些基本曲线的定义如下:
①圆:到定点的距离等于定长
②椭圆:到两定点的距离之和为常数(大于两定点的距离)
③双曲线:到两定点距离之差的绝对值为常数(小于两定点的距离)
④抛物线:到定点与定直线距离相等。
例题:已知圆(x+4)
2
+y
2
=25的圆心为M
1
,圆(x-4)
2
+y
2
=1的圆心为M
2
,一动圆与这两个圆外切,求动圆圆心P的轨迹方程。


备注:
算出轨迹方程之后,要结合题意,注明变量x,y的范围
变式1:
一动圆M与圆O
1
:x
2
+y
2
=1外切,而与圆O
2
:x
2
+y
2
-6x+8=0内切,那么动圆圆心M的轨迹方程。
变式2:
若B(-8,0),C(8,0)为△ABC的两顶点,AC和AB两边上的中线长之和为30,求△ABC的重心轨迹方程。
直接法
如果动点运动的条件就是一些几何量的等量关系(几何、三角或者向量表达式等),这些条件简单明确,易于表述成含x,y的等式,就得到轨迹方程,这种方法称之为直接法。
直接法解题步骤如下:
① 设点:设动点的坐标为(x,y)
② 列式:根据题目已知条件得到等量关系式
③ 化简:整合关系式
④ 范围:确认变量x,y的取值情况
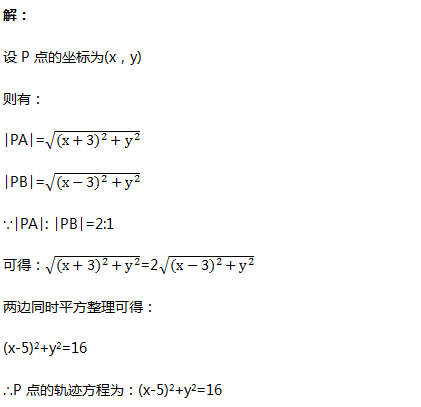
例题:动点P到两个定点A(-3,0)和B(3,0)的距离之比等于2,即│PA│: │PB│=2:1,求动点P的轨迹方程。
变式1:
点M(x,y)到直线x=8的距离和它到定点F(1,0)的距离的比为2,则求动点M的轨迹方程。
变式2:
分别过A
1
(-1,0),A
2
(1,0)作两条互相垂直的直线,则求它们的交点M的轨迹方程。
几何法
若所求的轨迹满足某些几何性质(如直线垂直,线段垂直平分线,角平分线,直角三角形斜边中线等于斜边一半等),可以列出几何等式,再带入点坐标求出轨迹方程,这种方法被称为几何法。
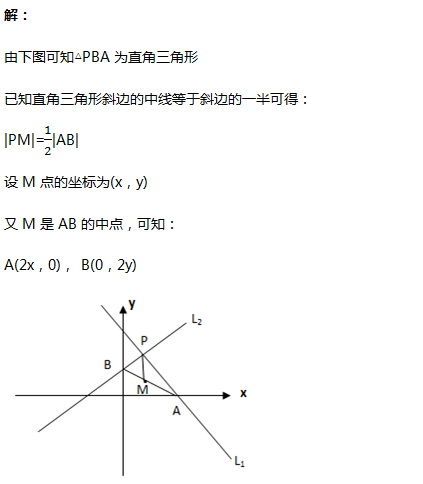
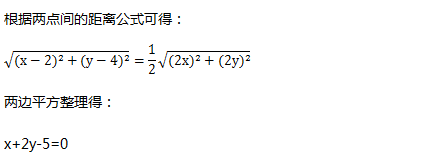
例题:过点P(2,4)做两条互相垂直的直线L
1
,L
2
,若L
1
交x轴于A点,L
2
交y轴于B点,求线段AB的中点M的轨迹方程。
 变式:
过圆O:x
2
+y
2
=4外一点A(4,0),作圆的割线,求割线被圆截的的弦BC中点M的轨迹方程。
变式:
过圆O:x
2
+y
2
=4外一点A(4,0),作圆的割线,求割线被圆截的的弦BC中点M的轨迹方程。
相关点法
动点所满足的条件不易表述或求出,但形成轨迹的动点P(x,y)却随另一动点Q
(x
0
,y
0
)
的运动而有规律的运动,且动点Q的轨迹为给定或容易求得,则可先将x
0
,
y
0
表示为x,y的式子,再代入Q的轨迹方程,然而整理得P的轨迹方程,称为相关点法。
相关点法解题步骤:
①
设形成轨迹的动点P坐标为(x,y);
② 设点Q的坐标为
(x
0
,y
0
),且有F(x
0
,y
0
)=0;
③ 动点P随着点Q有规律的运用可得:x
0
=f
(x,y),y
0
=g(x,y);
④ 把x
0
=f
(x,y),y
0
=g(x,y)带入F(x
0
,y
0
)=0,即可求出点P的轨迹方程。
例题:
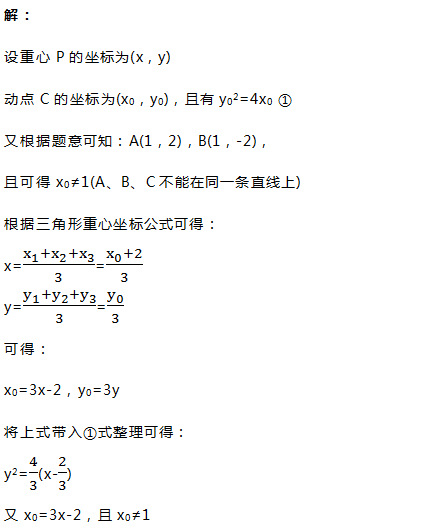
抛物线y
2
=4x的通径与抛物线交于A、B两点,动点C在抛物线上,求△ABC重心P的轨迹方程。
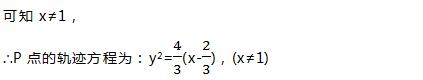
变式1:从双曲线x2-y2=1上一点Q引直线x+y=2的垂线,垂足为N,求线段QN的中点P的轨迹方程。
变式2:设点M(-3,4),动点N在圆x2+y2=4上运动,以OM,ON为两边作平行四边形MONP,求点P的轨迹方程。
参数法
有时很难直接找出动点的横、纵坐标之间关系。
如果借助中间量(参数),使x,y之间的关系建立起联系,然后再从所求式子中消去参数,便可得动点的轨迹方程,这种方法被称作参数法。
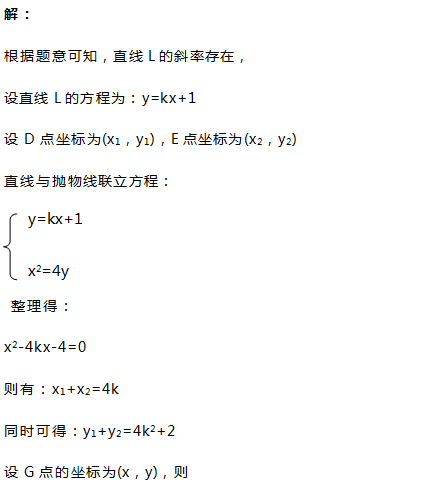
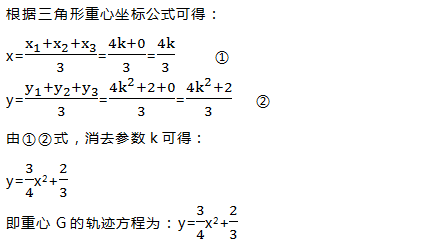
例题:过点A(0,1)做直线L与抛物线:x2=4y交于D,E两点,O为坐标原点,求△ODE的重心G的轨迹方程。
变式:
设抛物线y
2=4x的准线为L,焦点为F,顶点为O,P为抛物线上任意一点,又PQ⊥L,Q为垂足,求QF与OP的交点M的轨迹方程。
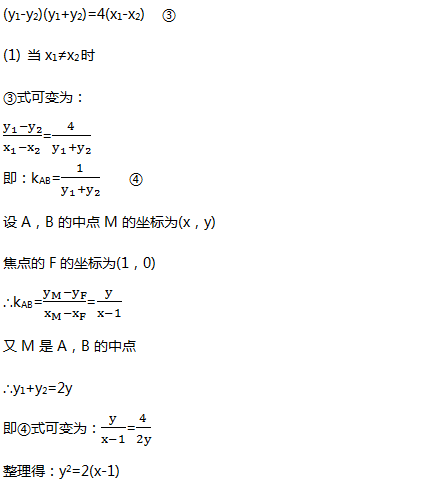
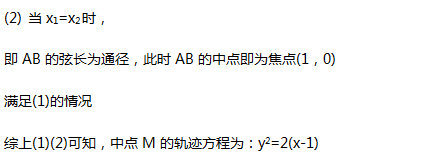
点差法
若设直线与圆锥曲线的交点坐标为A(x1,y1)、B(x2,y2),将这两点带入圆锥曲线的方程并对所得两式做差,得到一个与弦AB的中点和斜率有关的式子,可以大大减少运算量。我们称这种带点做差的方法为“点差法”。点差法对于解决弦中点轨迹问题非常有效。
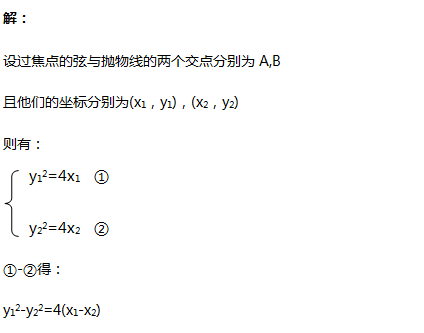
例题:
求抛物线y
2
=4x的过焦点F的弦的中点M的轨迹方程。
变式:
过原点的直线L和抛物线y=x
2
-4x+6交于A、B两点,求线段AB的中点M的轨迹方程。
交轨法
在求动点轨迹时,有时会出现要求两动曲线交点的轨迹问题,这种问题通常通过解方程组得出交点(含参数)的坐标,再消去参数求得所求的轨迹方程,该法通常与参数法同时使用。
交轨法解题步骤:
①根据题意已知动曲线F(x,y)=0和动曲线G(x,y)=0相交于点P,设动点P的坐标为(x,y)
②将F(x,y)=0与G(x,y)=0联立,求得交点坐标即可。
备注:
得到的交点坐标通常含有参数,还会有一个消参的过程。
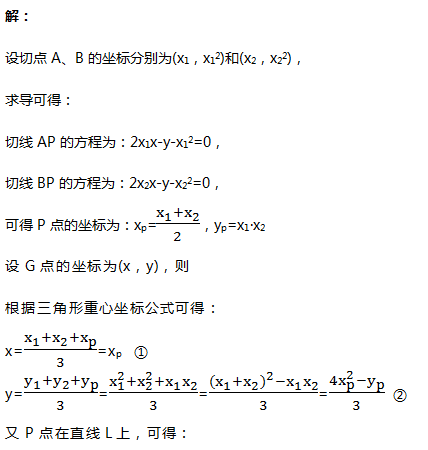
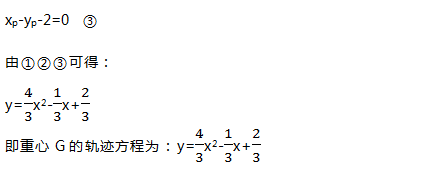
例题:如图,已知抛物线C:y=x2,动点P在直线L:x-y-2=0上运动,过点P作抛物线C的两条切线PA,PB,且与抛物线C分别相切于A、B两点,求△APB的中心G的轨迹方程。
变式:
已知椭圆:x
2
/3+y
2
/2=1的左,右焦点分别为F
1
和F
2
,直线L
1
过F
2
且与x轴垂直,动直线L
2
与y轴垂直,L
2
交L
1
于点P。求线段PF
1
的垂直平分线与直线L的交点M的轨迹
方程.
往期优质数学干货链接:
【雨后春笋】圆锥曲线离心率的超全汇总------再不会就真的没办法了!!!
【器宇不凡】圆锥曲线最值的七大必考题型------你值得拥有!!!
【发人深思】高中数学新教材总体介绍------主编章教授是这样解读的!!!
【镜花水月】三角变换中“巧变角”的模型汇总------全是你想要的!!!
【厚德载物】洛必达法则需要这样用,时刻警惕这四大误区!!!


 这篇博客通过变式问题解析了如何求解动点轨迹方程,包括从双曲线上的点引直线垂线的中点轨迹以及平行四边形对角线构造的点的轨迹。同时,博客提及了Hausdorff距离在求解两条轨迹间距离的应用,为数学学习者提供了丰富的解题思路。


 3792
3792

 被折叠的 条评论
为什么被折叠?
被折叠的 条评论
为什么被折叠?
 到【灌水乐园】发言


