


Perform the one-sample Kolmogorov-Smirnov test by using kstest. Confirm the test decision by visually comparing the empirical cumulative distribution function (cdf) to the standard normal cdf.
Load the examgrades data set. Create a vector containing the first column of the exam grade data.
load examgrades
test1 = grades(:,1);
Test the null hypothesis that the data comes from a normal distribution with a mean of 75 and a standard deviation of 10. Use these parameters to center and scale each element of the data vector, because kstest tests for a standard normal distribution by default.
x = (test1-75)/10;
h = kstest(x)
h = logical
0
The returned value of h = 0 indicates that kstest fails to reject the null hypothesis at the default 5% significance level.
Plot the empirical cdf and the standard normal cdf for a visual comparison.
cdfplot(x)
hold on
x_values = linspace(min(x),max(x));
plot(x_values,normcdf(x_values,0,1),'r-')
legend('Empirical CDF','Standard Normal CDF','Location','best')
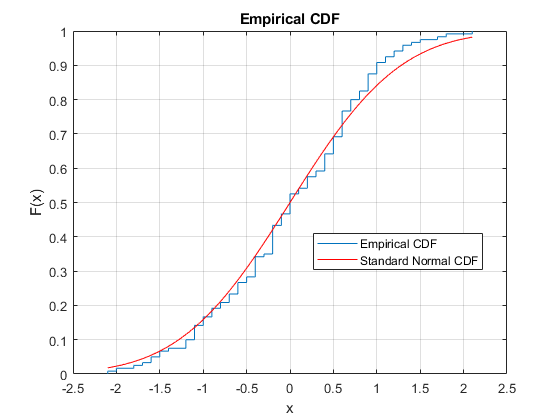
The figure shows the similarity between the empirical cdf of the centered and scaled data vector and the cdf of the standard normal distribution.


 1836
1836


 被折叠的 条评论
为什么被折叠?
被折叠的 条评论
为什么被折叠?
 到【灌水乐园】发言


