


本来不接Echarts任务的,但无奈还是得做,要求legend字体都不相同,容许下载并有水印,api查询,文档查看,终于有了以下代码。
HTML 代码
<!DOCTYPE html>
<html lang="en">
<head>
    <meta charset="UTF-8">
    <meta http-equiv="X-UA-Compatible" content="IE=edge">
    <meta name="viewport" content="width=device-width, initial-scale=1.0">
    <title></title>
</head>
<body>
  <div id="main" style="height:500px;"></div>
</body>
<script src="./node_modules/echarts/dist/echarts.min.js"></script>
<script src="./index.js"></script>
</html>
JS
// 基于准备好的dom,初始化echarts实例
var DOM = document.getElementById('main');
var myChart = echarts.init(DOM);
// 指定图表的配置项和数据
// 添加水印 全屏水印
const waterMarkText = 'OneSight';
const canvas = document.createElement('canvas');
const ctx = canvas.getContext('2d');
canvas.width = canvas.height = 100;
ctx.textAlign = 'center';
ctx.textBaseline = 'middle';
ctx.globalAlpha = 0.08;
ctx.font = '20px Microsoft Yahei';
ctx.translate(50, 50);
ctx.rotate(-Math.PI / 4);
ctx.fillText(waterMarkText, 0, 0);
// 饼图信息
var option = {
backgroundColor: {//在背景属性中添加
type: 'pattern',
image: canvas,
repeat: 'repeat'
},
tooltip: {
trigger: 'item'
},
legend: {
orient: 'vertical',
itemWidth: 12,
itemHeight: 12,
top: 'center',
x: '55%',
y: '17%',
align: 'left',
verticalAlign: 'top',
inactiveColor: "#cccccc",
textStyle: {
inactiveColor: "#cccccc",
rich: { // 设置一些默认字体样式
name: {
fontSize: 12,
padding: [112, 0, 2, 0],
},
like: {
color: "#7A8283",
inactiveColor: "#cccccc",
align: "left",
},
percent: {
color: "#7A8283",
inactiveColor: "#cccccc",
align: "left",
},
bold: {
color: "#273333",
fontWeight: "bold",
padding: [0, 0, 0, 0]
},
paddingBold: {
color: "#273333",
fontWeight: "bold",
padding: [112, 0, 2, 0],
},
other: {
fontSize: 12,
padding: [0, 0, 0, 0],
},
},
},
formatter: (text) => {
return `{bold| ${text}} {percent| ${'|'}} {like| ${text}}`;
}
},
// // 单个水印
// graphic: {
// elements: [
// {
// type: 'text',
// right: 160,
// bottom: 60,
// style: {
// text: 'OneSight',
// font: 'bolder 80px monospace',
// fill: 'rgba(100, 100, 100, 0.25)'
// },
// z: 100
// }
// ]
// },
// // 单个水印 + 背景
graphic: [{
type: 'group',
rotation: Math.PI / 4, //正方形旋转的角度
bounding: 'raw',
right: 50,
bottom: 45,
z: 100,
children: [
{
type: 'rect',
left: 'center',//描述怎么根据父元素进行定位
top: 'center',//描述怎么根据父元素进行定位
z: 100,
shape: {
width: 170,
height: 30
},
style: {
fill: 'rgba(0,0,0,0.3)'
}
},
{
type: 'text',
left: 'center',
top: 'center',
right: 'center',
z: 100,
style: {
fill: '#fff',
text: 'OneSight',
font: 'bolder 14px Microsoft YaHei',
}
}
]
}],
series: [
{
name: 'Access From',
type: 'pie',
radius: ['40%', '70%'], // 饼图、半径和直径
center: ['30%', '50%'], // 饼图位置
avoidLabelOverlap: false,
label: {
show: false,
position: 'center'
},
emphasis: {
label: {
show: true,
fontSize: '40',
fontWeight: 'bold'
}
},
labelLine: {
show: false
},
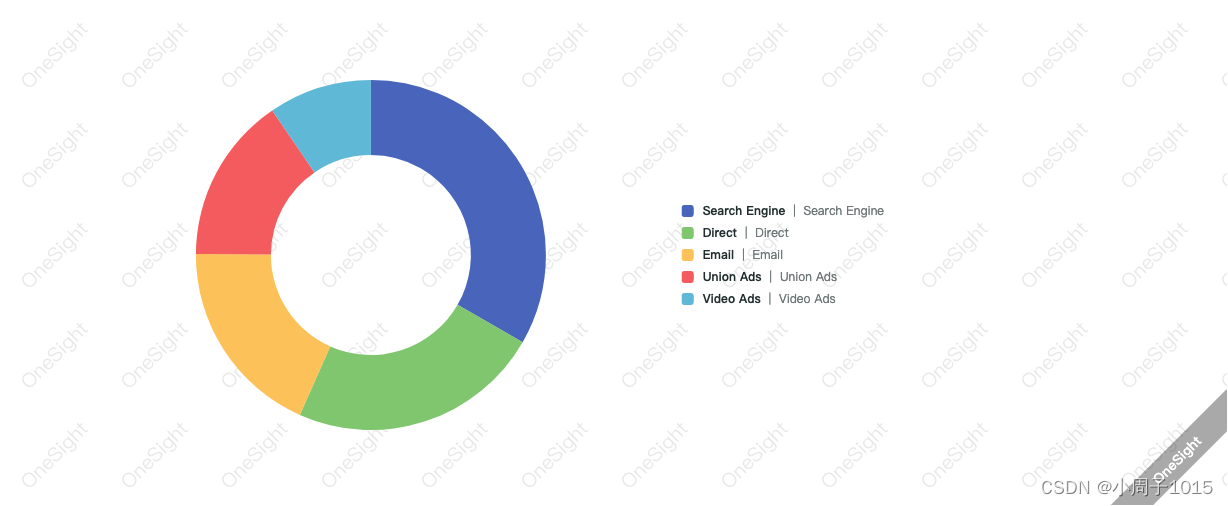
data: [
{ value: 1048, name: 'Search Engine' },
{ value: 735, name: 'Direct' },
{ value: 580, name: 'Email' },
{ value: 484, name: 'Union Ads' },
{ value: 300, name: 'Video Ads' }
]
}
]
};
// 使用刚指定的配置项和数据显示图表。
myChart.setOption(option);
// 页面加载完成
window.onload = () => {
let timer = null;
// 监听页面变化
window.onresize = function () {
// 如果存在定时器,清楚定时器
if (timer) {
clearTimeout(timer);
}
// 重绘Echarts
timer = setTimeout(() => {
myChart.resize();
}, 1000);
}
}
结果图像
到这里记录就完成,一个简单的饼图和一些字体特殊处理完成,添加水印,有喜欢的可以拿走。


 1665
1665

 被折叠的 条评论
为什么被折叠?
被折叠的 条评论
为什么被折叠?
 到【灌水乐园】发言


