


随机抽样
numpy.random 模块对 Python 内置的 random 进行了补充,增加了一些用于高效生成多种概率分布的样本值的函数,如正态分布、泊松分布等。
numpy.random.seed(seed=None)Seed the generator.
seed()用于指定随机数生成时所用算法开始的整数值,如果使用相同的seed()值,则每次生成的随机数都相同,如果不设置这个值,则系统根据时间来自己选择这个值,此时每次生成的随机数因时间差异而不同。
在对数据进行预处理时,经常加入新的操作或改变处理策略,此时如果伴随着随机操作,最好还是指定唯一的随机种子,避免由于随机的差异对结果产生影响。
离散型随机变量
二项分布
二项分布可以用于只有一次实验只有两种结果,各结果对应的概率相等的多次实验的概率问题。比如处理猜10次拳赢6次的概率等类似的问题。
二项分布概率函数的代码表示:binom.pmf(k) = choose(n, k) p**k (1-p)**(n-k)
二项分布概率函数的数学表示:

numpy.random.binomial(n, p, size=None)Draw samples from a binomial distribution.
表示对一个二项分布进行采样,size表示采样的次数,n表示做了n重伯努利试验,p表示成功的概率,函数的返回值表示n中成功的次数。
【例】野外正在进行9(n=9)口石油勘探井的发掘工作,每一口井能够开发出油的概率是0.1(p=0.1)。请问,最终所有的勘探井都勘探失败的概率?
import numpy as np
import matplotlib.pyplot as plt
from scipy import stats

np.random.seed(20200605)
n = 9# 做某件事情的次数
p = 0.1# 做某件事情成功的概率
size = 50000
x = np.random.binomial(n, p, size)
'''或者使用binom.rvs
#使用binom.rvs(n, p, size=1)函数模拟一个二项随机变量,可视化地表现概率
y = stats.binom.rvs(n, p, size=size)#返回一个numpy.ndarray
'''
print(np.sum(x == 0) / size)  # 0.3897

plt.hist(x)
plt.xlabel('随机变量:成功次数')
plt.ylabel('样本中出现的次数')
plt.show()
#它返回一个列表,列表中每个元素表示随机变量中对应值的概率
s = stats.binom.pmf(range(10), n, p)
print(np.around(s, 3))
# [0.387 0.387 0.172 0.045 0.007 0.001 0.    0.    0.    0.   ]
【例】模拟投硬币,投2次,请问两次都为正面的概率?
import numpy as np
from scipy import stats
import matplotlib.pyplot as plt

np.random.seed(20200605)
n = 2# 做某件事情的次数,这里是投两次硬币
p = 0.5#做某件事情成功的概率,在这里即投硬币为正面的概率
size = 50000
x = np.random.binomial(n, p, size)
'''或者使用binom.rvs
#使用binom.rvs(n, p, size=1)函数模拟一个二项随机变量,可视化地表现概率
y = stats.binom.rvs(n, p, size=size)#返回一个numpy.ndarray
'''
print(np.sum(x == 0) / size)  # 0.25154
print(np.sum(x == 1) / size)  # 0.49874
print(np.sum(x == 2) / size)  # 0.24972

plt.hist(x, density=True)
plt.xlabel('随机变量:硬币为正面次数')
plt.ylabel('50000个样本中出现的次数')
plt.show()
#它返回一个列表,列表中每个元素表示随机变量中对应值的概率
s = stats.binom.pmf(range(n + 1), n, p)
print(np.around(s, 3))
# [0.25 0.5  0.25]
#计算期望和方差
'''
期望:E(x) = np
方差:Var(x) = np(1-p)
利用stats.binom.stats(n, p, loc=0, moments='mv')计算期望和方差
moments参数中:m为期望,v为方差
'''
泊松分布
泊松分布主要用于估计某个时间段某事件发生的概率。
泊松概率函数的代码表示:poisson.pmf(k) = exp(-lam) lam*k / k!
泊松概率函数的数学表示:

numpy.random.poisson(lam=1.0, size=None)Draw samples from a Poisson distribution.
表示对一个泊松分布进行采样,size表示采样的次数,lam表示一个单位内发生事件的平均值,函数的返回值表示一个单位内事件发生的次数。
【例】假定某航空公司预定票处平均每小时接到42次订票电话,那么10分钟内恰好接到6次电话的概率是多少?
import numpy as np
from scipy import stats
import matplotlib.pyplot as plt

np.random.seed(20200605)
lam = 42 / 6# 平均值:平均每十分钟接到42/6次订票电话
size = 50000
x = np.random.poisson(lam, size)
'''或者
#模拟服从泊松分布的50000个随机变量
x = stats.poisson.rvs(lam,size=size)
'''
print(np.sum(x == 6) / size)  # 0.14988

plt.hist(x)
plt.xlabel('随机变量:每十分钟接到订票电话的次数')
plt.ylabel('50000个样本中出现的次数')
plt.show()
#用poisson.pmf(k, mu)求对应分布的概率:概率质量函数 (PMF)
x = stats.poisson.pmf(6, lam)
print(x)  # 0.14900277967433773
超几何分布
在超几何分布中,各次实验不是独立的,各次实验成功的概率也不等。 超几何分布概率函数的数学表示:
numpy.random.hypergeometric(ngood, nbad, nsample, size=None)Draw samples from a Hypergeometric distribution.
表示对一个超几何分布进行采样,size表示采样的次数,ngood表示总体中具有成功标志的元素个数,nbad表示总体中不具有成功标志的元素个数,ngood+nbad表示总体样本容量,nsample表示抽取元素的次数(小于或等于总体样本容量),函数的返回值表示抽取nsample个元素中具有成功标识的元素个数。
【例】一共20只动物里有7只是狗,抽取12只有3只狗的概率(无放回抽样)。
import numpy as np
from scipy import stats
import matplotlib.pyplot as plt

np.random.seed(20200605)
size = 500000
x = np.random.hypergeometric(ngood=7, nbad=13, nsample=12, size=size)
'''或者
#用rvs(M, n, N, loc=0, size=1, random_state=None)模拟
x = stats.hypergeom.rvs(M=20,n=7,N=12,size=size)
'''
print(np.sum(x == 3) / size)  # 0.198664

plt.hist(x, bins=8)
plt.xlabel('狗的数量')
plt.ylabel('50000个样本中出现的次数')
plt.title('超几何分布',fontsize=20)
plt.show()

"""
M 为总体容量
n 为总体中具有成功标志的元素的个数
N,k 表示抽取N个元素有k个是成功元素
"""
x = range(8)
#用hypergeom.pmf(k, M, n, N, loc)来计算k次成功的概率
s = stats.hypergeom.pmf(k=x, M=20, n=7, N=12)
print(np.round(s, 3))
# [0.    0.004 0.048 0.199 0.358 0.286 0.095 0.01 ]
'''
超几何分布的均值与方差

均值E(x) = N(n/M)
方差Var(x) = N(n/M)(1-n/M)((M-N)/(M-1))
注释:考虑n次实验的超几何分布,令p=n/M,当总体容量足够大时((M-N)/(M-1))近似于1,此时数学期望为Np,方差为Np(1-p).
#用stats(M, n, N, loc=0, moments='mv')计算均值和方差
stats.hypergeom.stats(20,7,12,moments='mv')
'''
连续型随机变量
均匀分布
numpy.random.uniform(low=0.0, high=1.0, size=None)Draw samples from a uniform distribution.
Samples are uniformly distributed over the half-open interval [low, high) (includes low, but excludes high). In other words, any value within the given interval is equally likely to be drawn by uniform.
【例】在low到high范围内,创建大小为size的均匀分布的随机数。
import numpy as np
import matplotlib.pyplot as plt
from scipy import stats

np.random.seed(20200614)
a = 0
b = 100
size = 50000
x = np.random.uniform(a, b, size=size)
print(np.all(x >= 0))  # True
print(np.all(x < 100))  # True
y = (np.sum(x < 50) - np.sum(x < 10)) / size
print(y)  # 0.40144

plt.hist(x, bins=20)
plt.show()

a = stats.uniform.cdf(10, 0, 100)
b = stats.uniform.cdf(50, 0, 100)
print(b - a)  # 0.4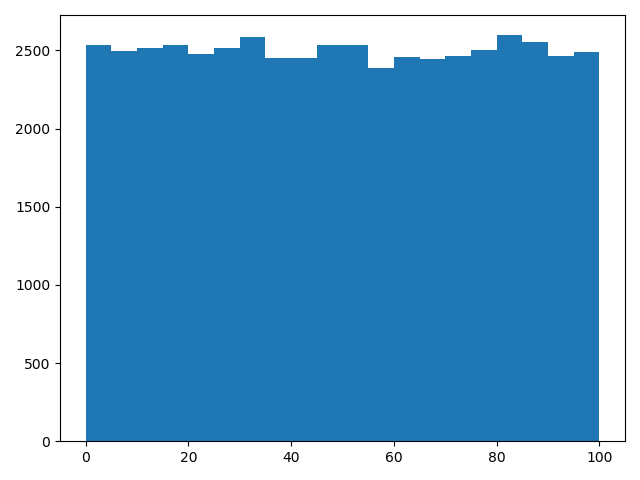
作为uniform()的特列,可以得到[0,1)之间的均匀分布的随机数。
numpy.random.rand(d0, d1, ..., dn)Random values in a given shape.
Create an array of the given shape and populate it with random samples from a uniform distribution over [0, 1).
【例】根据指定大小产生[0,1)之间均匀分布的随机数。
import numpy as np

np.random.seed(20200614)
print(np.random.rand())
# 0.7594819171852776

print(np.random.rand(5))
# [0.75165827 0.16552651 0.0538581  0.46671446 0.89076925]

print(np.random.rand(4, 3))
# [[0.10073292 0.14624784 0.40273923]
#  [0.21844459 0.22226682 0.37246217]
#  [0.50334257 0.01714939 0.47780388]
#  [0.08755349 0.86500477 0.70566398]]

np.random.seed(20200614)
print(np.random.uniform())  # 0.7594819171852776
print(np.random.uniform(size=5))
# [0.75165827 0.16552651 0.0538581  0.46671446 0.89076925]

print(np.random.uniform(size=(4, 3)))
# [[0.10073292 0.14624784 0.40273923]
#  [0.21844459 0.22226682 0.37246217]
#  [0.50334257 0.01714939 0.47780388]
# [0.08755349 0.86500477 0.70566398]]作为uniform的另一特例,可以得到[low,high)之间均匀分布的随机整数。
numpy.random.randint(low, high=None, size=None, dtype='l')Return random integers fromlow(inclusive) tohigh(exclusive).
Return random integers from the “discrete uniform” distribution of the specified dtype in the “half-open” interval [low, high). If high is None (the default), then results are from [0, low).
【例】若high不为None时,取[low,high)之间随机整数,否则取值[0,low)之间随机整数。
import numpy as np

np.random.seed(20200614)
x = np.random.randint(2, size=10)
print(x)
# [0 0 0 1 0 1 0 0 0 0]

x = np.random.randint(1, size=10)
print(x)
# [0 0 0 0 0 0 0 0 0 0]

x = np.random.randint(5, size=(2, 4))
print(x)
# [[3 3 0 1]
#  [1 1 0 1]]

x = np.random.randint(1, 10, [3, 4])
print(x)
# [[2 1 7 7]
#  [7 2 4 6]
#  [8 7 2 8]]
正态分布
标准正态分布数学表示:
numpy.random.randn(d0, d1, ..., dn)Return a sample (or samples) from the "standard normal" distribution.
【例】根据指定大小产生满足标准正态分布的数组(均值为0,标准差为1)。
import numpy as np
import matplotlib.pyplot as plt
from scipy import stats

np.random.seed(20200614)
size = 50000
x = np.random.randn(size)
y1 = (np.sum(x < 1) - np.sum(x < -1)) / size
y2 = (np.sum(x < 2) - np.sum(x < -2)) / size
y3 = (np.sum(x < 3) - np.sum(x < -3)) / size
print(y1)  # 0.68596
print(y2)  # 0.95456
print(y3)  # 0.99744

plt.hist(x, bins=20)
plt.show()

y1 = stats.norm.cdf(1) - stats.norm.cdf(-1)
y2 = stats.norm.cdf(2) - stats.norm.cdf(-2)
y3 = stats.norm.cdf(3) - stats.norm.cdf(-3)
print(y1)  # 0.6826894921370859
print(y2)  # 0.9544997361036416
print(y3)  # 0.9973002039367398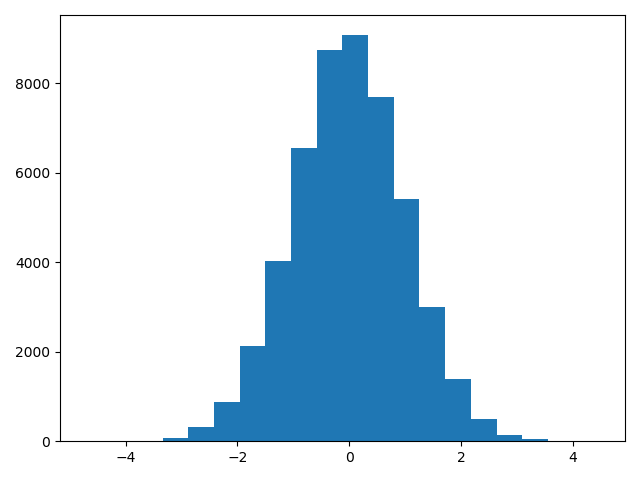
还可以指定分布以及所需参数来进行随机,例如高斯分布中的mu和sigma。
numpy.random.normal(loc=0.0, scale=1.0, size=None)Draw random samples from a normal (Gaussian) distribution.
normal()为创建均值为 loc(mu),标准差为 scale(sigma),大小为 size 的数组。
sigma * np.random.randn(...) + mu【例】
import numpy as np
import matplotlib.pyplot as plt

np.random.seed(20200614)
x = 0.5 * np.random.randn(2, 4) + 5
'''或者
#模拟10000个随机变量
x = 0.5*stats.norm.rvs(size=(2,4))+5
'''
print(x)
# [[5.39654234 5.4088702  5.49104652 4.95817289]
#  [4.31977933 4.76502391 4.70720327 4.36239023]]

np.random.seed(20200614)
mu = 5#平均值
sigma = 0.5#标准差
x = np.random.normal(mu, sigma, (2, 4))
print(x)
# [[5.39654234 5.4088702  5.49104652 4.95817289]
#  [4.31977933 4.76502391 4.70720327 4.36239023]]

size = 50000
x = np.random.normal(mu, sigma, size)

print(np.mean(x))  # 4.996403463175092
print(np.std(x, ddof=1))  # 0.4986846716715106(#样本标准差)
'''
ddof:int, optional
Means Delta Degrees of Freedom. The divisor used in calculations is N - ddof, where N represents the number of elements. By default ddof is zero.
'''
plt.hist(x, bins=20)
plt.show()
指数分布
指数分布描述时间发生的时间长度间隔。
指数分布的数学表示:
numpy.random.exponential(scale=1.0, size=None)Draw samples from an exponential distribution.
【例】scale = 1/lambda
import numpy as np
import matplotlib.pyplot as plt
from scipy import stats

np.random.seed(20200614)
lam = 7
size = 50000
x = np.random.exponential(1 / lam, size)
'''或者
#rvs(loc=0, scale=1/lam, size=size, random_state=None)模拟
'''
y1 = (np.sum(x < 1 / 7)) / size
y2 = (np.sum(x < 2 / 7)) / size
y3 = (np.sum(x < 3 / 7)) / size
print(y1)  # 0.63218
print(y2)  # 0.86518
print(y3)  # 0.95056

plt.hist(x, bins=20)
plt.show()

y1 = stats.expon.cdf(1 / 7, scale=1 / lam)
y2 = stats.expon.cdf(2 / 7, scale=1 / lam)
y3 = stats.expon.cdf(3 / 7, scale=1 / lam)
print(y1)  # 0.6321205588285577
print(y2)  # 0.8646647167633873
print(y3)  # 0.950212931632136
其它随机函数
随机从序列中获取元素
numpy.random.choice(a, size=None, replace=True, p=None)Generates a random sample from a given 1-D array.
从序列中获取元素,若a为整数,元素取值从np.range(a)中随机获取;若a为数组,取值从a数组元素中随机获取。该函数还可以控制生成数组中的元素是否重复replace,以及选取元素的概率p。
【例】
import numpy as np

np.random.seed(20200614)
x = np.random.choice(10, 3)
print(x)  # [2 0 1]

x = np.random.choice(10, 3, p=[0.05, 0, 0.05, 0.9, 0, 0, 0, 0, 0, 0])
print(x)  # [3 2 3]

x = np.random.choice(10, 3, replace=False, p=[0.05, 0, 0.05, 0.9, 0, 0, 0, 0, 0, 0])
print(x)  # [3 0 2]

aa_milne_arr = ['pooh', 'rabbit', 'piglet', 'Christopher']
x = np.random.choice(aa_milne_arr, 5, p=[0.5, 0.1, 0.1, 0.3])
print(x) # ['pooh' 'rabbit' 'pooh' 'pooh' 'pooh']

np.random.seed(20200614)
x = np.random.randint(0, 10, 3)
print(x)  # [2 0 1]
对数据集进行洗牌操作
数据一般都是按照采集顺序排列的,但是在机器学习中很多算法都要求数据之间相互独立,所以需要先对数据集进行洗牌操作。
numpy.random.shuffle(x)Modify a sequence in-place by shuffling its contents.
This function only shuffles the array along the first axis of a multi-dimensional array. The order of sub-arrays is changed but their contents remains the same.
对x进行重排序,如果x为多维数组,只沿第 0 轴洗牌,改变原来的数组,输出为None。
【例】洗牌,改变自身内容,打乱顺序。
import numpy as np

np.random.seed(20200614)
x = np.arange(10)
np.random.shuffle(x)
print(x)
# [6 8 7 5 3 9 1 4 0 2]

print(np.random.shuffle([1, 4, 9, 12, 15]))
# None

x = np.arange(20).reshape((5, 4))
print(x)
# [[ 0  1  2  3]
#  [ 4  5  6  7]
#  [ 8  9 10 11]
#  [12 13 14 15]
#  [16 17 18 19]]

np.random.shuffle(x)
print(x)
# [[ 4  5  6  7]
#  [ 0  1  2  3]
#  [ 8  9 10 11]
#  [16 17 18 19]
# [12 13 14 15]]numpy.random.permutation(x)Randomly permute a sequence, or return a permuted range.
If x is a multi-dimensional array, it is only shuffled along its first index.
permutation()函数的作用与shuffle()函数相同,可以打乱第0轴的数据,但是它不会改变原来的数组。
【例】
import numpy as np

np.random.seed(20200614)
x = np.arange(10)
y = np.random.permutation(x)
print(y)
# [6 8 7 5 3 9 1 4 0 2]

print(np.random.permutation([1, 4, 9, 12, 15]))
# [ 4  1  9 15 12]

x = np.arange(20).reshape((5, 4))
print(x)
# [[ 0  1  2  3]
#  [ 4  5  6  7]
#  [ 8  9 10 11]
#  [12 13 14 15]
#  [16 17 18 19]]

y = np.random.permutation(x)
print(y)
# [[ 8  9 10 11]
#  [ 0  1  2  3]
#  [12 13 14 15]
#  [16 17 18 19]
#  [ 4  5  6  7]]


 4141
4141


 被折叠的 条评论
为什么被折叠?
被折叠的 条评论
为什么被折叠?
 到【灌水乐园】发言


