<!DOCTYPE HTML>
<html>
<head lang="en">
<meta charset="UTF-8">
<title>Canvans绘制统计图</title>
<style>
body {
text-align: center;
}
canvas {
background: #ddd;
}
</style>
</head>
<body>
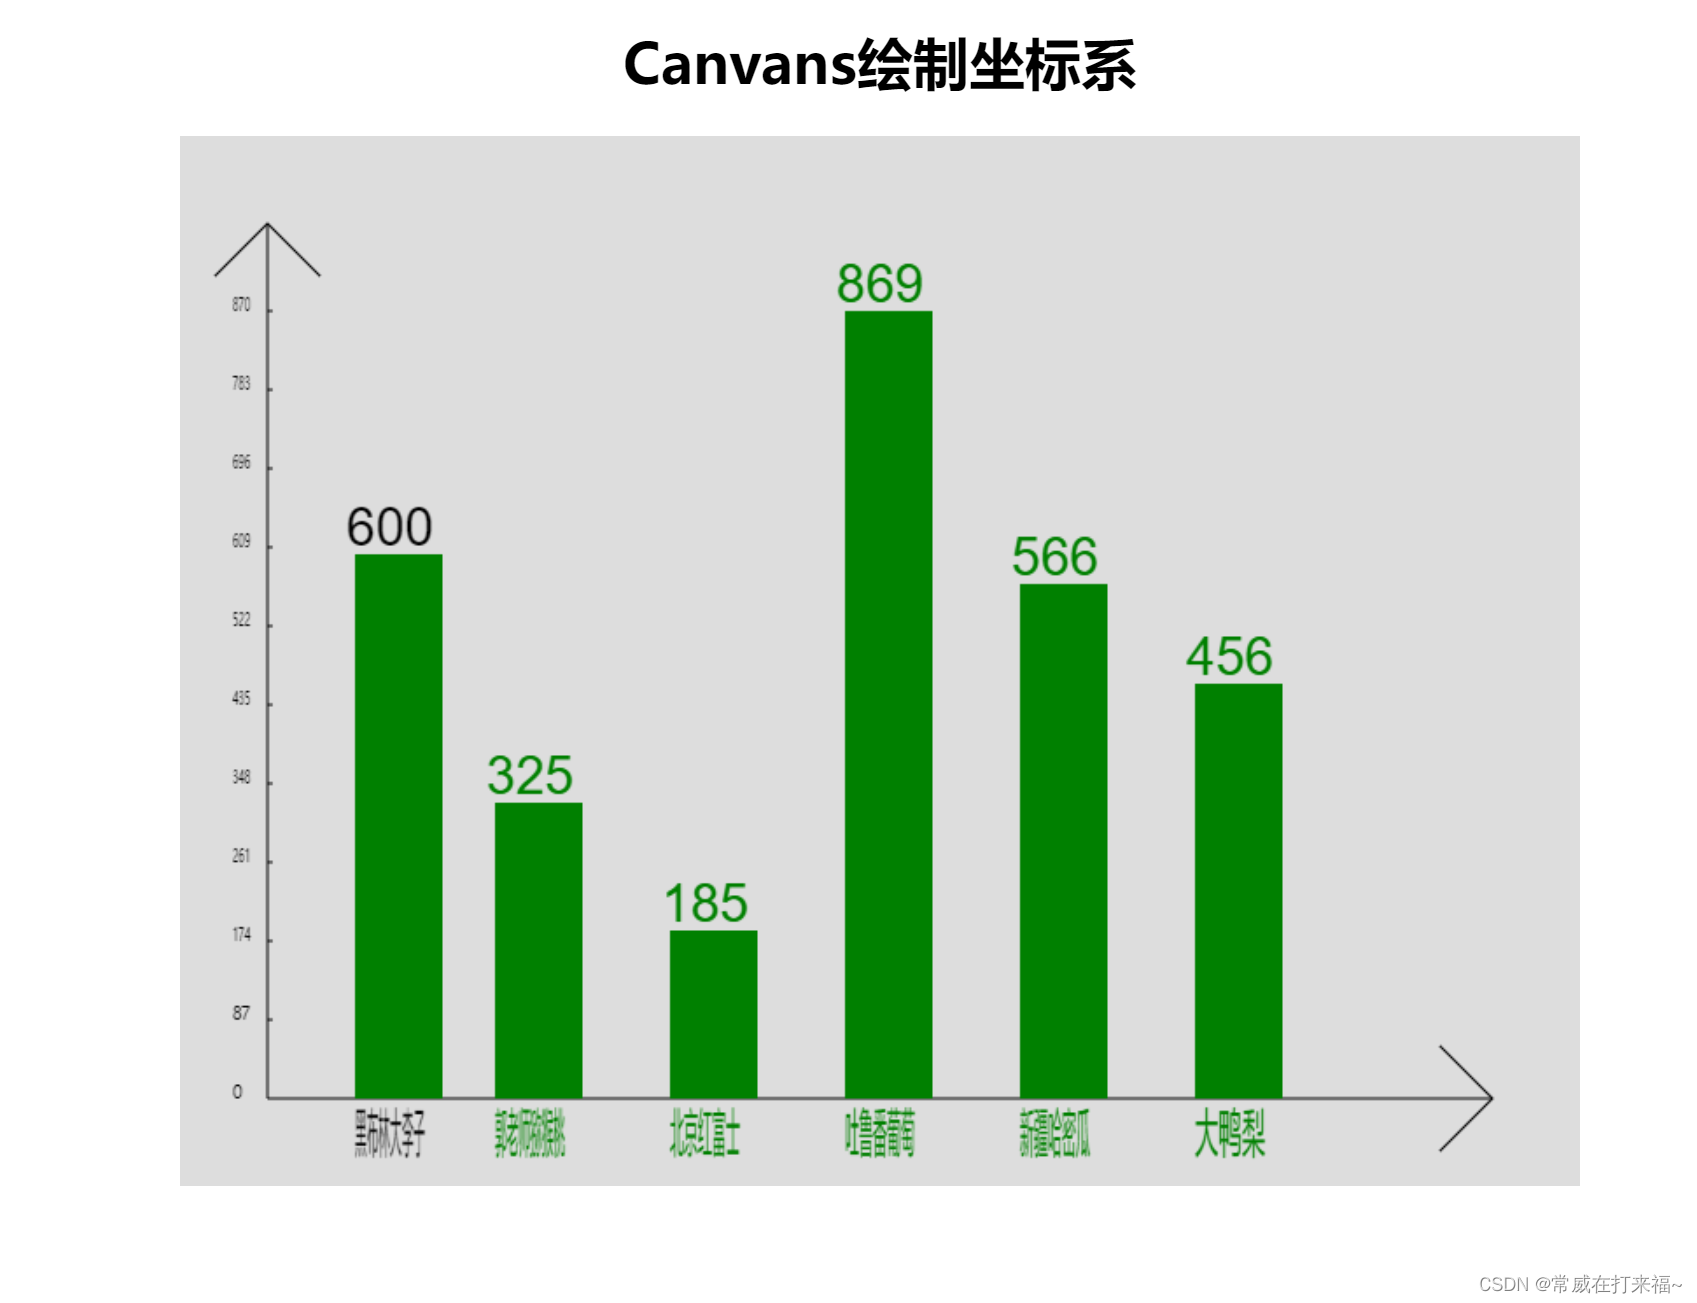
<h1>Canvans绘制坐标系</h1>
<canvas id="canvas" width="800" height="600">
您的浏览器不支持Canvas标签!
</canvas>
<script>
var ctx = ctx || document.querySelector('canvas').getContext('2d');
var canvasWidth = ctx.canvas.width;
var canvasHeight = ctx.canvas.height;
console.log(canvasWidth, "canvasWidth")
console.log(canvasHeight, "canvasHeight")
const xAxis = ['黑布林大李子', '郭老师猕猴桃', '北京红富士', '吐鲁番葡萄', '新疆哈密瓜', '大鸭梨'];
const yAxis = [600, 325, 185, 869, 566, 456];
const cSpace = 10;
var arr = JSON.parse(JSON.stringify(yAxis)).sort((a, b) => {
if (a - b > 0) {
return 1;
} else if (a - b < 0) {
return -1;
};
})
const maxValue = arr[arr.length - 1];
const oneVal = Math.ceil(maxValue / 10);
function Coordinate() {
ctx.beginPath();
ctx.moveTo(50, canvasHeight - 50);
ctx.lineTo(canvasWidth - 50, canvasHeight - 50);
ctx.lineTo(canvasWidth - 80, canvasHeight - 80);
ctx.moveTo(canvasWidth - 80, canvasHeight - 20);
ctx.lineTo(canvasWidth - 50, canvasHeight - 50);
ctx.lineWidth = 1;
ctx.lineJoin = 'round';
ctx.strokeStyle = '#000';
ctx.stroke();
ctx.beginPath();
ctx.moveTo(50, canvasHeight - 50);
ctx.lineTo(50, 50);
ctx.lineTo(50 - 30, 80);
ctx.moveTo(50, 50);
ctx.lineTo(50 + 30, 80);
ctx.strokeStyle = '#000';
ctx.stroke();
setYAxis();
setXAxis();
}
Coordinate();
function getRad(degree) {
return degree / 180 * Math.PI;
}
function setYAxis() {
var markerVal;
var yMarker;
for (var i = 0; i <= 10; i++) {
markerVal = i*oneVal;
ctx.restore();
yMarker = Math.ceil((canvasHeight - 150) * (1 -(markerVal / maxValue))) + 100;
ctx.fillText(markerVal, 30, yMarker, cSpace);
if (i > 0) {
drawLine({axis: 'y', y:yMarker});
}
}
}
function setXAxis() {
var xyMark;
var markerVal = (canvasWidth - 200) / xAxis.length;
for (var i = 0; i <= xAxis.length - 1; i++) {
xMarker = Math.ceil(i * markerVal) + markerVal;
if (i === 0) {
xMarker = xMarker + 20;
}
ctx.font = "30px Arial";
ctx.textAlign="center";
ctx.fillText(xAxis[i], xMarker, canvasHeight - 20, 40);
drawLine({axis: 'x', x:xMarker});
xyMark = Math.ceil((canvasHeight - 150) * (yAxis[i] / maxValue)) + 50;
ctx.fillText(yAxis[i], xMarker, canvasHeight - xyMark - 5);
ctx.beginPath();
ctx.rect( xMarker - 20, canvasHeight - 50, markerVal - 50, -xyMark + 50 );
ctx.fillStyle = "green";
ctx.fill();
ctx.closePath();
}
}
function drawLine(obj) {
ctx.beginPath();
if (obj.axis === 'y') {
ctx.moveTo(50, obj.y);
ctx.lineTo(53, obj.y);
} else {
ctx.moveTo(obj.x, canvasHeight - 50);
ctx.lineTo(obj.x, canvasHeight - 55);
}
ctx.stroke();
ctx.closePath();
}
</script>
</body>
</html>


 470
470

 被折叠的 条评论
为什么被折叠?
被折叠的 条评论
为什么被折叠?
 到【灌水乐园】发言


