


canvas 柱形图
前言
在用uni-app做项目时,偶然遇到一个地方需要柱形图,由于插件没找到合适的, 自己就写了一个,分享给大家,如果有写得不好的地方,请大家多多指教。
效果图
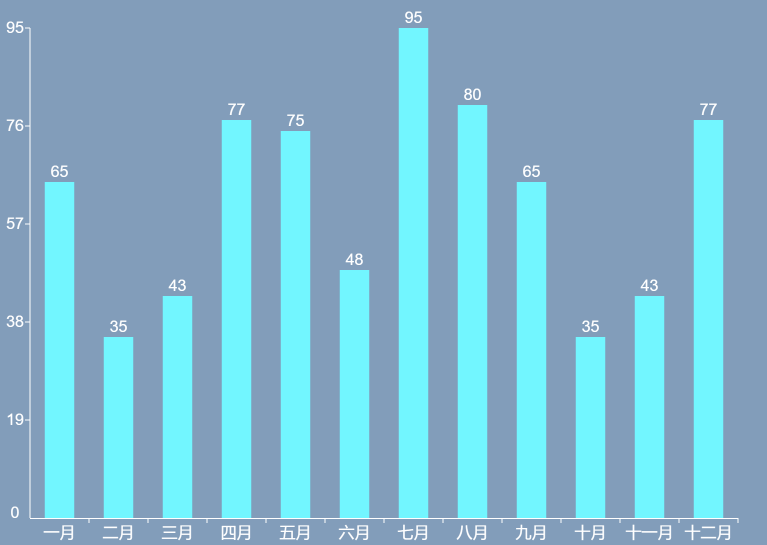
功能:通过X轴数组的长度,计算得到每段的宽度,从而可以实现图像宽度和位置的自动分配。通过Y轴数组最大值和最小值,计算出柱形在Y轴上面对应的坐标,从而实现图形比例分配高度。自定义宽高,未定义宽度时,自适应屏幕宽度。
绘制分析
这个图标由xy轴、数据条形组成。
- 轴线: 使用
moveTo(x, y)和lineTo(x, y)实现 - 文字:使用
fillText( text, x, y)实现 - 长方形: 使用
fillRect(x, y, width, height )实现
实现步骤
–显示的数据
 itemsX: ['一月', '二月', '三月', '四月', '五月', '六月', '七月', '八月', '九月', '十月', '十一月', '十二月',],
 itemsY: [65, 35, 43, 77, 75, 48, 95, 80, 65, 35, 43, 77],
–定义画布
 <canvas canvas-id="secondCanvas"
            :style="{height:`${height}px`,width:`${canvasWidth}px`}">
 </canvas>
–计算Y轴上的刻度值数据
算出Y轴每段的长度,通过进行for循环,将每段的刻度值依次保存到yScales数组中
Y轴每段长度 = (y轴最大值 - y轴最小值) / 总段数
getyScale () {
      let length = (this.maxNum - this.yAxisMinNum) / this.yNumber
      for (let index = 0; index < this.yNumber; index++) {
        this.yScales.push(Math.ceil(length * (index + 1) + this.initialValue))
      }
    },
–x轴和y轴的每段长度
计算出xy轴每段的长度,再通过for循环,每段的长度乘以for循环的索引值就可以得到每段在Y轴线和Y轴线上的坐标点
padding是给文字预留边距
XY轴每段长度 = (总长度 - 两边的边距)/ 总的段数
this.xLength = Math.floor((this.canvasWidth - this.padding * 2) / this.itemsX.length)
this.yLength = Math.floor((this.height - this.padding * 2) / this.yNumber)
–绘制刻度和刻度值
1.计算在轴线上的坐标点
坐标点 = 每段长度 * 对应第几段的索引值
let newlength = length * (index + 1)
2.绘制刻度
通过context.moveTo()和context.lineTo()绘制刻度
context.moveTo(this.padding + newlength, this.height - this.padding)
context.lineTo(this.padding + newlength, this.height - this.padding + 5)
3.绘制刻度值
刻度值通过for循环的在数组中得到对应的值,同时因为点位会直接定到轴线上,所应根据情况,添加偏移量
context.fillText(items[index], this.padding - 15, this.height - this.padding - newlength + 5);
–绘制柱形图
1.计算柱形图高度
总高度减去预留两边的预留边距 乘以 Y轴数组的值除以总高度
通过去除边距的总高度和Y轴对应刻度的值除以最大值的百分比计算出每个
柱形图的高度 = (总高度 - 两边边距) ((Y轴对应的刻度值 - Y轴最小值)/ (Y轴最大值 - Y轴最小值)*
let yHeight = Math.ceil((this.height - (this.padding * 2)) * ((this.itemsY[index] - this.yAxisMinNum) / (this.maxNum - this.yAxisMinNum)))
2.计算fillRecty轴坐标值
因为canvas起始坐标(0,0)是左上角,所以要用总高度减去下方边距减去柱状图边距,从而得到y轴的坐标
let y = this.height - this.padding -yHeight
3.计算fillRectx轴坐标值和宽度
宽度是每段长度的一半,所以为了保证图像在每段居中,x轴的坐标值就需要在每段4分之1的位置开始,因此在索引值后面需要加上一个0.25
let xWidth = this.xLength / 2
let x = this.padding + this.xLength * (index + 0.25)
4.绘制柱形图
将计算的z,y坐标和对应的宽度长度填入context.fillRect()中
context.fillRect(x, y, this.xLength / 2, yHeight,)
完整代码
| 属性名 | 类型 | 默认值 | 是否必须 | 说明 |
|---|---|---|---|---|
| itemsX | Array | [ ] | 是 | x轴显示数据 |
| itemsY | Array | [ ] | 是 | y轴显示数据 |
| maxNumy | Number | y轴显示数据最大值 | 否 | y轴刻度值最大值,小于y轴显示数据最大值时,替换为y轴显示最大值 |
| minNumy | Number | 0 | 否 | y轴刻度值最小值,大于y轴显示数据最小值时,替换为y轴显示最小值 |
| width | Number | 屏幕宽度 | 否 | 图像宽度 |
| height | Number | 500 | 否 | 图像高度 |
| padding | Number | 30 | 否 | 图像边距 |
| graphColor | String | ‘#000000’ | 否 | 柱形图颜色 |
   data () {
    return {
      //自定义的变量
      itemsX: ['一月', '二月', '三月', '四月', '五月', '六月', '七月', '八月', '九月', '十月', '十一月', '十二月',],
      itemsY: [65, 35, 43, 77, 75, 48, 95, 80, 65, 35, 43, 77],
      maxNumy: 0,
      minNumy: 0,
      width: 768,
      height: 500,
      yNumber: 5,
      padding: 30,
      graphColor: '#72f6ff',


      //非自定义
      yScales: [], //y轴上刻度值数组
      xLength: '', //x轴每段长度
      yLength: '', //y轴每段长度
      scaleIntervalMax: '',  //y轴刻度值最大值
      scaleIntervalMin: '',  //y轴刻度值最小值
    }
  },
  computed: {
    yAxisMinNum () { // 判断最小值是否大于itmsY数组中的最小值,大于则替换
      return this.minNumy < this.scaleIntervalMin ? this.minNumy : this.scaleIntervalMin
    },
    canvasWidth () { // 获取图像宽度
      let windowWidth
      uni.getSystemInfo({
        success (res) {
          windowWidth = res.windowWidth
        }
      })
      return this.width || windowWidth // 判断是否自定义宽度,没有则自适应屏幕宽度
    },
  },
  mounted () {
                                        // 判断最大值是否小于itmsY数组中的最小值,小于则替换
    this.scaleIntervalMax = this.getMaxNum(this.itemsY) > this.maxNumy ? this.getMaxNum(this.itemsY) : this.maxNumy
    this.scaleIntervalMin = this.getMinNum(this.itemsY)
    this.getyScale()
    this.getSingleLengths()
    this.drawCanvas()
  },
  methods: {
    getyScale () { // 获得y轴上刻度值数组
      let length = (this.scaleIntervalMax - this.yAxisMinNum) / this.yNumber
      for (let index = 0; index < this.yNumber; index++) {
        this.yScales.push(Math.ceil(length * (index + 1) + this.yAxisMinNum))
      }
    },
    getMaxNum (items) {
      let num = items[0]
      let cur
      for (let i = 1; i < items.length; i++) {
        cur = items[i]
        cur > num ? num = cur : null
      }
      return num
    },
    getMinNum (items) {
      let num = items[0]
      let cur
      for (let i = 1; i < items.length; i++) {
        cur = items[i]
        cur < num ? num = cur : null
      }
      return num
    },
    getSingleLengths () { // 获取xy每段长度
      this.xLength = Math.floor((this.canvasWidth - this.padding * 2) / this.itemsX.length)
      this.yLength = Math.floor((this.height - this.padding * 2) / this.yNumber)
    },
    drawCanvas () { // 绘制
      let context = uni.createCanvasContext('secondCanvas')
      this.drawCoordinateAxis(context)
      this.drawScale(this.xLength, this.itemsX.length, this.itemsX, context, 'x')
      this.drawScale(this.yLength, this.yNumber, this.yScales, context, 'y')
      this.drawGraph(context)
    },
    drawCoordinateAxis (context) {    // 绘制轴线和初始位置文字
      context.beginPath()
      context.textAlign = 'center';
      context.fillStyle = '#ffffff';
      context.strokeStyle = '#ffffff';
      context.font = "16px Arial"
      context.lineWidth = 1;
      // x轴线
      context.moveTo(this.padding, this.height - this.padding + 0.5)
      context.lineTo(this.canvasWidth - this.padding, this.height - this.padding + 0.5)
      context.stroke()
      //Y轴线
      context.moveTo(this.padding, this.height - this.padding)
      context.lineTo(this.padding, this.padding)
      context.stroke()
      // xy初始位置文字
      context.fillText(this.yAxisMinNum, this.padding - 15, this.height - this.padding);
      context.draw()
    },
    drawScale (length, totalLength, items, context, type) {  // 绘制刻度和刻度值
      context.beginPath()
      context.globalAlpha = 1
      context.textAlign = 'center';
      context.fillStyle = '#ffffff';
      context.strokeStyle = '#ffffff';
      context.font = "16px Arial"
      for (let index = 0; index < totalLength; index++) {
        let newlength = length * (index + 1)
        //绘制x轴刻度
        if (type == 'x') {
          context.moveTo(this.padding + newlength, this.height - this.padding)
          context.lineTo(this.padding + newlength, this.height - this.padding + 5)
          context.stroke()
          context.fillText(items[index], this.padding + newlength - length / 2, this.height - this.padding + 20);
        }
        //绘制y轴刻度
        if (type == 'y') {
          context.moveTo(this.padding, this.height - this.padding - newlength)
          context.lineTo(this.padding - 5, this.height - this.padding - newlength)
          context.stroke()
          context.fillText(items[index], this.padding - 15, this.height - this.padding - newlength + 5);
        }
      }
      // 连接上个图像继续绘制
      context.draw(true)
    },
    drawGraph (context) {  // 绘制柱状图
      context.beginPath()
      context.textAlign = 'center'
      for (let index = 0; index < this.itemsX.length; index++) {
        // 柱状图x轴坐标
        let x = this.padding + this.xLength * (index + 0.25)
        // 柱状图宽度
        let xWidth = this.xLength / 2
        // 柱状图高度
        let yHeight = Math.ceil((this.height - (this.padding * 2)) * ((this.itemsY[index] - this.yAxisMinNum) / (this.scaleIntervalMax - this.yAxisMinNum)))
        // 柱状图y轴坐标
        let y = this.height - this.padding - yHeight
        context.fillStyle = this.graphColor
        context.fillRect(x, y, xWidth, yHeight,)
        context.fillStyle = '#fff'
        // 文字坐标
        context.fillText(this.itemsY[index], this.padding + this.xLength * (index + 0.5), y - 5);
      }
      context.draw(true)
    }
  }


 1205
1205


 被折叠的 条评论
为什么被折叠?
被折叠的 条评论
为什么被折叠?
 到【灌水乐园】发言


