


echarts+vue
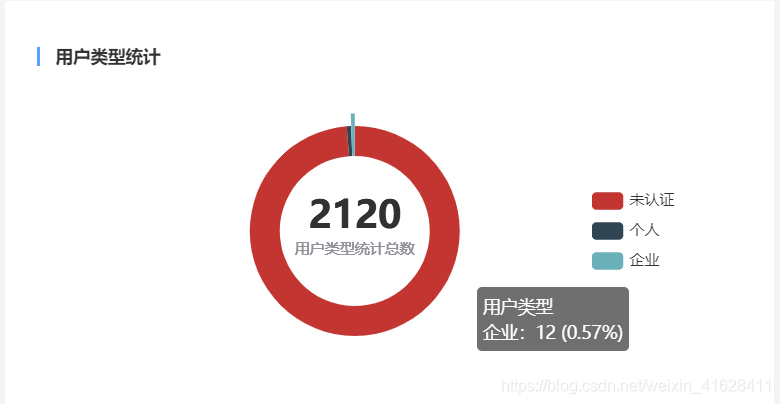
环形图将总数放置在饼图中央,且鼠标悬浮图例可以显示提示信息,图例提示信息数据计算比例采用最大余额法计算

initEchartPie()
initEchartPie(){
   setTimeout(()=>{
       const  myCharts = this.$echarts.init(this.$refs.myChartPie);
       myCharts.showLoading({text: "数据加载中...",textColor:'#7a7878',color:'#57a2ff',lineWidth: 2});
       this.$axios.post('/api/api/inner/v1/usertype/count').then(res => {
           if(res.data.code === '0000'){
               if(res.data.data.length === 0){
                   var html = `<span class="echarts-nodate"><i class="fontFamily yybzzanwushuju1"></i>暂无数据</span>`
                   document.getElementById('myChart').innerHTML = html
                   document.getElementById('myChart').removeAttribute('_echarts_instance_')
               }else{
                   this.$axios.get('/api/common/usertype/list').then(_result => {
                       if(_result.data.code === '0000'){
                           let lengendArr=[]
                           let seriseArr=[]
                           let numToole=0
                           res.data.data.forEach(i=>{
                               _result.data.data.forEach(j=>{
                                   if(i.target === j.code){
                                       numToole+=i.nums
                                       lengendArr.push(j.name)
                                       seriseArr.push({
                                           name:j.name,
                                           value:i.nums
                                       })
                                   }
                               })
                           })
                           let _self=this
                           let option = {
                               tooltip: {
                                   trigger: 'item',
                                   formatter: '{a} <br/>{b}: {c} ({d}%)'
                               },
                               legend: {
                                   orient: 'vertical',
                                   right: 50,
                                   bottom:'center',
                                   data: lengendArr,
                                       tooltip: {
                                       show: true,
                                       trigger: 'item',
                                       formatter: function (tool) {
                                           let numArr=[]
                                           let numIndex=0
                                           let indexNum=0
                                           seriseArr.forEach((item,index) => {
                                               numArr.push(item.value)
                                               if(tool.name === item.name){
                                                   numIndex =index
                                                   indexNum = item.value
                                               }
                                           })
                                           if(indexNum === 0){
                                               return `用户类型</br>${tool.name}:${indexNum} (0%)`
                                           }else{
                                               return `用户类型</br>${tool.name}:${indexNum} (${_self.getPercentValue(numArr,numIndex,2)}%)`
                                           }
                                       },
                                       textStyle:{
                                         align:'left'
                                   }
                                   },
                               },
                               series: [
                                   {
                                       name: '用户类型',
                                       type: 'pie',
                                       center: ['45%', '50%'],
                                       radius: ['50%', '70%'],
                                       avoidLabelOverlap: false,
                                       normal: {
                                           show: true,
                                           position: 'center'
                                       },
                                       labelLine: {
                                           show: false
                                       },
                                       data: seriseArr,
                                       label: {
                                           normal: {
                                               padding: [30, 30, 30, 30],
                                               show: true,
                                               position: 'center',
                                               formatter: [
                                                   `{value|${numToole}}`,
                                                   '{name|用户类型统计总数}'
                                               ].join('\n'),
                                               rich: {
                                                   value: {
                                                       color: '#303133',
                                                       fontSize: 30,
                                                       fontWeight: 'bold',
                                                       lineHeight: 30,
                                                   },
                                                   name: {
                                                       color: '#909399',
                                                       lineHeight: 20
                                                   },
                                               },
                                           },
                                           emphasis: {
                                               show: true,
                                               textStyle: {
                                                   fontSize: '16',
                                                   fontWeight: 'bold'
                                               }
                                           }
                                       },
                                   }
                               ]
                           };
                           myCharts.setOption(option);
                           window.addEventListener('resize',function(){
                               myCharts.resize()
                           })
                           myCharts.on('legendselectchanged', function(params) {
                               var option = this.getOption();
                               option.legend[0].selected[params.name] = true;
                               this.setOption(option)
                           })
                       }
                   })

               }
           }
       })
       myCharts.hideLoading();
   },0)
},
getPercentValue()
getPercentValue(valueList, idx, precision){// 传入参数(数组数据,数组下标,精度),底下有例子调用
            // 判断是否为空
            if (!valueList[idx]) {
                return 0;
            }
            // 求和
            var sum = valueList.reduce(function (acc, val) {
                return acc + (isNaN(val) ? 0 : val);
            }, 0)
            if (sum === 0) {
                return 0;
            }
            // 10的2次幂是100,用于计算精度。
            var digits = Math.pow(10, precision);
            // 扩大比例100,
            var votesPerQuota = valueList.map(function (val) {
                return (isNaN(val) ? 0 : val) / sum * digits * 100;
            })
            // 总数,扩大比例意味的总数要扩大
            var targetSeats = digits * 100;
            // 再向下取值,组成数组
            var seats = votesPerQuota.map(function (votes) {
                return Math.floor(votes);
            })
            // 再新计算合计,用于判断与总数量是否相同,相同则占比会100%
            var currentSum = seats.reduce(function (acc, val) {
                return acc + val;
            }, 0)
            // 余数部分的数组:原先数组减去向下取值的数组,得到余数部分的数组
            var remainder = votesPerQuota.map(function (votes, idx) {
                return votes - seats[idx];
            })
            // 给最大最大的余额加1,凑个占比100%;
            while (currentSum < targetSeats) {
                //  找到下一个最大的余额,给其加1
                var max = Number.NEGATIVE_INFINITY;
                var maxId = null;
                for (var i = 0, len = remainder.length; i < len; ++i) {
                    if (remainder[i] > max) {
                        max = remainder[i];
                        maxId = i;
                    }
                }
                // 对最大项余额加1
                ++seats[maxId];
                // 已经增加最大余数加1,则下次判断就可以不需要再判断这个余额数。
                remainder[maxId] = 0;
                // 总的也要加1,为了判断是否总数是否相同,跳出循环。
                ++currentSum;
            }
            // 这时候的seats就会总数占比会100%
            return seats[idx] / digits
        },


 325
325


 被折叠的 条评论
为什么被折叠?
被折叠的 条评论
为什么被折叠?
 到【灌水乐园】发言


