


matlab 处理geotiff的相关资料较少,这里记录一下最近走过的坑
代码
可视化可以使用imshow方法可视化,也可以通过mapshow方法可视化
%% 读入geotiff图像
[A,~] = geotiffread(filename);
%A = double(A);                                     % 转换为matlab函数可读的形式;
info  = geotiffinfo(filename);                      % 读取geotiff中携带的信息;
R = info.SpatialRef;
[m,n,numOfColorLayer]=size(A);
% 读入的geotiff图像可能有两种,一种是带有地理坐标信息的影像,一种是不带有地理坐标tiff影像
if(numOfColorLayer >=3)
    figure,imshow(A(:,:,1:3));title('不带地理坐标的tif影像');
else

    figure,imshow(A(:,:,1));title('不带地理坐标的tif影像');
end
% 显示读入的图像
figure,mapshow(A(:,:,1:3),R);
二维结果

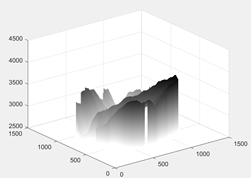
如果想要实现三维可视化,需要借助于meshgrid方法及surf方法
一个简单的示例如下:
%-------------------------------
% 程序用于读取geotiff文件并显示
% reference:https://blog.csdn.net/liyanzhong/article/details/52850581
%            https://blog.csdn.net/xiaoxiao133/article/details/78523817
[data,R] = geotiffread('dem.tif');    % 读取带有空间信息的地理数据,返回数据,
                                             % 和地理栅格空间参考信息R,光栅空间在一幅图像中表示像素值;
data= double(data);                       % 转换为matlab函数可读的形式;
info  = geotiffinfo('dem.tif');    % 读取geotiff中携带的信息;
%% 写出
%geotiffwrite('dem_2.tif',Y,R,'GeoKeyDirectoryTag',info.GeoTIFFTags.GeoKeyDirectoryTag);

filename = 'dem.tif';
%A = geotiffread(filename);
A = imread(filename);
A = double(A);
AGood = PrcessMatError(A);
%% 显示三维图像
[M,N] = size(AGood);             % M为tiff的行数,N为tiff的列数;
[MM,NN] = meshgrid(1:M,1:N);
% 每个网格点对应的颜色为形变值

h = figure;
AGood_filt=medfilt2(AGood,[5 5]);% 滤波为5:代表平滑程度 越大越平滑
hs = surf(MM',NN',AGood);
colormap(flip(gray))
set(hs,'edgecolor','none')
zlabel('高程/(m)')
shading interp
colorbar
三维结果
有问题欢迎咨询


 531
531


 被折叠的 条评论
为什么被折叠?
被折叠的 条评论
为什么被折叠?
 到【灌水乐园】发言


