


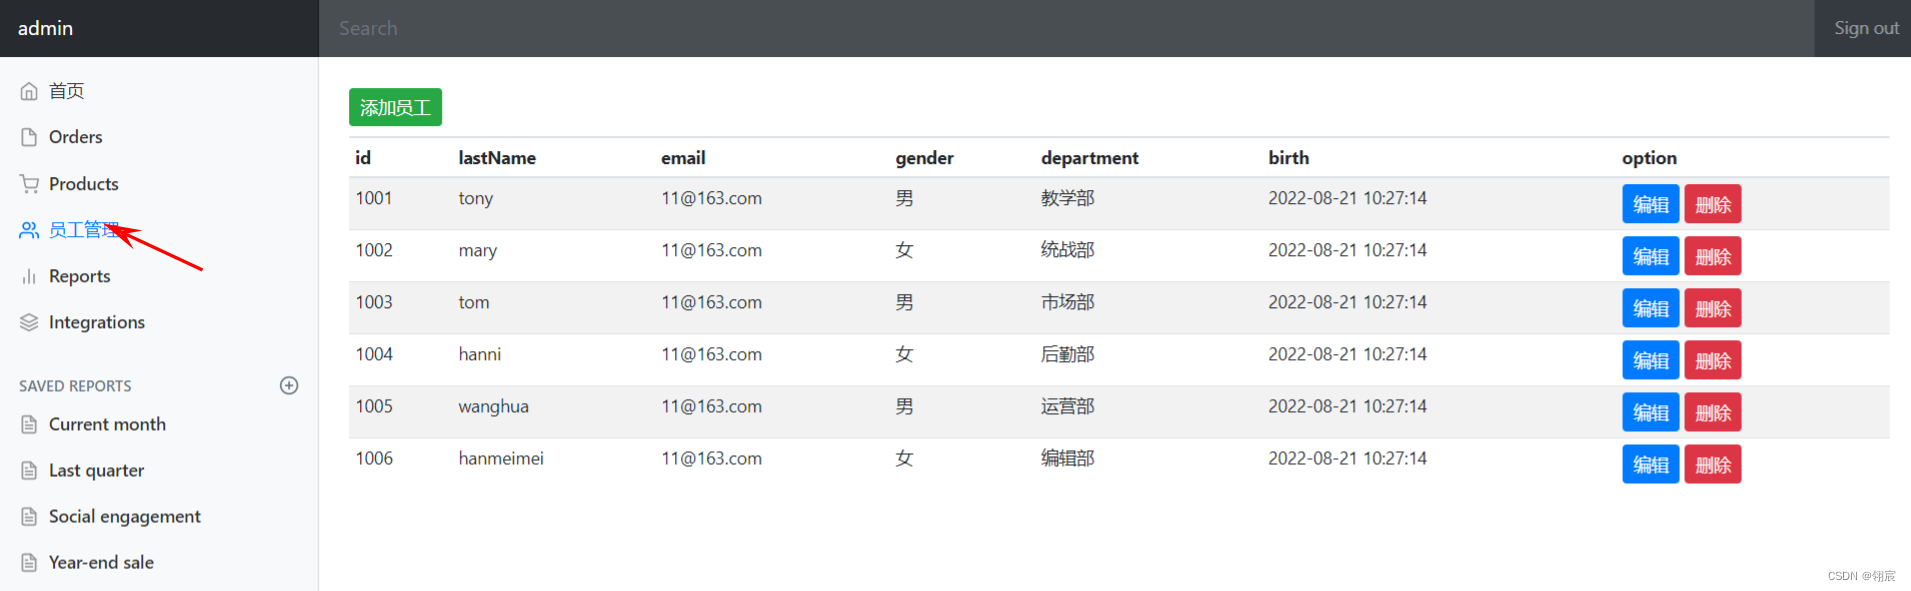
5.6.5 员工列表展示
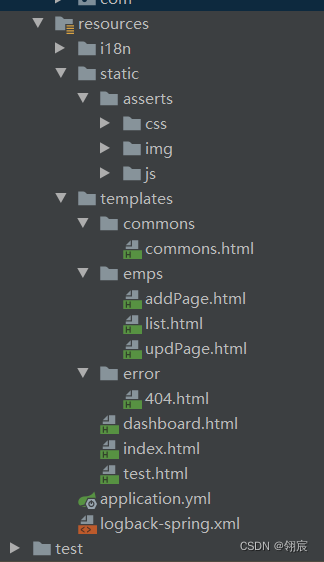
- 项目结构
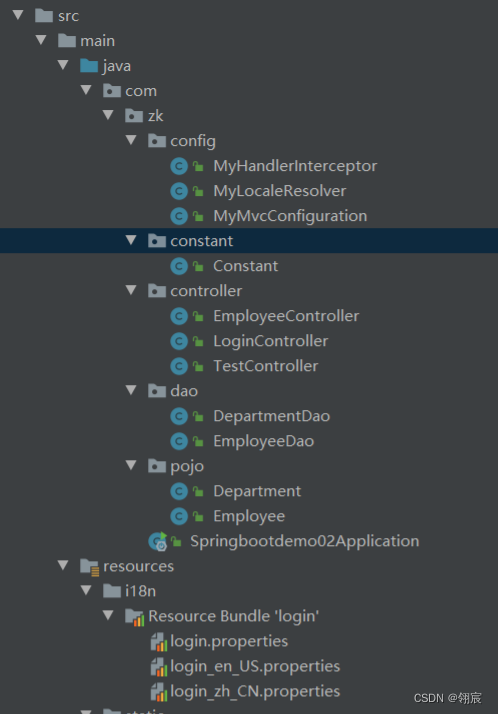
-
静态资源目录,commons公共组件页面
-
员工控制层的编写EmployeeController,里面存在一个列表展示方法
package com.zk.controller;

import com.zk.dao.EmployeeDao;
import com.zk.pojo.Employee;
import org.springframework.beans.factory.annotation.Autowired;
import org.springframework.stereotype.Controller;
import org.springframework.ui.Model;
import org.springframework.web.bind.annotation.RequestMapping;

import java.util.Collection;

/**
 * @author CNCLUKZK
 * @create 2022/8/2-19:04
 */
@Controller
@RequestMapping("/empls")
public class EmployeeController {

    @Autowired
    private EmployeeDao employeeDao;

    @RequestMapping("/toList")
    public String toList(Model model){
        Collection<Employee> employees = employeeDao.getEmployees();
        model.addAttribute("empls",employees);
        return "emps/list";
    }
}
- 主页dashboard.html、员工列表也emps/list.html,将这两页面公共部分bar抽取成commons/commons.html
- dashboard.html,引用公共页面部分
<div th:replace="~{commons/commons.html::topBar}"></div>

<div th:replace="~{commons/commons.html::sidebar(active='main')}"></div>
 公共页面的引用,并传递左侧标签点击参数
<!DOCTYPE html>
<!-- saved from url=(0052)http://getbootstrap.com/docs/4.0/examples/dashboard/ -->
<html lang="en" xmlns:th="http://www.thymeleaf.org">
   <head>
      <meta http-equiv="Content-Type" content="text/html; charset=UTF-8">
      <meta name="viewport" content="width=device-width, initial-scale=1, shrink-to-fit=no">
      <meta name="description" content="">
      <meta name="author" content="">

      <title>Dashboard Template for Bootstrap</title>
      <!-- Bootstrap core CSS -->
      <link th:href="@{/asserts/css/bootstrap.min.css}" rel="stylesheet">

      <!-- Custom styles for this template -->
      <link th:href="@{/asserts/css/dashboard.css}" rel="stylesheet">
      <style type="text/css">
         /* Chart.js */

         @-webkit-keyframes chartjs-render-animation {
            from {
               opacity: 0.99
            }
            to {
               opacity: 1
            }
         }

         @keyframes chartjs-render-animation {
            from {
               opacity: 0.99
            }
            to {
               opacity: 1
            }
         }

         .chartjs-render-monitor {
            -webkit-animation: chartjs-render-animation 0.001s;
            animation: chartjs-render-animation 0.001s;
         }
      </style>
   </head>

   <body>
      <div th:replace="~{commons/commons.html::topBar}"></div>

      <div class="container-fluid">
         <div class="row">
            <div th:replace="~{commons/commons.html::sidebar(active='main')}"></div>

            <main role="main" class="col-md-9 ml-sm-auto col-lg-10 pt-3 px-4">
               <div class="chartjs-size-monitor" style="position: absolute; left: 0px; top: 0px; right: 0px; bottom: 0px; overflow: hidden; pointer-events: none; visibility: hidden; z-index: -1;">
                  <div class="chartjs-size-monitor-expand" style="position:absolute;left:0;top:0;right:0;bottom:0;overflow:hidden;pointer-events:none;visibility:hidden;z-index:-1;">
                     <div style="position:absolute;width:1000000px;height:1000000px;left:0;top:0"></div>
                  </div>
                  <div class="chartjs-size-monitor-shrink" style="position:absolute;left:0;top:0;right:0;bottom:0;overflow:hidden;pointer-events:none;visibility:hidden;z-index:-1;">
                     <div style="position:absolute;width:200%;height:200%;left:0; top:0"></div>
                  </div>
               </div>
               <div class="d-flex justify-content-between flex-wrap flex-md-nowrap align-items-center pb-2 mb-3 border-bottom">
                  <h1 class="h2">Dashboard</h1>
                  <div class="btn-toolbar mb-2 mb-md-0">
                     <div class="btn-group mr-2">
                        <button class="btn btn-sm btn-outline-secondary">Share</button>
                        <button class="btn btn-sm btn-outline-secondary">Export</button>
                     </div>
                     <button class="btn btn-sm btn-outline-secondary dropdown-toggle">
                <svg xmlns="http://www.w3.org/2000/svg" width="24" height="24" viewBox="0 0 24 24" fill="none" stroke="currentColor" stroke-width="2" stroke-linecap="round" stroke-linejoin="round" class="feather feather-calendar"><rect x="3" y="4" width="18" height="18" rx="2" ry="2"></rect><line x1="16" y1="2" x2="16" y2="6"></line><line x1="8" y1="2" x2="8" y2="6"></line><line x1="3" y1="10" x2="21" y2="10"></line></svg>
                This week
              </button>
                  </div>
               </div>

               <canvas class="my-4 chartjs-render-monitor" id="myChart" width="1076" height="454" style="display: block; width: 1076px; height: 454px;"></canvas>


            </main>
         </div>
      </div>

      <!-- Bootstrap core JavaScript
    ================================================== -->
      <!-- Placed at the end of the document so the pages load faster -->
      <script type="text/javascript" th:src="@{/asserts/js/jquery-3.2.1.slim.min.js}" ></script>
      <script type="text/javascript" th:src="@{/asserts/js/popper.min.js}" ></script>
      <script type="text/javascript" th:src="@{/asserts/js/bootstrap.min.js}" ></script>

      <!-- Icons -->
      <script type="text/javascript" th:src="@{/asserts/js/feather.min.js}" ></script>
      <script>
         feather.replace()
      </script>

      <!-- Graphs -->
      <script type="text/javascript" th:src="@{/asserts/js/Chart.min.js}" ></script>
      <script>
         var ctx = document.getElementById("myChart");
         var myChart = new Chart(ctx, {
            type: 'line',
            data: {
               labels: ["Sunday", "Monday", "Tuesday", "Wednesday", "Thursday", "Friday", "Saturday"],
               datasets: [{
                  data: [15339, 21345, 18483, 24003, 23489, 24092, 12034],
                  lineTension: 0,
                  backgroundColor: 'transparent',
                  borderColor: '#007bff',
                  borderWidth: 4,
                  pointBackgroundColor: '#007bff'
               }]
            },
            options: {
               scales: {
                  yAxes: [{
                     ticks: {
                        beginAtZero: false
                     }
                  }]
               },
               legend: {
                  display: false,
               }
            }
         });
      </script>

   </body>

</html>
- emps/list.html页面
<div th:replace="~{commons/commons.html::topBar}"></div>

<div th:replace="~{commons/commons.html::sidebar(active='emps-list')}"></div>
 公共页面的引用,并传递左侧标签点击参数
th:each循环遍历
<tr th:each="item:${empls}">
<td th:text="${item.id}"></td>
<td th:text="${item.lastName}"></td>
<td th:text="${item.email}"></td>
<td th:text="${item.gender==0?'女':'男'}"></td>
<td th:text="${item.department.departmentName}"></td>
<td th:text="${#dates.format(item.birth,'yyyy-MM-dd HH:mm:ss')}"></td>
<td>
<button class="btn btn-primary btn-sm" th:text="编辑"></button>
<button class="btn btn-danger btn-sm" th:text="删除"></button>
</td>
</tr>
<!DOCTYPE html>
<!-- saved from url=(0052)http://getbootstrap.com/docs/4.0/examples/dashboard/ -->
<html lang="en" xmlns:th="http://www.thymeleaf.org">

   <head>
      <meta http-equiv="Content-Type" content="text/html; charset=UTF-8">
      <meta name="viewport" content="width=device-width, initial-scale=1, shrink-to-fit=no">
      <meta name="description" content="">
      <meta name="author" content="">

      <title>Dashboard Template for Bootstrap</title>
      <!-- Bootstrap core CSS -->
      <link th:href="@{/asserts/css/bootstrap.min.css}" rel="stylesheet">

      <!-- Custom styles for this template -->
      <link th:href="@{/asserts/css/dashboard.css}" rel="stylesheet">
      <style type="text/css">
         /* Chart.js */

         @-webkit-keyframes chartjs-render-animation {
            from {
               opacity: 0.99
            }
            to {
               opacity: 1
            }
         }

         @keyframes chartjs-render-animation {
            from {
               opacity: 0.99
            }
            to {
               opacity: 1
            }
         }

         .chartjs-render-monitor {
            -webkit-animation: chartjs-render-animation 0.001s;
            animation: chartjs-render-animation 0.001s;
         }
      </style>
   </head>

   <body>
   <div th:replace="~{commons/commons.html::topBar}"></div>

      <div class="container-fluid">
         <div class="row">
            <div th:replace="~{commons/commons.html::sidebar(active='emps-list')}"></div>

            <main role="main" class="col-md-9 ml-sm-auto col-lg-10 pt-3 px-4">
               <h2>Section title</h2>
               <div class="table-responsive">
                  <table class="table table-striped table-sm">
                     <thead>
                        <tr>
                           <th>id</th>
                           <th>lastName</th>
                           <th>email</th>
                           <th>gender</th>
                           <th>department</th>
                           <th>birth</th>
                           <th>option</th>
                        </tr>
                     </thead>
                     <tbody>
                        <tr th:each="item:${empls}">
                           <td th:text="${item.id}"></td>
                           <td th:text="${item.lastName}"></td>
                           <td th:text="${item.email}"></td>
                           <td th:text="${item.gender==0?'女':'男'}"></td>
                           <td th:text="${item.department.departmentName}"></td>
                           <td th:text="${#dates.format(item.birth,'yyyy-MM-dd HH:mm:ss')}"></td>
                           <td>
                              <button class="btn btn-primary btn-sm" th:text="编辑"></button>
                              <button class="btn btn-danger btn-sm" th:text="删除"></button>
                           </td>
                        </tr>
                     </tbody>
                  </table>
               </div>
            </main>
         </div>
      </div>

      <!-- Bootstrap core JavaScript
    ================================================== -->
      <!-- Placed at the end of the document so the pages load faster -->
      <script type="text/javascript" th:src="@{/asserts/js/jquery-3.2.1.slim.min.js}" ></script>
      <script type="text/javascript" th:src="@{/asserts/js/popper.min.js}" ></script>
      <script type="text/javascript" th:src="@{/asserts/js/bootstrap.min.js}" ></script>
      <!-- Icons -->
      <script type="text/javascript" th:src="@{/asserts/js/feather.min.js}" ></script>
      <script>
         feather.replace()
      </script>

      <!-- Graphs -->
      <script type="text/javascript" th:src="@{/asserts/js/Chart.min.js}" ></script>
      <script>
         var ctx = document.getElementById("myChart");
         var myChart = new Chart(ctx, {
            type: 'line',
            data: {
               labels: ["Sunday", "Monday", "Tuesday", "Wednesday", "Thursday", "Friday", "Saturday"],
               datasets: [{
                  data: [15339, 21345, 18483, 24003, 23489, 24092, 12034],
                  lineTension: 0,
                  backgroundColor: 'transparent',
                  borderColor: '#007bff',
                  borderWidth: 4,
                  pointBackgroundColor: '#007bff'
               }]
            },
            options: {
               scales: {
                  yAxes: [{
                     ticks: {
                        beginAtZero: false
                     }
                  }]
               },
               legend: {
                  display: false,
               }
            }
         });
      </script>

   </body>

</html>
- 公共页面的抽取commons/commons.html —th:fragment=“topBar”
 <a th:class="${active =='main'?'nav-link active':'nav-link'}" th:href="@{/index}">
 公共页面参数接受判断显示即可
<!DOCTYPE html>
<html lang="en" xmlns:th="http://www.thymeleaf.org">
<!--top标签栏-->
<nav class="navbar navbar-dark sticky-top bg-dark flex-md-nowrap p-0" th:fragment="topBar">
    <a class="navbar-brand col-sm-3 col-md-2 mr-0" href="http://getbootstrap.com/docs/4.0/examples/dashboard/#">[[${session.Session_user}]]</a>
    <input class="form-control form-control-dark w-100" type="text" placeholder="Search" aria-label="Search">
    <ul class="navbar-nav px-3">
        <li class="nav-item text-nowrap">
            <a class="nav-link" th:href="@{/user/loginOut}">Sign out</a>
        </li>
    </ul>
</nav>

<!--top侧边栏-->
<nav class="col-md-2 d-none d-md-block bg-light sidebar" th:fragment="sidebar">
    <div class="sidebar-sticky">
        <ul class="nav flex-column">
            <li class="nav-item">
                <a th:class="${active =='main'?'nav-link active':'nav-link'}" th:href="@{/index}">
                    <svg xmlns="http://www.w3.org/2000/svg" width="24" height="24" viewBox="0 0 24 24" fill="none" stroke="currentColor" stroke-width="2" stroke-linecap="round" stroke-linejoin="round" class="feather feather-home">
                        <path d="M3 9l9-7 9 7v11a2 2 0 0 1-2 2H5a2 2 0 0 1-2-2z"></path>
                        <polyline points="9 22 9 12 15 12 15 22"></polyline>
                    </svg>
                    首页 <span class="sr-only">(current)</span>
                </a>
            </li>
            <li class="nav-item">
                <a class="nav-link" href="http://getbootstrap.com/docs/4.0/examples/dashboard/#">
                    <svg xmlns="http://www.w3.org/2000/svg" width="24" height="24" viewBox="0 0 24 24" fill="none" stroke="currentColor" stroke-width="2" stroke-linecap="round" stroke-linejoin="round" class="feather feather-file">
                        <path d="M13 2H6a2 2 0 0 0-2 2v16a2 2 0 0 0 2 2h12a2 2 0 0 0 2-2V9z"></path>
                        <polyline points="13 2 13 9 20 9"></polyline>
                    </svg>
                    Orders
                </a>
            </li>
            <li class="nav-item">
                <a class="nav-link" href="http://getbootstrap.com/docs/4.0/examples/dashboard/#">
                    <svg xmlns="http://www.w3.org/2000/svg" width="24" height="24" viewBox="0 0 24 24" fill="none" stroke="currentColor" stroke-width="2" stroke-linecap="round" stroke-linejoin="round" class="feather feather-shopping-cart">
                        <circle cx="9" cy="21" r="1"></circle>
                        <circle cx="20" cy="21" r="1"></circle>
                        <path d="M1 1h4l2.68 13.39a2 2 0 0 0 2 1.61h9.72a2 2 0 0 0 2-1.61L23 6H6"></path>
                    </svg>
                    Products
                </a>
            </li>
            <li class="nav-item">
                <a th:class="${active =='emps-list'?'nav-link active':'nav-link'}" th:href="@{/empls/toList}">
                    <svg xmlns="http://www.w3.org/2000/svg" width="24" height="24" viewBox="0 0 24 24" fill="none" stroke="currentColor" stroke-width="2" stroke-linecap="round" stroke-linejoin="round" class="feather feather-users">
                        <path d="M17 21v-2a4 4 0 0 0-4-4H5a4 4 0 0 0-4 4v2"></path>
                        <circle cx="9" cy="7" r="4"></circle>
                        <path d="M23 21v-2a4 4 0 0 0-3-3.87"></path>
                        <path d="M16 3.13a4 4 0 0 1 0 7.75"></path>
                    </svg>
                    员工管理
                </a>
            </li>
            <li class="nav-item">
                <a class="nav-link" href="http://getbootstrap.com/docs/4.0/examples/dashboard/#">
                    <svg xmlns="http://www.w3.org/2000/svg" width="24" height="24" viewBox="0 0 24 24" fill="none" stroke="currentColor" stroke-width="2" stroke-linecap="round" stroke-linejoin="round" class="feather feather-bar-chart-2">
                        <line x1="18" y1="20" x2="18" y2="10"></line>
                        <line x1="12" y1="20" x2="12" y2="4"></line>
                        <line x1="6" y1="20" x2="6" y2="14"></line>
                    </svg>
                    Reports
                </a>
            </li>
            <li class="nav-item">
                <a class="nav-link" href="http://getbootstrap.com/docs/4.0/examples/dashboard/#">
                    <svg xmlns="http://www.w3.org/2000/svg" width="24" height="24" viewBox="0 0 24 24" fill="none" stroke="currentColor" stroke-width="2" stroke-linecap="round" stroke-linejoin="round" class="feather feather-layers">
                        <polygon points="12 2 2 7 12 12 22 7 12 2"></polygon>
                        <polyline points="2 17 12 22 22 17"></polyline>
                        <polyline points="2 12 12 17 22 12"></polyline>
                    </svg>
                    Integrations
                </a>
            </li>
        </ul>

        <h6 class="sidebar-heading d-flex justify-content-between align-items-center px-3 mt-4 mb-1 text-muted">
            <span>Saved reports</span>
            <a class="d-flex align-items-center text-muted" href="http://getbootstrap.com/docs/4.0/examples/dashboard/#">
                <svg xmlns="http://www.w3.org/2000/svg" width="24" height="24" viewBox="0 0 24 24" fill="none" stroke="currentColor" stroke-width="2" stroke-linecap="round" stroke-linejoin="round" class="feather feather-plus-circle"><circle cx="12" cy="12" r="10"></circle><line x1="12" y1="8" x2="12" y2="16"></line><line x1="8" y1="12" x2="16" y2="12"></line></svg>
            </a>
        </h6>
        <ul class="nav flex-column mb-2">
            <li class="nav-item">
                <a class="nav-link" href="http://getbootstrap.com/docs/4.0/examples/dashboard/#">
                    <svg xmlns="http://www.w3.org/2000/svg" width="24" height="24" viewBox="0 0 24 24" fill="none" stroke="currentColor" stroke-width="2" stroke-linecap="round" stroke-linejoin="round" class="feather feather-file-text">
                        <path d="M14 2H6a2 2 0 0 0-2 2v16a2 2 0 0 0 2 2h12a2 2 0 0 0 2-2V8z"></path>
                        <polyline points="14 2 14 8 20 8"></polyline>
                        <line x1="16" y1="13" x2="8" y2="13"></line>
                        <line x1="16" y1="17" x2="8" y2="17"></line>
                        <polyline points="10 9 9 9 8 9"></polyline>
                    </svg>
                    Current month
                </a>
            </li>
            <li class="nav-item">
                <a class="nav-link" href="http://getbootstrap.com/docs/4.0/examples/dashboard/#">
                    <svg xmlns="http://www.w3.org/2000/svg" width="24" height="24" viewBox="0 0 24 24" fill="none" stroke="currentColor" stroke-width="2" stroke-linecap="round" stroke-linejoin="round" class="feather feather-file-text">
                        <path d="M14 2H6a2 2 0 0 0-2 2v16a2 2 0 0 0 2 2h12a2 2 0 0 0 2-2V8z"></path>
                        <polyline points="14 2 14 8 20 8"></polyline>
                        <line x1="16" y1="13" x2="8" y2="13"></line>
                        <line x1="16" y1="17" x2="8" y2="17"></line>
                        <polyline points="10 9 9 9 8 9"></polyline>
                    </svg>
                    Last quarter
                </a>
            </li>
            <li class="nav-item">
                <a class="nav-link" href="http://getbootstrap.com/docs/4.0/examples/dashboard/#">
                    <svg xmlns="http://www.w3.org/2000/svg" width="24" height="24" viewBox="0 0 24 24" fill="none" stroke="currentColor" stroke-width="2" stroke-linecap="round" stroke-linejoin="round" class="feather feather-file-text">
                        <path d="M14 2H6a2 2 0 0 0-2 2v16a2 2 0 0 0 2 2h12a2 2 0 0 0 2-2V8z"></path>
                        <polyline points="14 2 14 8 20 8"></polyline>
                        <line x1="16" y1="13" x2="8" y2="13"></line>
                        <line x1="16" y1="17" x2="8" y2="17"></line>
                        <polyline points="10 9 9 9 8 9"></polyline>
                    </svg>
                    Social engagement
                </a>
            </li>
            <li class="nav-item">
                <a class="nav-link" href="http://getbootstrap.com/docs/4.0/examples/dashboard/#">
                    <svg xmlns="http://www.w3.org/2000/svg" width="24" height="24" viewBox="0 0 24 24" fill="none" stroke="currentColor" stroke-width="2" stroke-linecap="round" stroke-linejoin="round" class="feather feather-file-text">
                        <path d="M14 2H6a2 2 0 0 0-2 2v16a2 2 0 0 0 2 2h12a2 2 0 0 0 2-2V8z"></path>
                        <polyline points="14 2 14 8 20 8"></polyline>
                        <line x1="16" y1="13" x2="8" y2="13"></line>
                        <line x1="16" y1="17" x2="8" y2="17"></line>
                        <polyline points="10 9 9 9 8 9"></polyline>
                    </svg>
                    Year-end sale
                </a>
            </li>
        </ul>
    </div>
</nav>

</body>
</html>
- 在登陆也输入账户admin,密码123456登陆,主页显示效果


 6483
6483


 被折叠的 条评论
为什么被折叠?
被折叠的 条评论
为什么被折叠?
 到【灌水乐园】发言


