


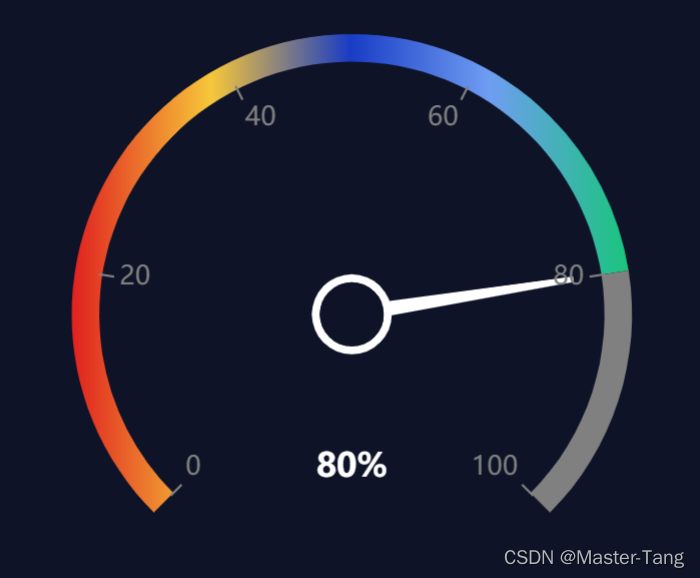
目标图案:
创建组件DashBoard.vue:
<template>
  <div id="dashboardHumidity" style="height: 100%"></div>
</template>

<script>
export default {
  name: "DashBoard",
  props: {
    // 正常的业务数据,对应echarts仪表盘配置中series[0].data
    seriesData: {
      type: Array,
      default: () => [],
    },
    seriesColor: {
      type: Array,
      default: () => [],
    },
  },
  data() {
    return {
      chart: null
    };
  },
  mounted() {
    // 仪表盘基础参数
    this.chart = this.$echarts.init(this.$el);
    this.dashboardBasicParameters();
  },
  methods: {
    dashboardBasicParameters() {
      var dataArr = this.seriesData;
      var color = new this.$echarts.graphic.LinearGradient(0, 0, 1, 0, this.seriesColor);
      var rich = {
        white: {//标题参数
          fontSize: 14,
          color: '#FFFFFF',
          padding: [0, 0, 0, 0],
        },
        radius: {
          width: 350,
          height: 80,
          // lineHeight:80,
          borderWidth: 1,
          borderColor: '#0092F2',
          fontSize: 25,
          color: '#fff',
          backgroundColor: '#1B215B',
          borderRadius: 20,
          textAlign: 'center',
        },
        size: {
          height: 300,
          padding: [0, 0, 0, 0]
        }
      }
      this.chart.setOption({
        tooltip: {
          formatter: "{a} : {c}%"
        },
        series: [
          {
            name: '综合合格率',
            type: 'gauge',
            radius: '100%',//外圈半径
            startAngle: '225',
            endAngle: '-45',
            pointer: {//指针参数
              shadowColor: 'white', //默认透明
              shadowBlur: 1,
              length: '70%',
              width: "1",
            },
            itemStyle: {
              color: '#fff',
              borderColor: "#fff",
              borderWidth: 2//指针宽度
            },
            detail: {//指针文字
              formatter: function (value) {
                var num = Math.round(value);
                return '{white|' + num + '%}';
              },
              rich: rich,
              "offsetCenter": ['0%', "70%"],//中间文字位置
            },
            data: dataArr,
            title: {
              show: false,
            },

            axisLine: {//外圆属性
              show: true,
              lineStyle: {
                color: [
                  [0, '#f0f2f5'],
                  [dataArr[0].value / 100, color],
                  [1, 'gray']
                ],
                width: 12,//有颜色区域宽度
                // shadowBlur: 15,//让外圈有阴影
                // shadowColor: '#B0C4DE',
                shadowOffsetX: 0,
                shadowOffsetY: 0,
                opacity: 1
              }
            },
            axisTick: {
              show: false
            },
            splitLine: {
              show: false,
              length: 20,
              lineStyle: {
                color: '#00377a',
                width: 2,
                type: 'solid',
              },
            },
            axisLabel: {
              show: false
            },
            animationDuration: 4000,
          },
          {
            name: "白色圈刻度",
            type: "gauge",
            radius: "80%",//刻度半径
            startAngle: 225, //刻度起始
            endAngle: -45, //刻度结束
            min: 0,
            max: 100,
            splitNumber: 5,
            z: 4,
            axisTick: {
              show: false
            },
            splitLine: {
              length: 6, //刻度节点线长度
              lineStyle: {
                width: 2,
                color: 'gray'
              } //刻度节点线
            },
            axisLabel: {
              color: 'gray',
              fontSize: 10,
            }, //刻度节点文字颜色
            pointer: {
              show: false
            },
            axisLine: {
              lineStyle: {
                opacity: 0
              }
            },
            detail: {
              show: false
            },
            data: [{
              value: 0,
              name: ""
            }]
          },
            //如果不需要中间圆环,可以不用
          {
            //指针外环
            name: '综合合格率',
            type: 'pie',
            hoverAnimation: false,
            legendHoverLink: false,
            radius: ['5%', '8%'],
            z: 5,
            label: {
              normal: {
                show: false
              }
            },
            labelLine: {
              normal: {
                show: false
              }
            },
            data: [{
              value: dataArr[0].value,
              name: "综合合格率",
              itemStyle: {
                normal: {
                  color: "#fff",
                }
              }
            }]
          },
          {
            //指针内环
            name: '综合合格率',
            type: 'pie',
            hoverAnimation: false,
            legendHoverLink: false,
            radius: ['0%', '6%'],
            z: 5,
            label: {
              normal: {
                show: false
              }
            },
            labelLine: {
              normal: {
                show: false
              }
            },
            data: [{
              value: dataArr[0].value,
              name: "综合合格率",
              itemStyle: {
                normal: {
                  color: "#0E1327"
                }
              }
            }]
          }

        ]
      }, true)

    },
  },
}
</script>

<style scoped>
</style>
使用组件:
<template>
..........
    <div>
         <Dashboard :series-data="dataArray" :series-color="colorArray"/>
    </div>
..........
</template>

<script>
import Dashboard from "";
export default {
    components: {
        Dashboard,
    },
data() {
    return {
      dataArray: [
        {
          value: 92,
        }
      ],
      colorArray: [
        {
          offset: 0,
          color: 'rgba(224, 32, 32, 1)',
        }, {
          offset: 0.25,
          color: 'rgba(247, 199, 57, 1)',
        },
        {
          offset: 0.5,
          color: 'rgba(25, 60, 197, 1)',
        },
        {
          offset: 0.75,
          color: 'rgba(111, 157, 242, 1)',
        },
        {
          offset: 1,
          color: 'rgba(25, 197, 125, 1)',
        }
      ],
    }
  }
}

</script>
附送学习使用必备网址:
 https://echarts.apache.org/examples/zh/index.html#chart-type-gauge


 4008
4008


 被折叠的 条评论
为什么被折叠?
被折叠的 条评论
为什么被折叠?
 到【灌水乐园】发言


