Matplotlib中的Hist分组是开区间还是闭区间?

摘要

Matplotlib是Python中重要的库,其正确应用对提高科研效率具有重要帮助。然而,一些同学在使用plt.hist的时候却没有注意到其分组的区间是开区间还是闭区间的问题,这会导致统计结果出错。针对以上问题,采用蒙特卡罗(Monte-Carlo, MC)仿真方法,随机出一组不具有自相关性的数字序列,并应用计算机辅助绘图(Computer Aided Graphics, CAG)技术进行可视化。结果表明,最后一个区间是闭区间,其余区间都是左闭右开。有效分析了区间开闭问题,增加了博客文章数,提高了工作效率。


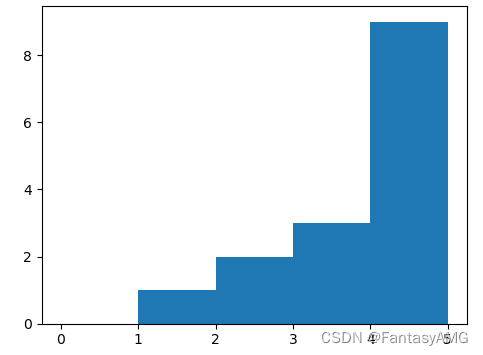
结论:最后一个区间是闭区间,其余区间都是左闭右开。

证明:

a = np.array([1,2,2,3,3,3,4,4,4,4,5,5,5,5,5])

bins = [0,1,2,3,4,5]
x = a.copy()
plt.figure()
[n, bins, patches] = plt.hist(x, bins=bins)

运行结果:

  • 2
    点赞
  • 0
    收藏
    觉得还不错? 一键收藏
  • 0
    评论
Matplotlib hist is a function in the Matplotlib library used to create histograms. A histogram is a graphical representation of the distribution of data. It shows the frequency of occurrences of a variable within a given range. The hist function takes an array of data and plots the frequency of the values within a specified number of bins. The syntax for the Matplotlib hist function is: ```python matplotlib.pyplot.hist(x, bins=None, range=None, density=False, weights=None, cumulative=False, bottom=None, histtype='bar', align='mid', orientation='vertical', rwidth=None, log=False, color=None, label=None, stacked=False, normed=None, *, data=None, **kwargs) ``` - `x`: This is the input data array. - `bins`: This specifies the number of bins to use in the histogram. If not specified, the default value is 10. - `range`: This specifies the range of the data to be plotted. - `density`: This is a boolean parameter that determines whether to normalize the histogram or not. - `color`: This specifies the color of the bars in the histogram. - `label`: This is used to label the histogram. - `histtype`: This specifies the type of histogram to be plotted, such as ‘bar’, ‘step’, or ‘stepfilled’. - `orientation`: This specifies the orientation of the bars in the histogram, such as ‘horizontal’ or ‘vertical’. Here is an example of how to use the Matplotlib hist function: ```python import matplotlib.pyplot as plt import numpy as np # Generate some random data data = np.random.normal(size=1000) # Create a histogram using Matplotlib hist plt.hist(data, bins=30, density=True, color='green', alpha=0.5) # Add labels and title plt.xlabel('Data') plt.ylabel('Frequency') plt.title('Histogram of Random Data') # Show the plot plt.show() ``` This will create a histogram of 1000 randomly generated data points with 30 bins, normalized to a density plot, in green color with an alpha value of 0.5. The plot will also have x and y labels as well as a title.

“相关推荐”对你有帮助么?

  • 非常没帮助
  • 没帮助
  • 一般
  • 有帮助
  • 非常有帮助
提交
评论
添加红包

请填写红包祝福语或标题

红包个数最小为10个

红包金额最低5元

当前余额3.43前往充值 >
需支付:10.00
成就一亿技术人!
领取后你会自动成为博主和红包主的粉丝 规则
hope_wisdom
发出的红包
实付
使用余额支付
点击重新获取
扫码支付
钱包余额 0

抵扣说明:

1.余额是钱包充值的虚拟货币,按照1:1的比例进行支付金额的抵扣。
2.余额无法直接购买下载,可以购买VIP、付费专栏及课程。

余额充值