


本示例说明如何在MATLAB中创建、显示和修改图形对象。
图形对象
MATLAB创建绘图时,将创建一系列图形对象。图形、轴、线条、贴片和文本是图形对象。下图具有三个图形对象:轴、线条和文本。使用可选的输出参数来存储创建的图形对象。
x = -pi:pi/20:pi;
y = sin(x);
f = figure;
p = plot(x,y);
txt1 = text(0.2,0,'sin(x)');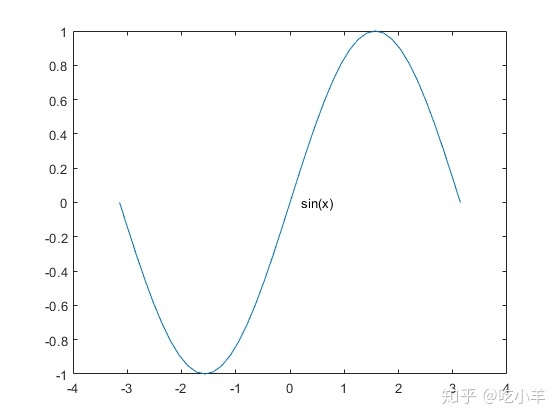
所有图形对象都具有可以查看和修改的属性。这些属性具有默认值。行对象p,显示最常用的线条属性,如Color,LineStyle,和LineWidth。
p
p =
Line with properties:
Color: [0 0.4470 0.7410]
LineStyle: '-'
LineWidth: 0.5000
Marker: 'none'
MarkerSize: 6
MarkerFaceColor: 'none'
XData: [1x41 double]
YData: [1x41 double]
ZData: [1x0 double]
Show all properties如果创建对象的命令中没有分号,那么MATLAB会有相同的显示。
txt2 = text(x(end), y(end), 'pi')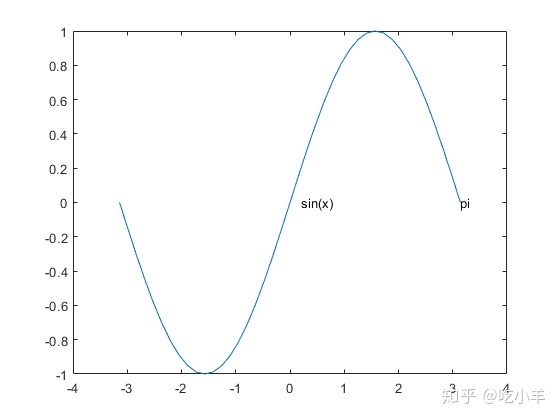
txt2 =
Text (pi) with properties:
String: 'pi'
FontSize: 10
FontWeight: 'normal'
FontName: 'Helvetica'
Color: [0 0 0]
HorizontalAlignment: 'left'
Position: [3.1416 1.2246e-16 0]
Units: 'data'
Show all properties获取图形对象属性
要访问单个图形对象的属性,请使用点符号语法:object.PropertyName。例如,返回线条对象LineWidth的属性。
 pcol = p.LineWidth
pcol = 0.5000通过设置Color属性,将线条颜色更改为红色。
p.Color = 'red';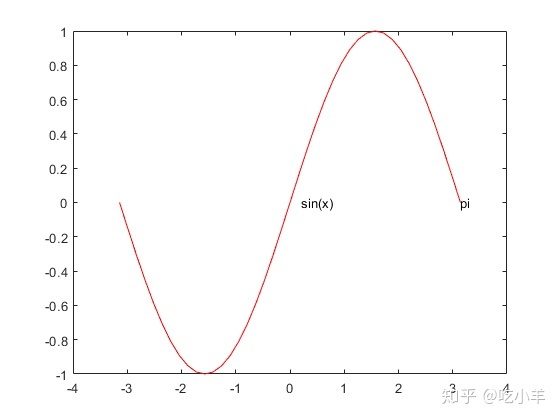
对象层级
MATLAB按层次结构排列图形对象。层次结构的顶部是一个称为图形根的特殊对象。要访问图形根,请使用该groot功能。
groot
ans =
Graphics Root with properties:
CurrentFigure: [1x1 Figure]
ScreenPixelsPerInch: 100
ScreenSize: [1 1 1280 1024]
MonitorPositions: [1 1 1280 1024]
Units: 'pixels'
Show all properties所有图形对象(根除外)都有一个父级。例如,轴的父级是图形。
ax = gca;
ax.Parent
ans =
Figure (1) with properties:
Number: 1
Name: ''
Color: [0.9400 0.9400 0.9400]
Position: [348 480 583 437]
Units: 'pixels'
Show all properties许多对象也有子层级。该轴具有三个子对象:两个文本对象和线条对象。
ax.Children
ans =
3x1 graphics array:
Text (pi)
Text (sin(x))
Line由于轴具有多个子层级,因此Children属性的值是图形对象的数组。要访问轴的单个子级,请索引到数组。然后,我们可以设置子对象的属性。
 t = ax.Children(2);       % get the 'sin(x)' text object
 t.FontWeight = 'bold';    % set the font to bold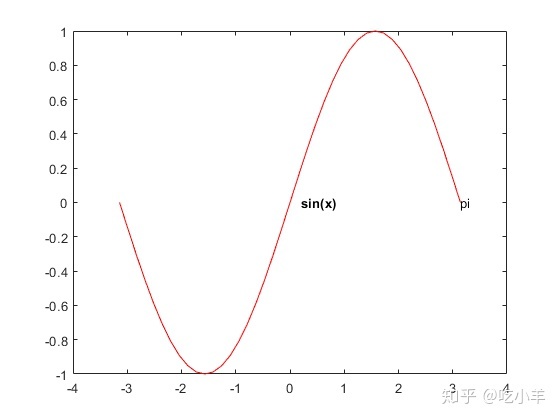
预分配图形对象数组
在MATLAB中,最佳实践是在使用数组之前对其进行预分配。使用gobjects命令预分配图形对象数组。然后可以将图形对象添加到数组。
objarray = gobjects(1,5);
objarray(1) = f;
objarray(2) = ax;
objarray(3) = p;
objarray(4) = txt1;
objarray(5) = txt2;
objarray
objarray =
1x5 graphics array:
Figure Axes Line Text Text 获取所有对象属性
MATLAB中的图形对象具有许多属性。要查看对象的所有属性,请使用get命令。
 get(f)
                  Alphamap: [1x64 double]
              BeingDeleted: off
                BusyAction: 'queue'
             ButtonDownFcn: ''
                  Children: [1x1 Axes]
                  Clipping: on
           CloseRequestFcn: 'closereq'
                     Color: [0.9400 0.9400 0.9400]
                  Colormap: [256x3 double]
               ContextMenu: [0x0 GraphicsPlaceholder]
                 CreateFcn: ''
               CurrentAxes: [1x1 Axes]
          CurrentCharacter: ''
             CurrentObject: [0x0 GraphicsPlaceholder]
              CurrentPoint: [0 0]
                 DeleteFcn: ''
              DockControls: on
                  FileName: ''
         GraphicsSmoothing: on
          HandleVisibility: 'on'
             InnerPosition: [348 480 583 437]
             IntegerHandle: on
             Interruptible: on
            InvertHardcopy: on
               KeyPressFcn: ''
             KeyReleaseFcn: ''
                   MenuBar: 'none'
                      Name: ''
                  NextPlot: 'add'
                    Number: 1
               NumberTitle: on
             OuterPosition: [344 476 591 464]
          PaperOrientation: 'portrait'
             PaperPosition: [1.3350 3.3150 5.8300 4.3700]
         PaperPositionMode: 'auto'
                 PaperSize: [8.5000 11]
                 PaperType: 'usletter'
                PaperUnits: 'inches'
                    Parent: [1x1 Root]
                   Pointer: 'arrow'
         PointerShapeCData: [16x16 double]
       PointerShapeHotSpot: [1 1]
                  Position: [348 480 583 437]
                  Renderer: 'opengl'
              RendererMode: 'auto'
                    Resize: on
                Scrollable: off
             SelectionType: 'normal'
            SizeChangedFcn: ''
                       Tag: ''
                   ToolBar: 'none'
                      Type: 'figure'
                     Units: 'pixels'
                  UserData: []
                   Visible: off
       WindowButtonDownFcn: ''
     WindowButtonMotionFcn: ''
         WindowButtonUpFcn: ''
         WindowKeyPressFcn: ''
       WindowKeyReleaseFcn: ''
      WindowScrollWheelFcn: ''
               WindowState: 'normal'
               WindowStyle: 'normal'
                  XDisplay: ':100'
注:本文根据MATLAB官网内容修改而成。
我推荐给你以下的视频教程,特点是没有PPT,不掺水,直接编程环境下的实操课程: 用360分钟了解MATLAB编程《MATLAB编程360》视频课程:
MATLAB编程360 - 网易云课堂study.163.comstudy.163.com


 185
185

 被折叠的 条评论
为什么被折叠?
被折叠的 条评论
为什么被折叠?
 到【灌水乐园】发言


