


引言
本文通过监听资源对象、日志、事件等方法讲解和验证了Flagger和Istio实现自动化金丝雀部署的原理。
由于内容较长,仅验证了自动化金丝雀部署和回滚两个功能。
实战内容参考文档:https://fluxcd.io/flagger/tutorials/istio-progressive-delivery/
什么是Flagger?
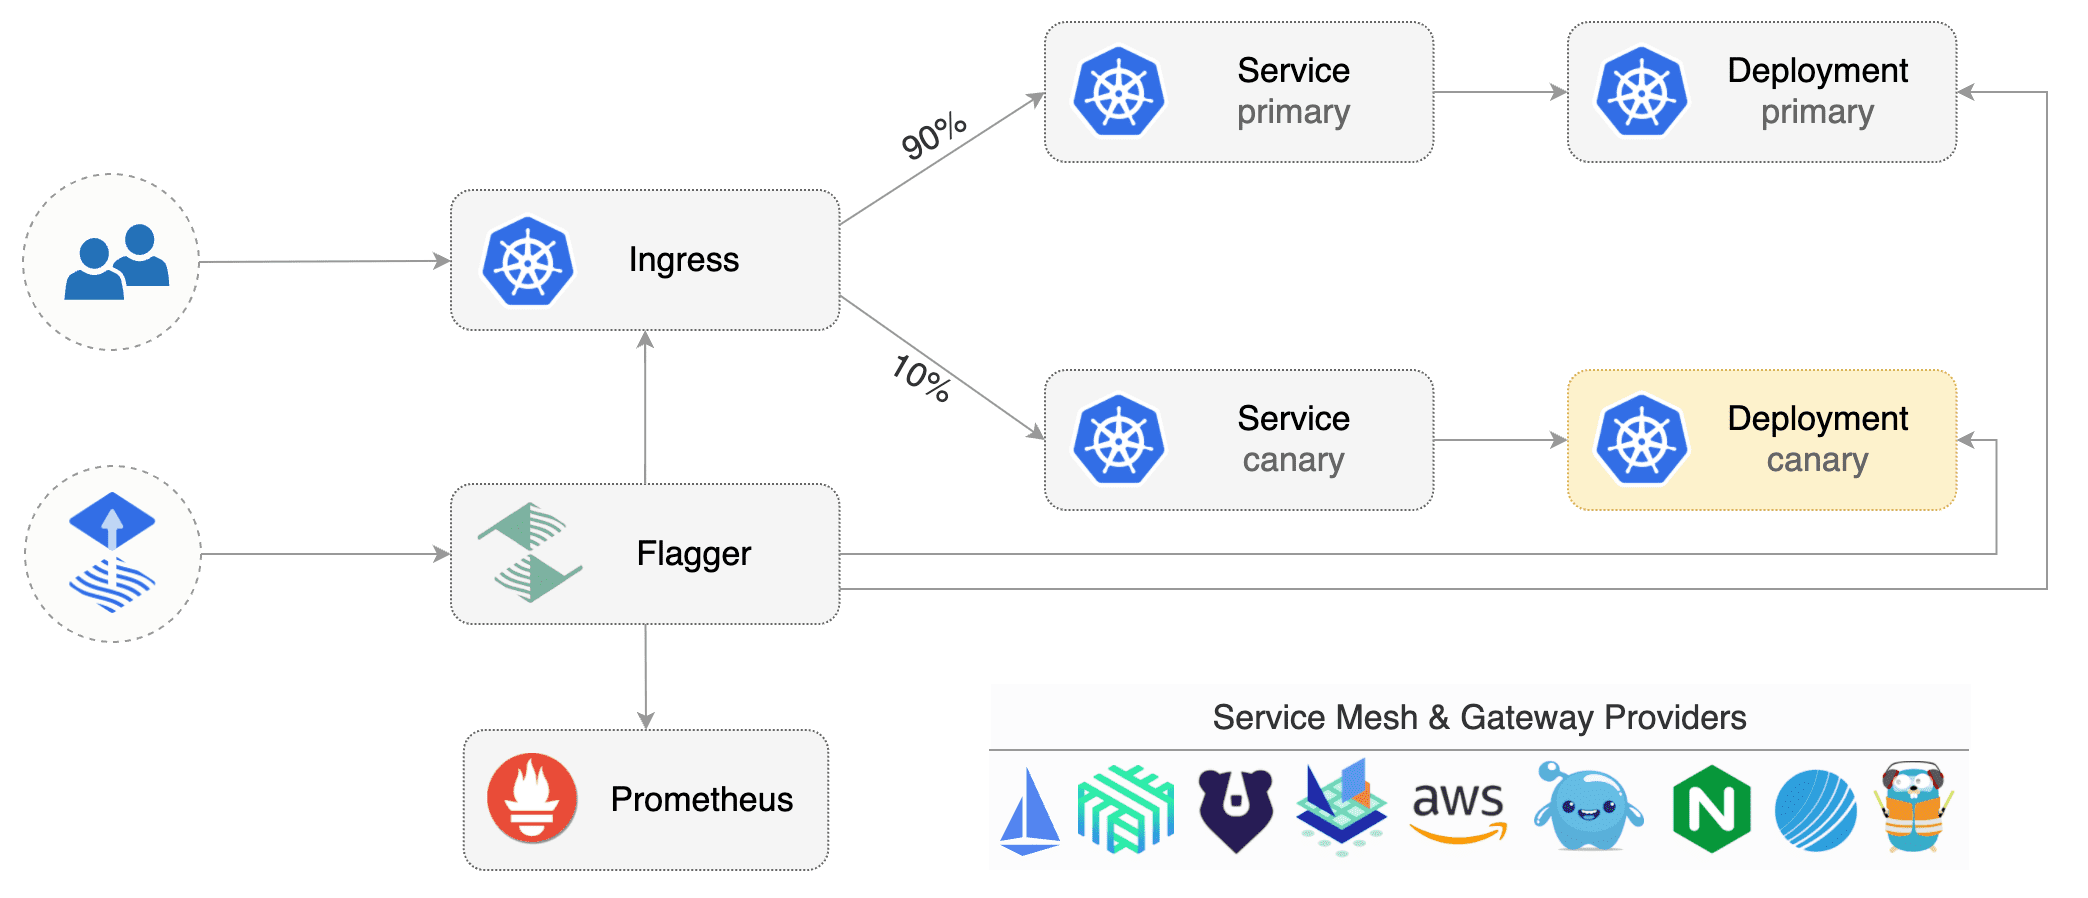
Flagger是一种渐进式交付工具,会在流量迁移时分析测量指标和运行测试任务降低发版风险,仅可以发布运行在Kubernetes的应用。
- 流量路由:Flagger采用服务网格或Ingress实现,服务网格包括:App Mesh、Istio、Linkerd、Kuma、Open Service Mesh,Ingress包括:Contour、Gloo、NGINX、Skipper、 Traefik、APISIX
- 发布分析和报警:分析数据来源支持 Prometheus、InfluxDB、Datadog、New Relic、CloudWatch、Stackdriver 、Graphite,报警支持 Slack、MS Teams、Discord 和 Rocket。
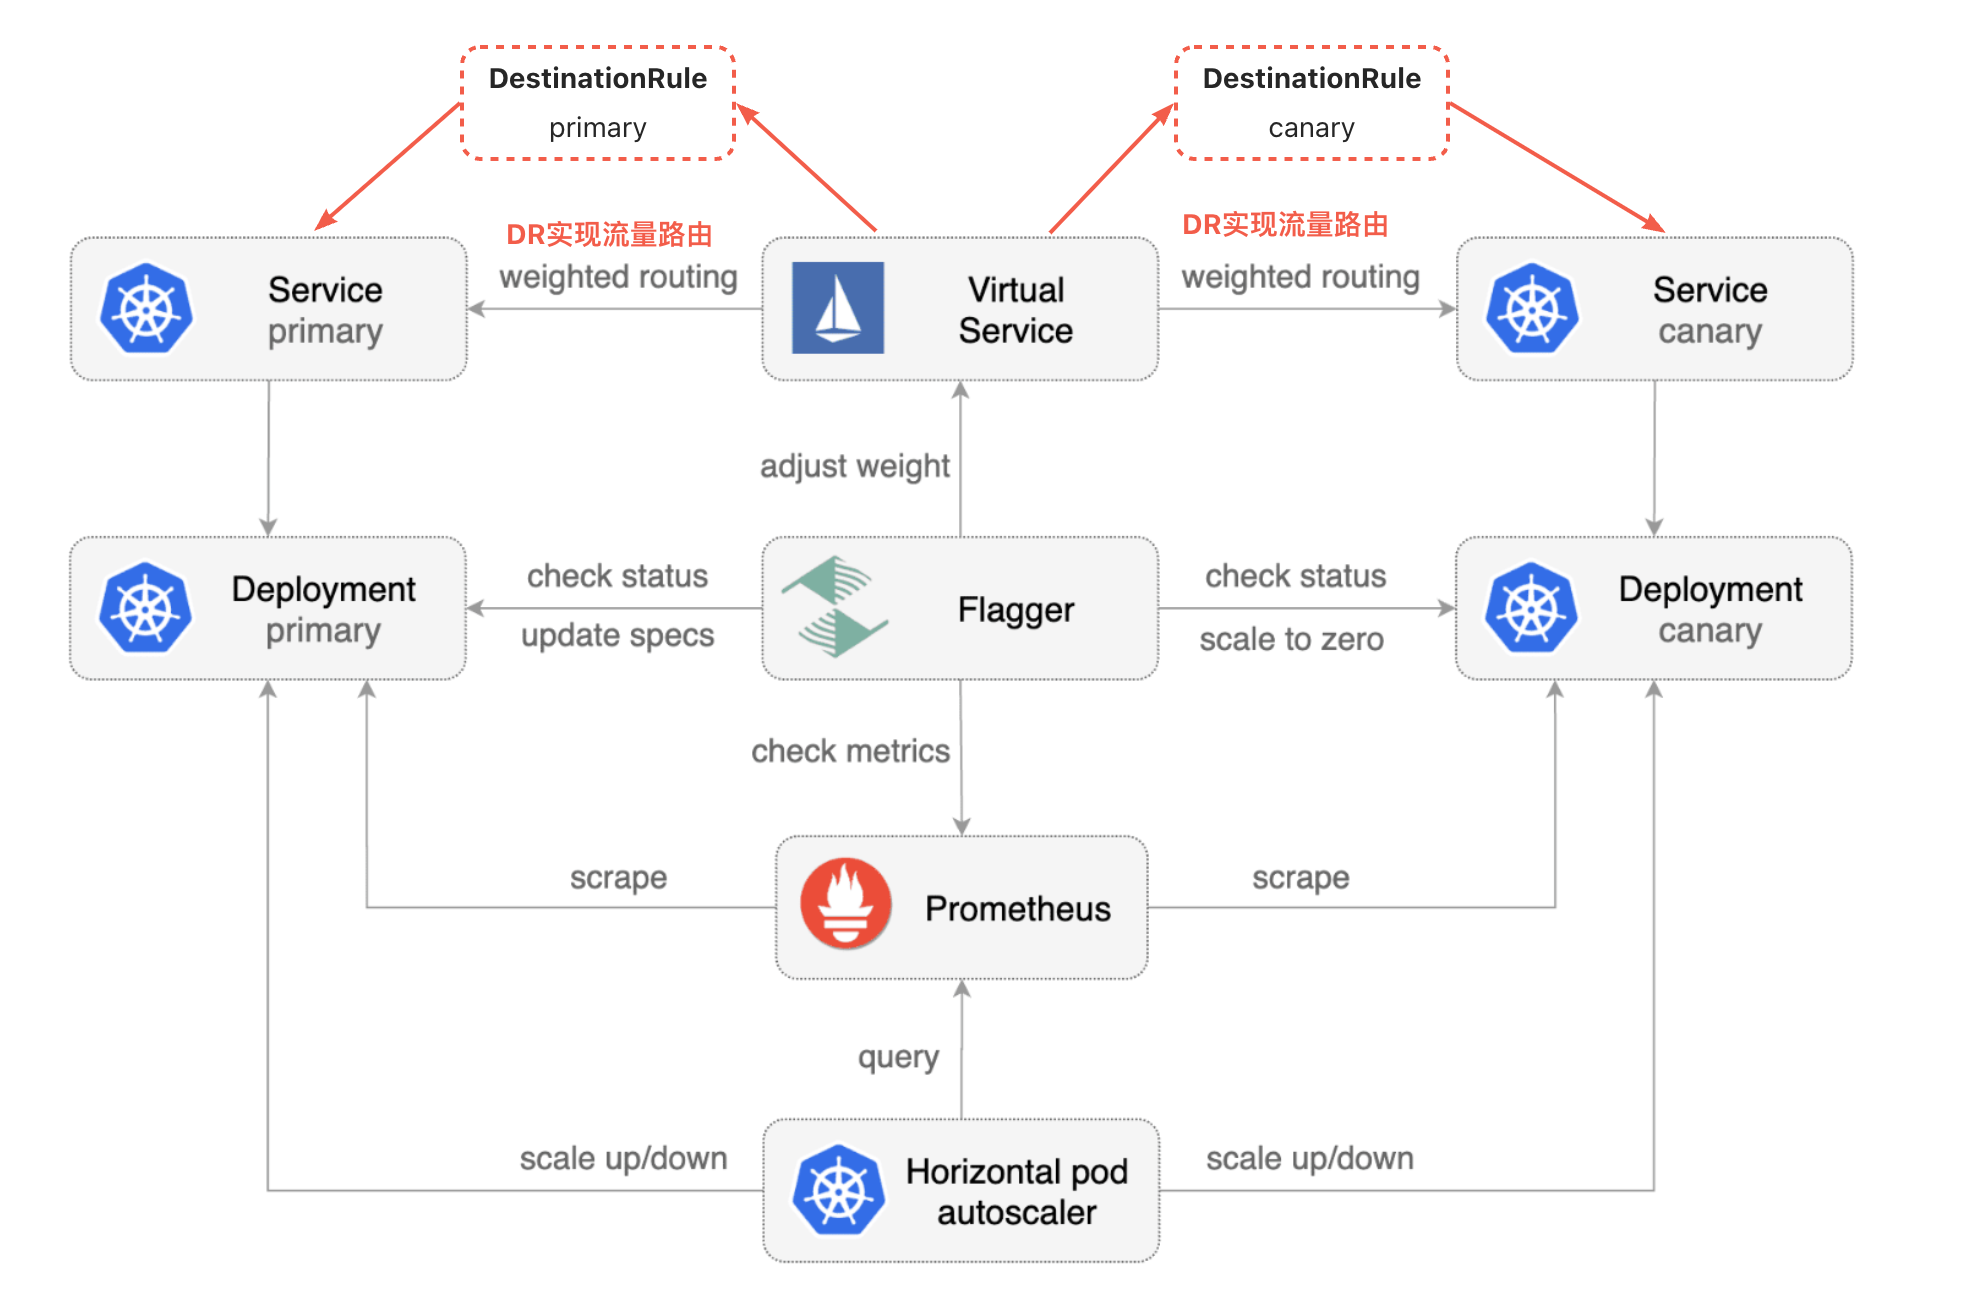
Flagger集成Istio原理
创建Canary时会解释各个资源对象的内容和功能
准备环境
安装Istio
参考博客:《Istio:搭建Istio完整环境》
安装Flagger
参考安装文档:https://fluxcd.io/flagger/install/flagger-install-on-kubernetes/
helm repo add flagger https://flagger.app
kubectl apply -f https://raw.githubusercontent.com/fluxcd/flagger/main/artifacts/flagger/crd.yaml

helm upgrade -i flagger flagger/flagger \
--namespace=istio-system \
--set crd.create=false \
--set meshProvider=istio \
--set metricsServer=http://prometheus:9090
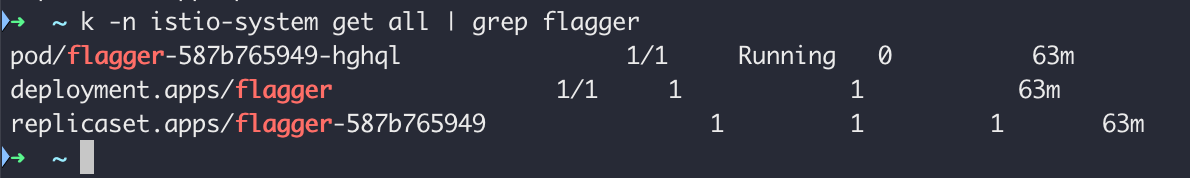
验证安装结果:
创建IngressGateway
cat <<EOF | kubectl apply -f -
apiVersion: networking.istio.io/v1alpha3
kind: Gateway
metadata:
  name: public-gateway
  namespace: istio-system
spec:
  selector:
    istio: ingressgateway
  servers:
    - port:
        number: 80
        name: http
        protocol: HTTP
      hosts:
        - "*"
EOF
部署podinfo
kubectl create ns test
kubectl label namespace test istio-injection=enabled
kubectl apply -k https://github.com/fluxcd/flagger//kustomize/podinfo?ref=main
kubectl apply -k https://github.com/fluxcd/flagger//kustomize/tester\?ref\=main
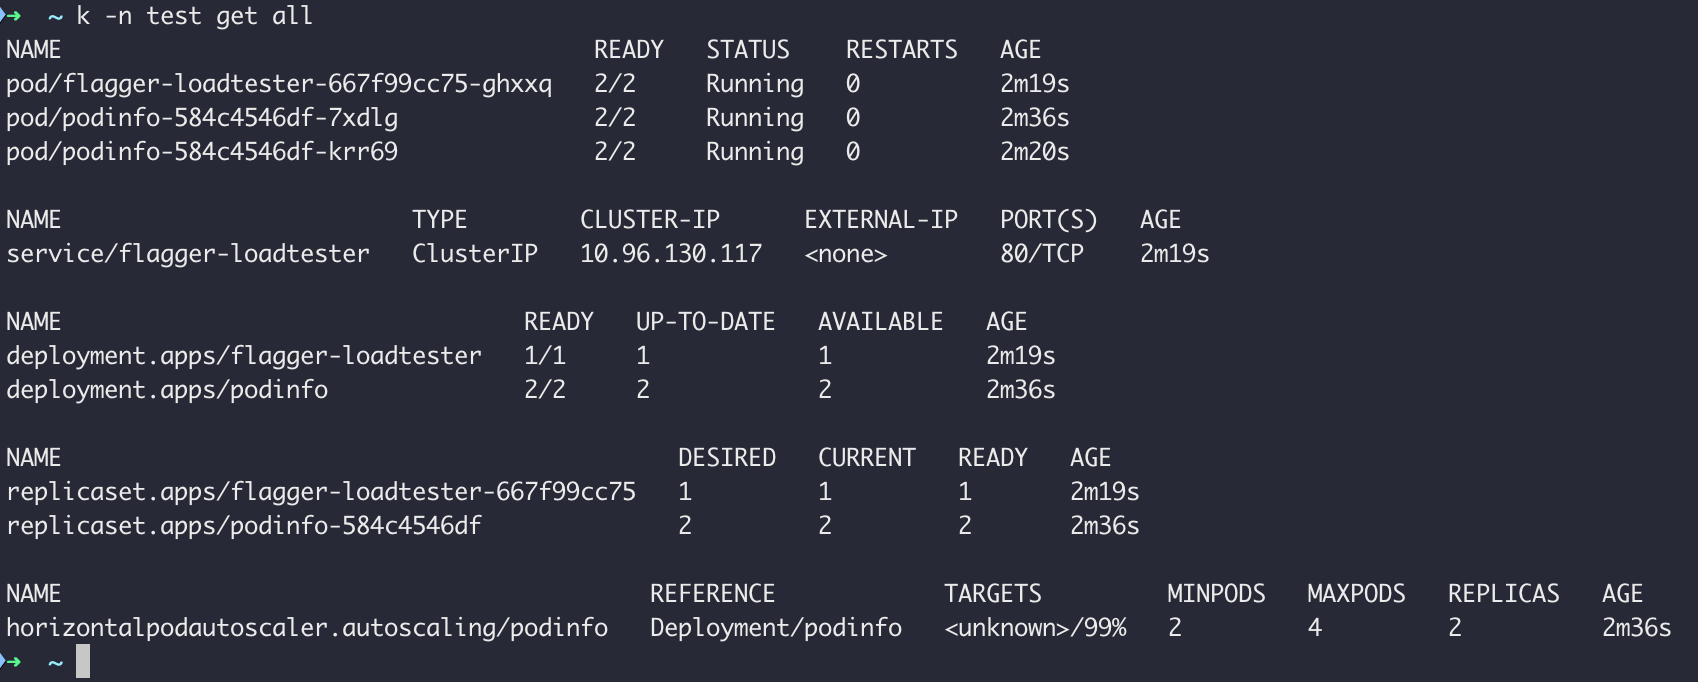
部署结果
创建Canary
与官网案例差异点:将
example.com替换为test.canary.istio.cn)
cat <<EOF | kubectl apply -f -
apiVersion: flagger.app/v1beta1
kind: Canary
metadata:
name: podinfo
namespace: test
spec:
# deployment reference
targetRef:
apiVersion: apps/v1
kind: Deployment
name: podinfo
# the maximum time in seconds for the canary deployment
# to make progress before it is rollback (default 600s)
progressDeadlineSeconds: 60
# HPA reference (optional)
autoscalerRef:
apiVersion: autoscaling/v2beta2
kind: HorizontalPodAutoscaler
name: podinfo
service:
# service port number
port: 9898
# container port number or name (optional)
targetPort: 9898
# Istio gateways (optional)
gateways:
- public-gateway.istio-system.svc.cluster.local
# Istio virtual service host names (optional)
hosts:
- test.canary.istio.cn
# Istio traffic policy (optional)
trafficPolicy:
tls:
# use ISTIO_MUTUAL when mTLS is enabled
mode: DISABLE
# Istio retry policy (optional)
retries:
attempts: 3
perTryTimeout: 1s
retryOn: "gateway-error,connect-failure,refused-stream"
analysis:
# schedule interval (default 60s)
interval: 1m
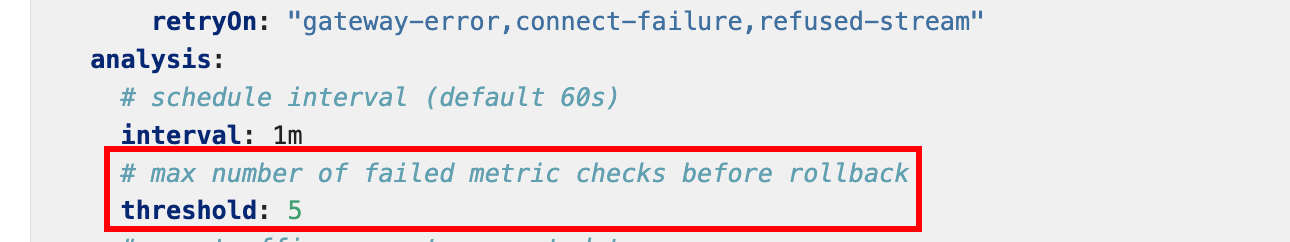
# max number of failed metric checks before rollback
threshold: 5
# max traffic percentage routed to canary
# percentage (0-100)
maxWeight: 50
# canary increment step
# percentage (0-100)
stepWeight: 10
metrics:
- name: request-success-rate
# minimum req success rate (non 5xx responses)
# percentage (0-100)
thresholdRange:
min: 99
interval: 1m
- name: request-duration
# maximum req duration P99
# milliseconds
thresholdRange:
max: 500
interval: 30s
# testing (optional)
webhooks:
- name: acceptance-test
type: pre-rollout
url: http://flagger-loadtester.test/
timeout: 30s
metadata:
type: bash
cmd: "curl -sd 'test' http://podinfo-canary:9898/token | grep token"
- name: load-test
url: http://flagger-loadtester.test/
timeout: 5s
metadata:
cmd: "hey -z 1m -q 10 -c 2 http://podinfo-canary.test:9898/"
EOF
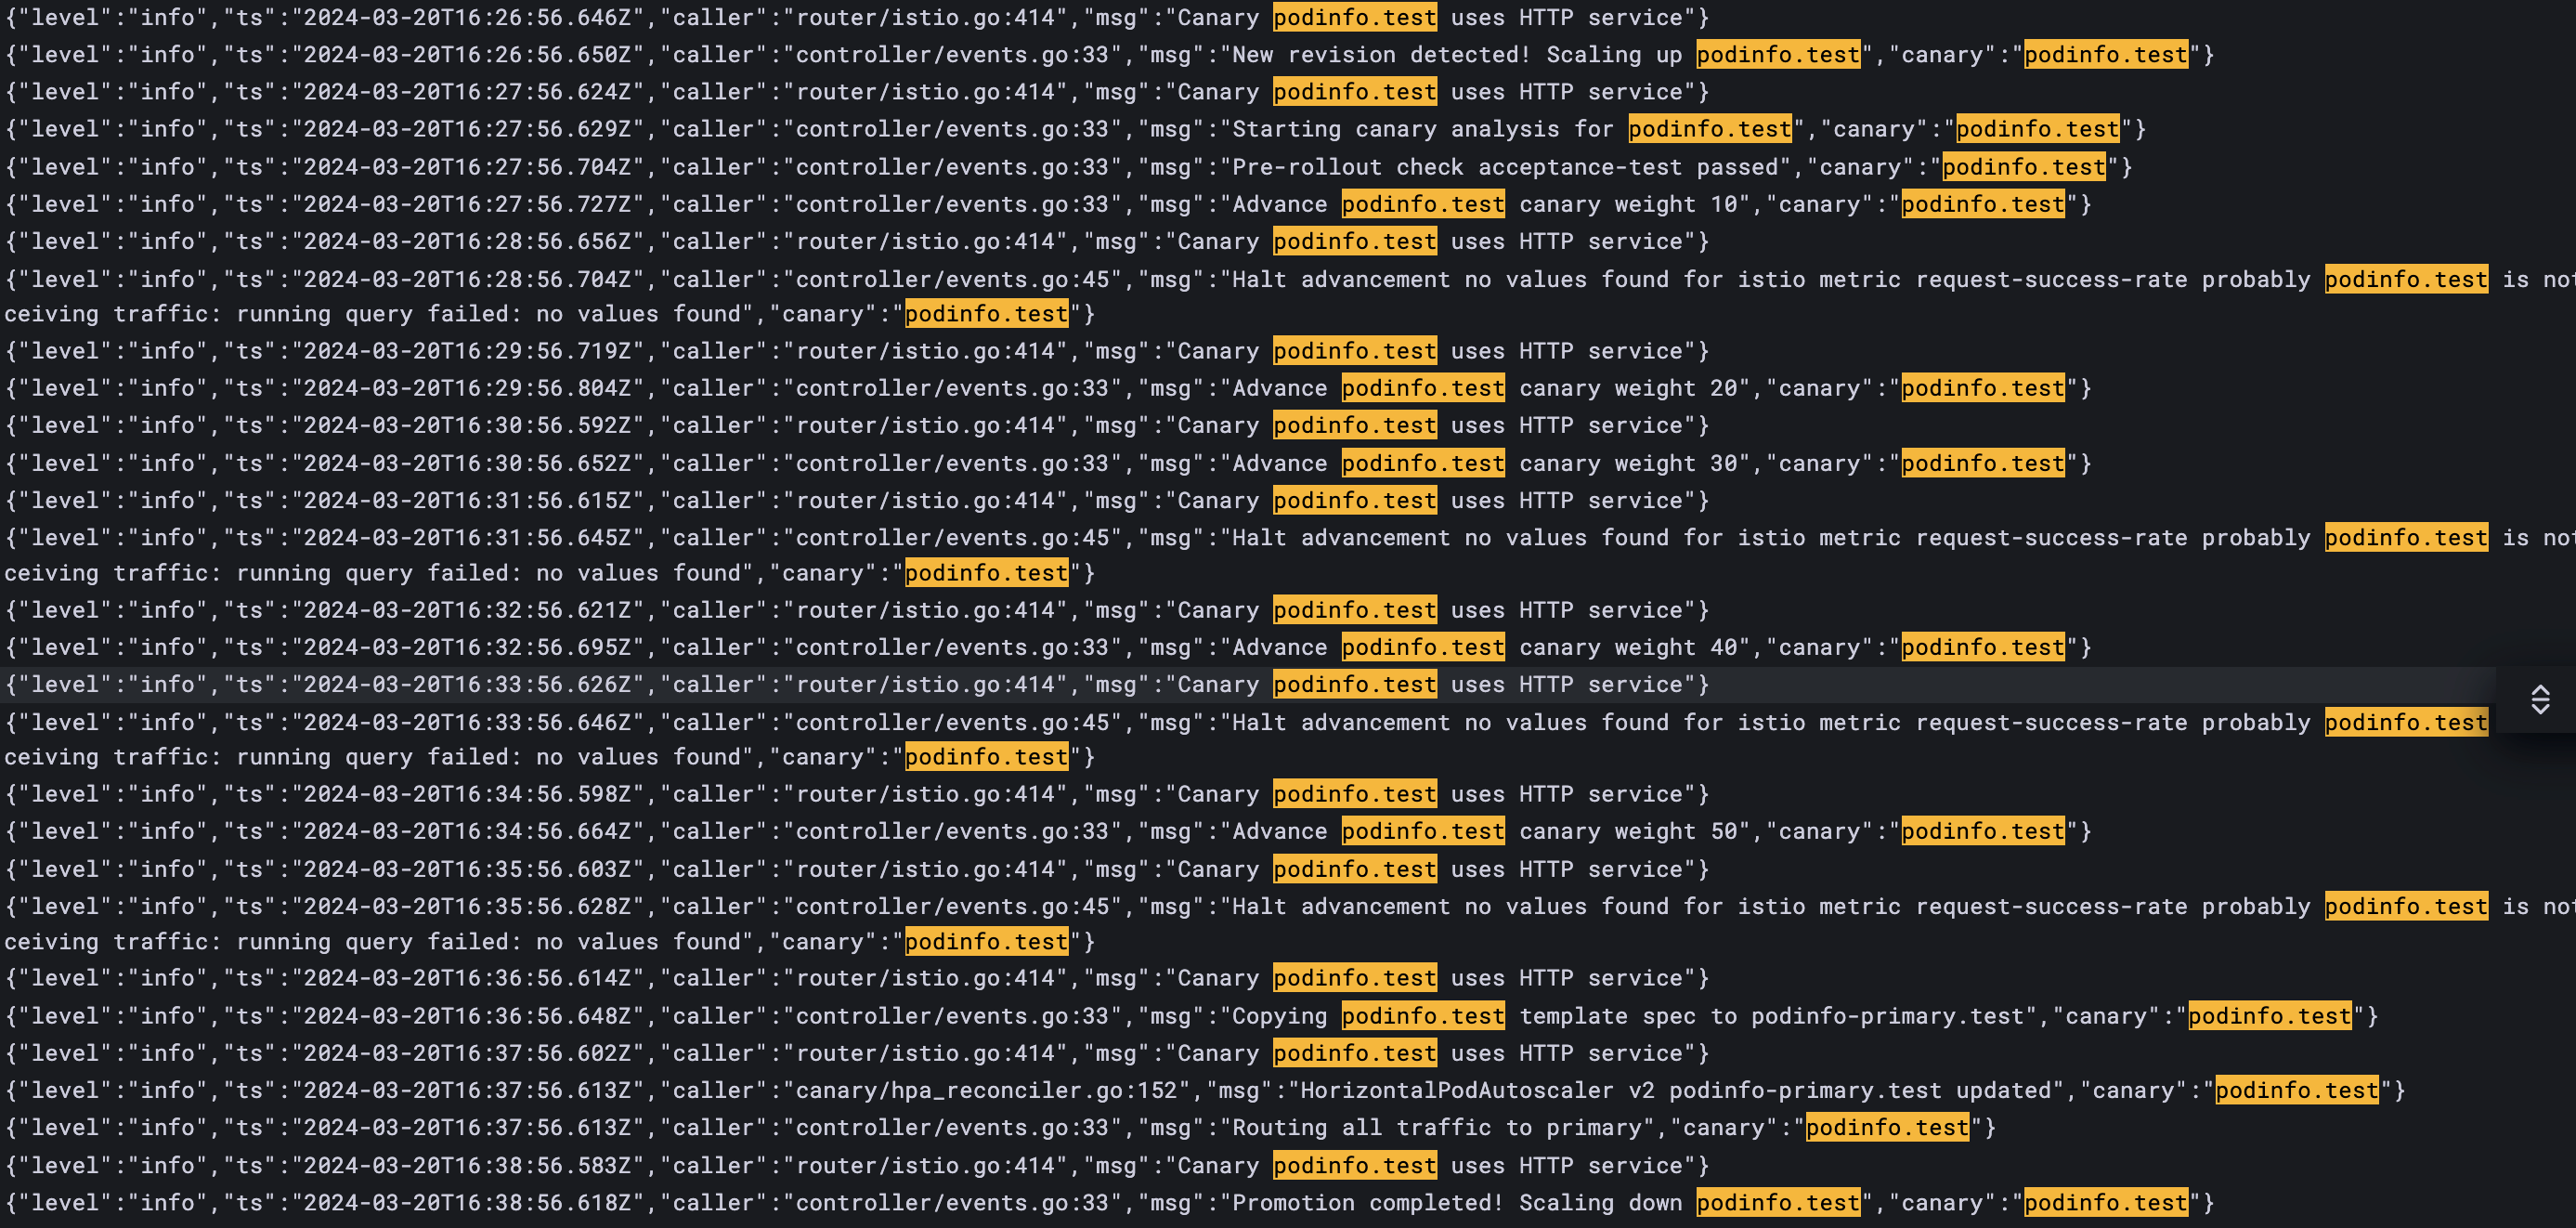
查看flagger日志如下:
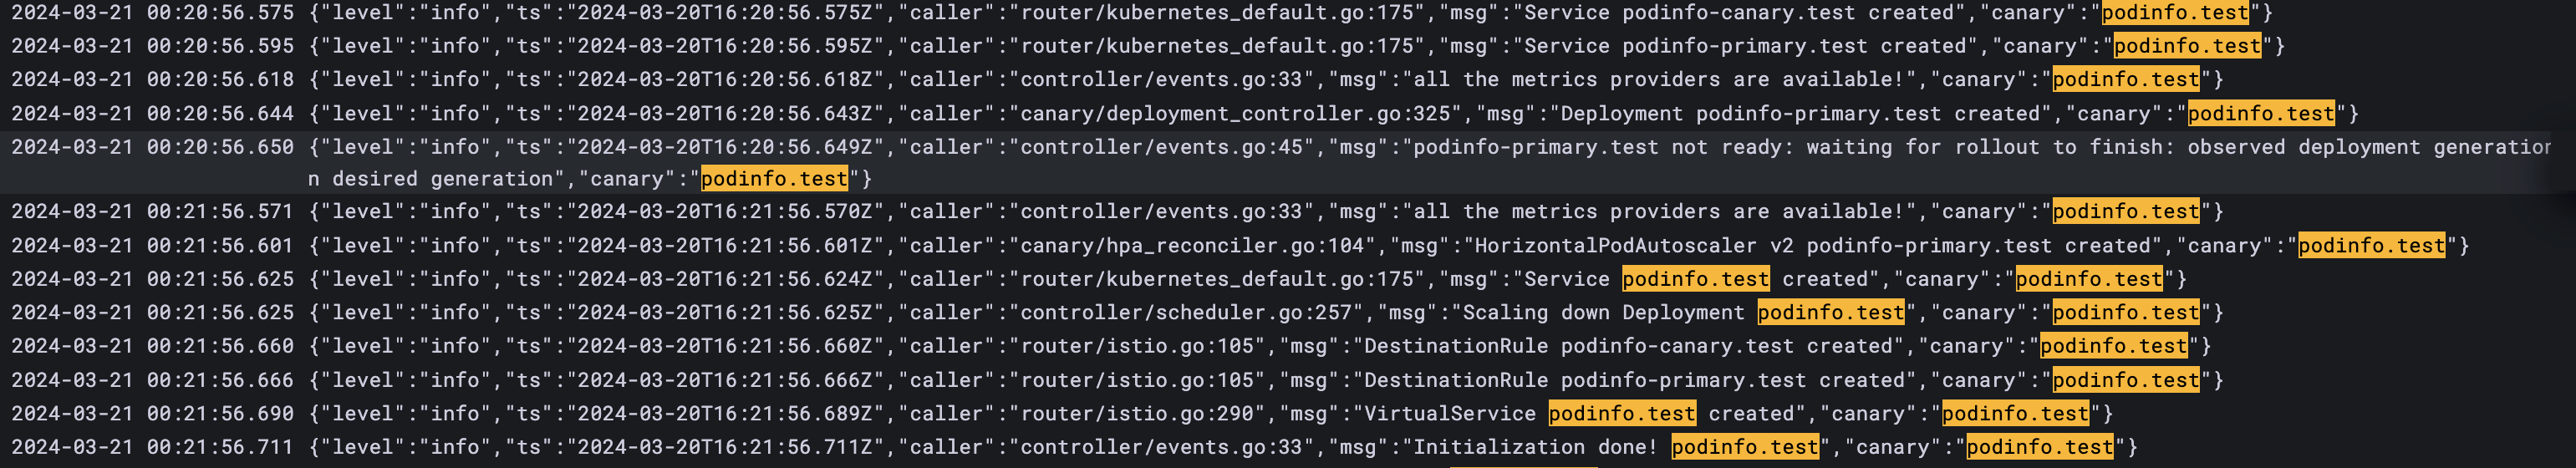
日志告诉我们:
- 创建了灰度和主两个Service
- 创建了主Deployment,同时等待Deployment就绪
- 创建了主HPA
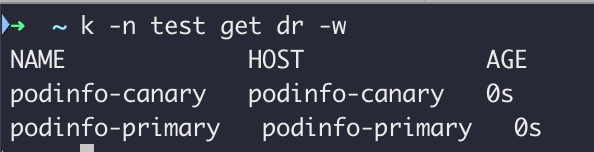
- 创建了主和灰度两个DR
- 创建了VS
接下来具体分析各资源,并了解它们实现了什么功能。
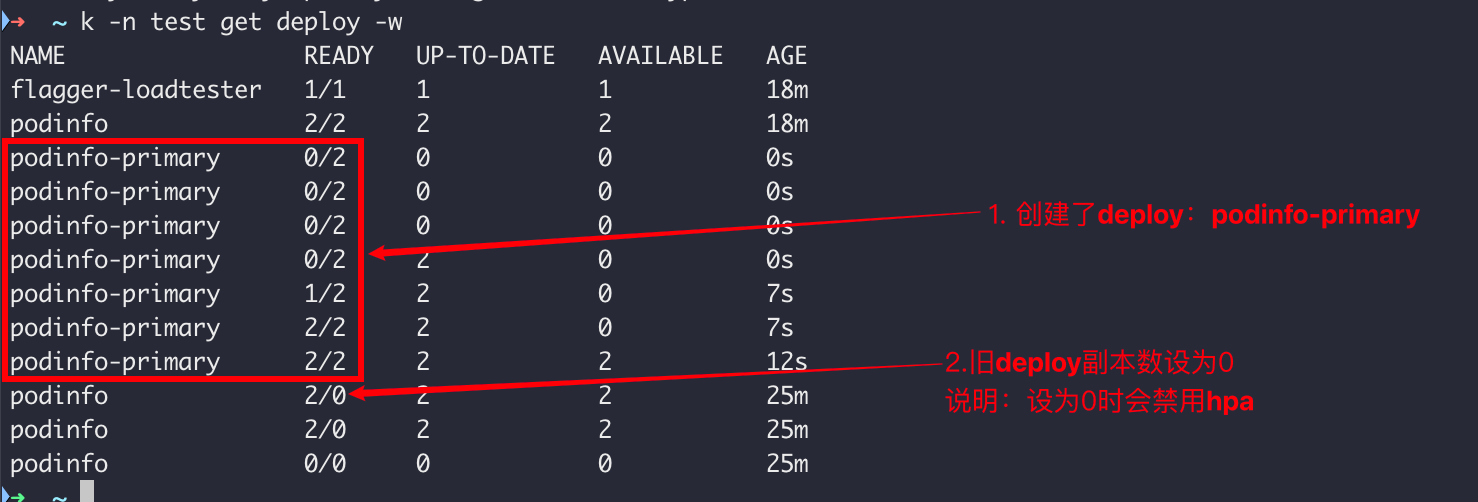
自动创建和更新Deployment
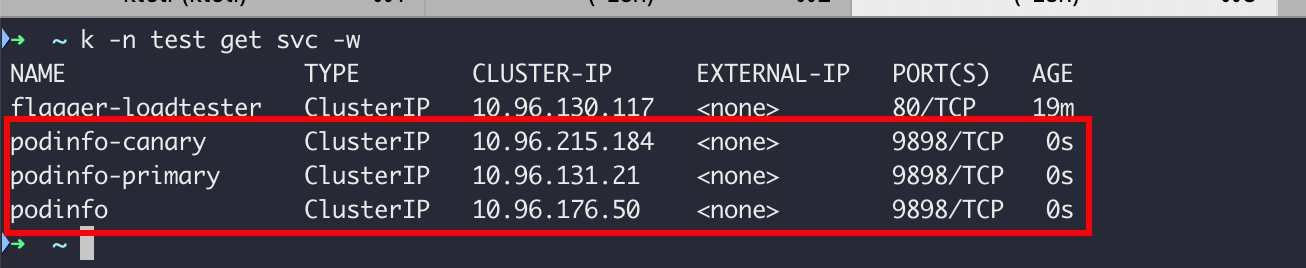
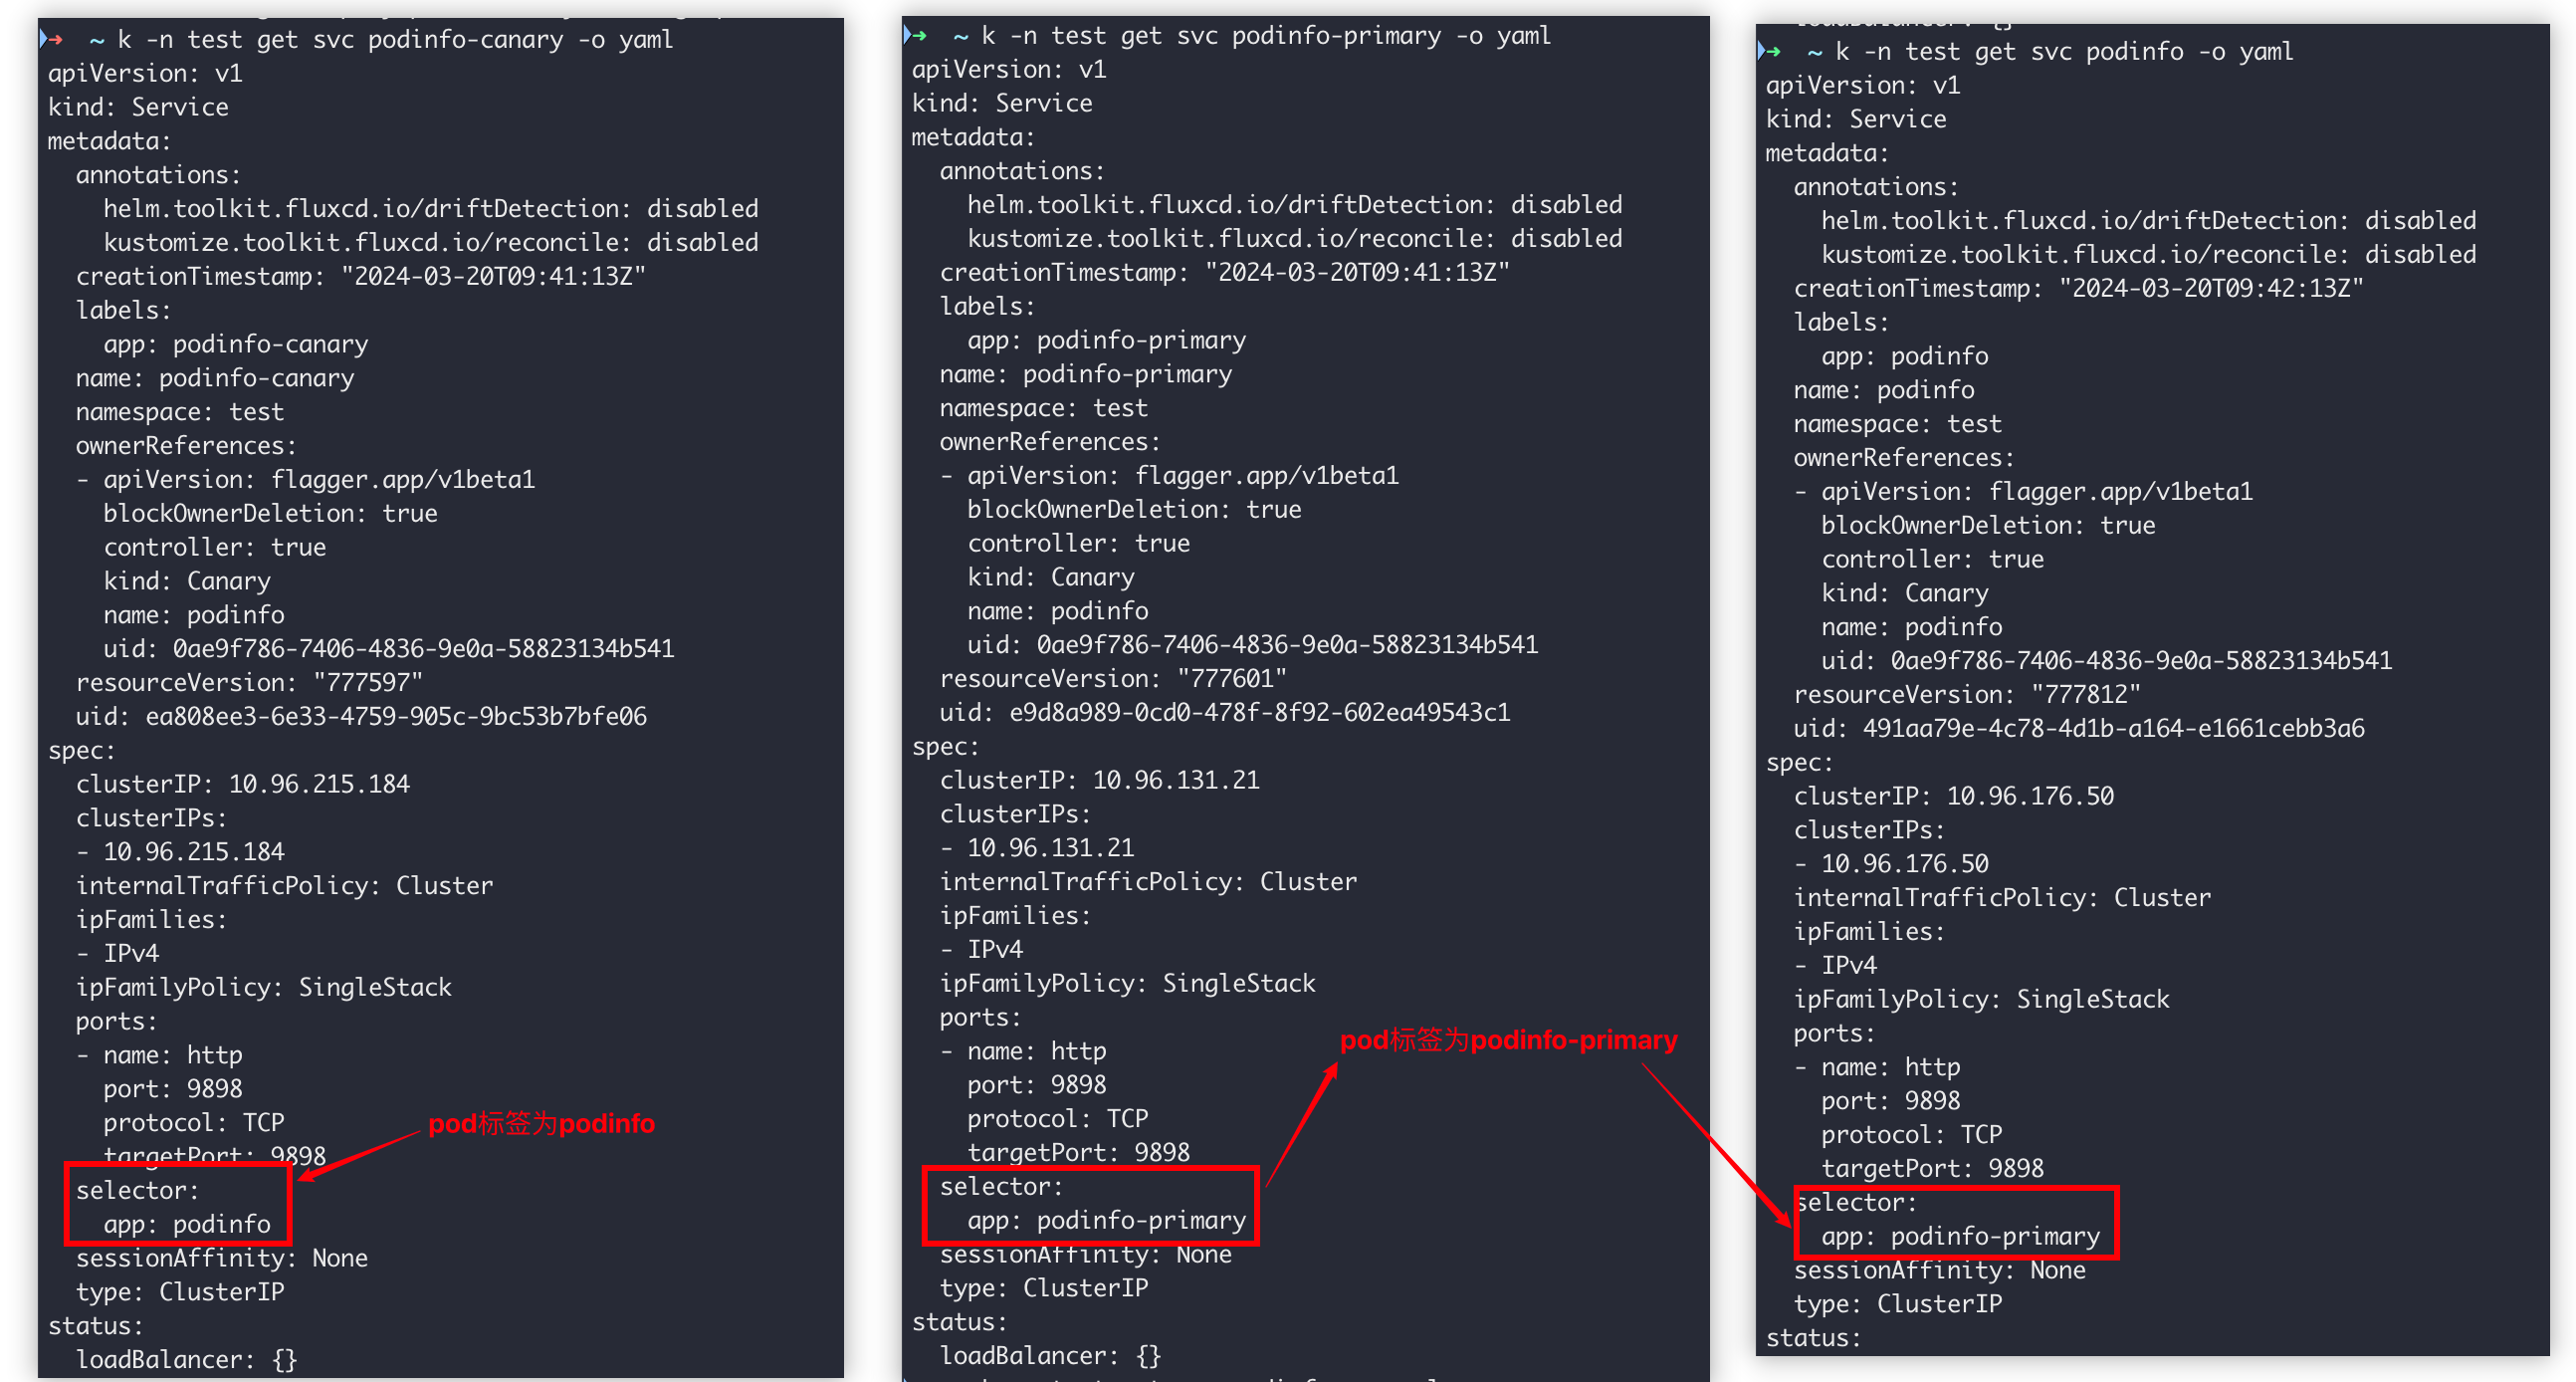
自动创建Service
各Service关键差异如下:
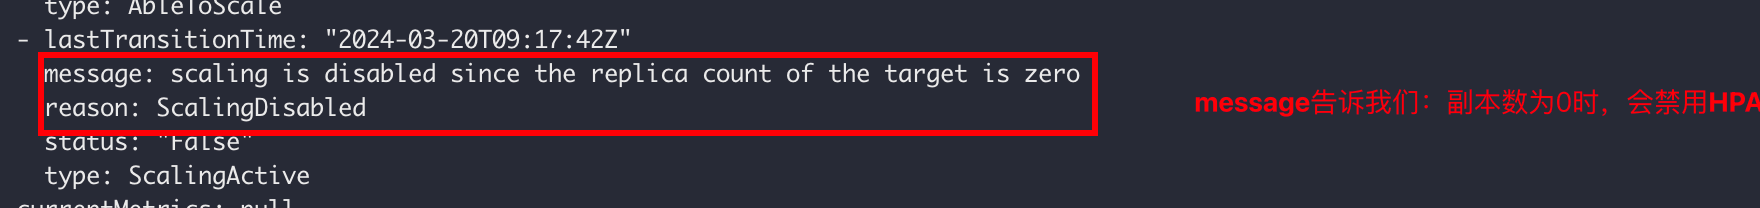
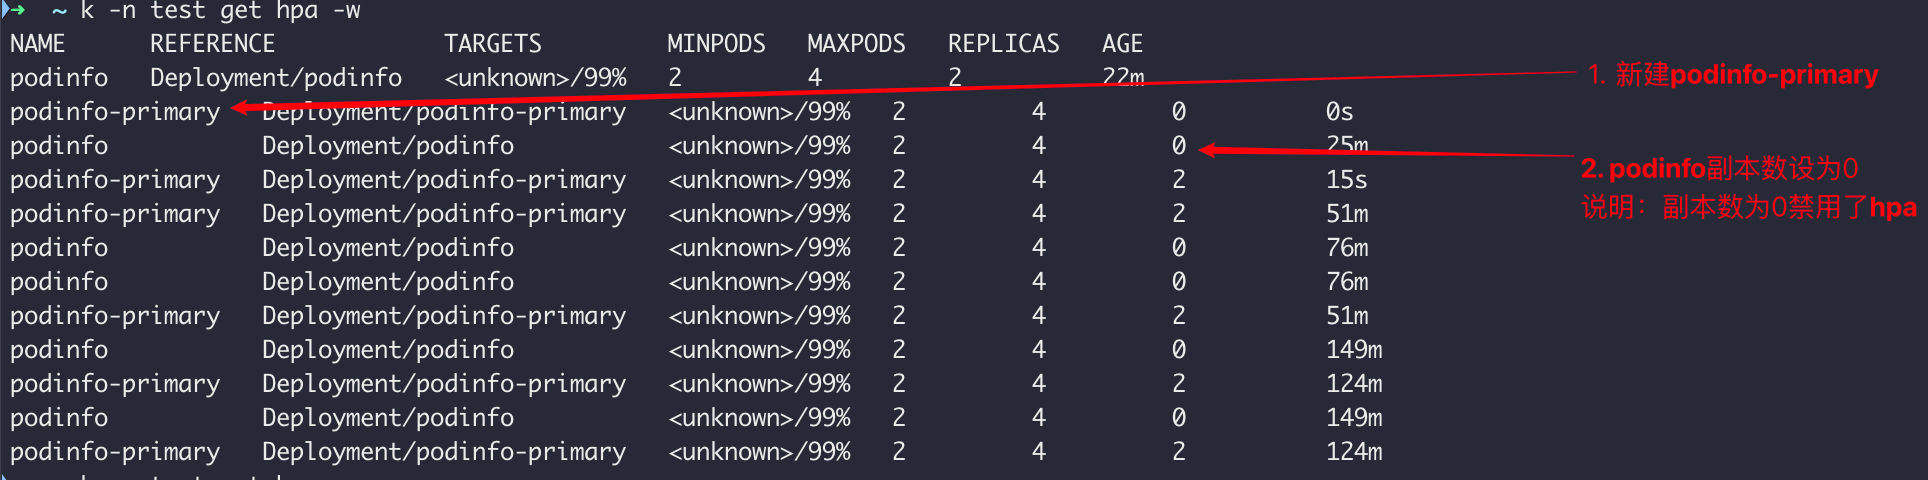
自动创建和更新HPA
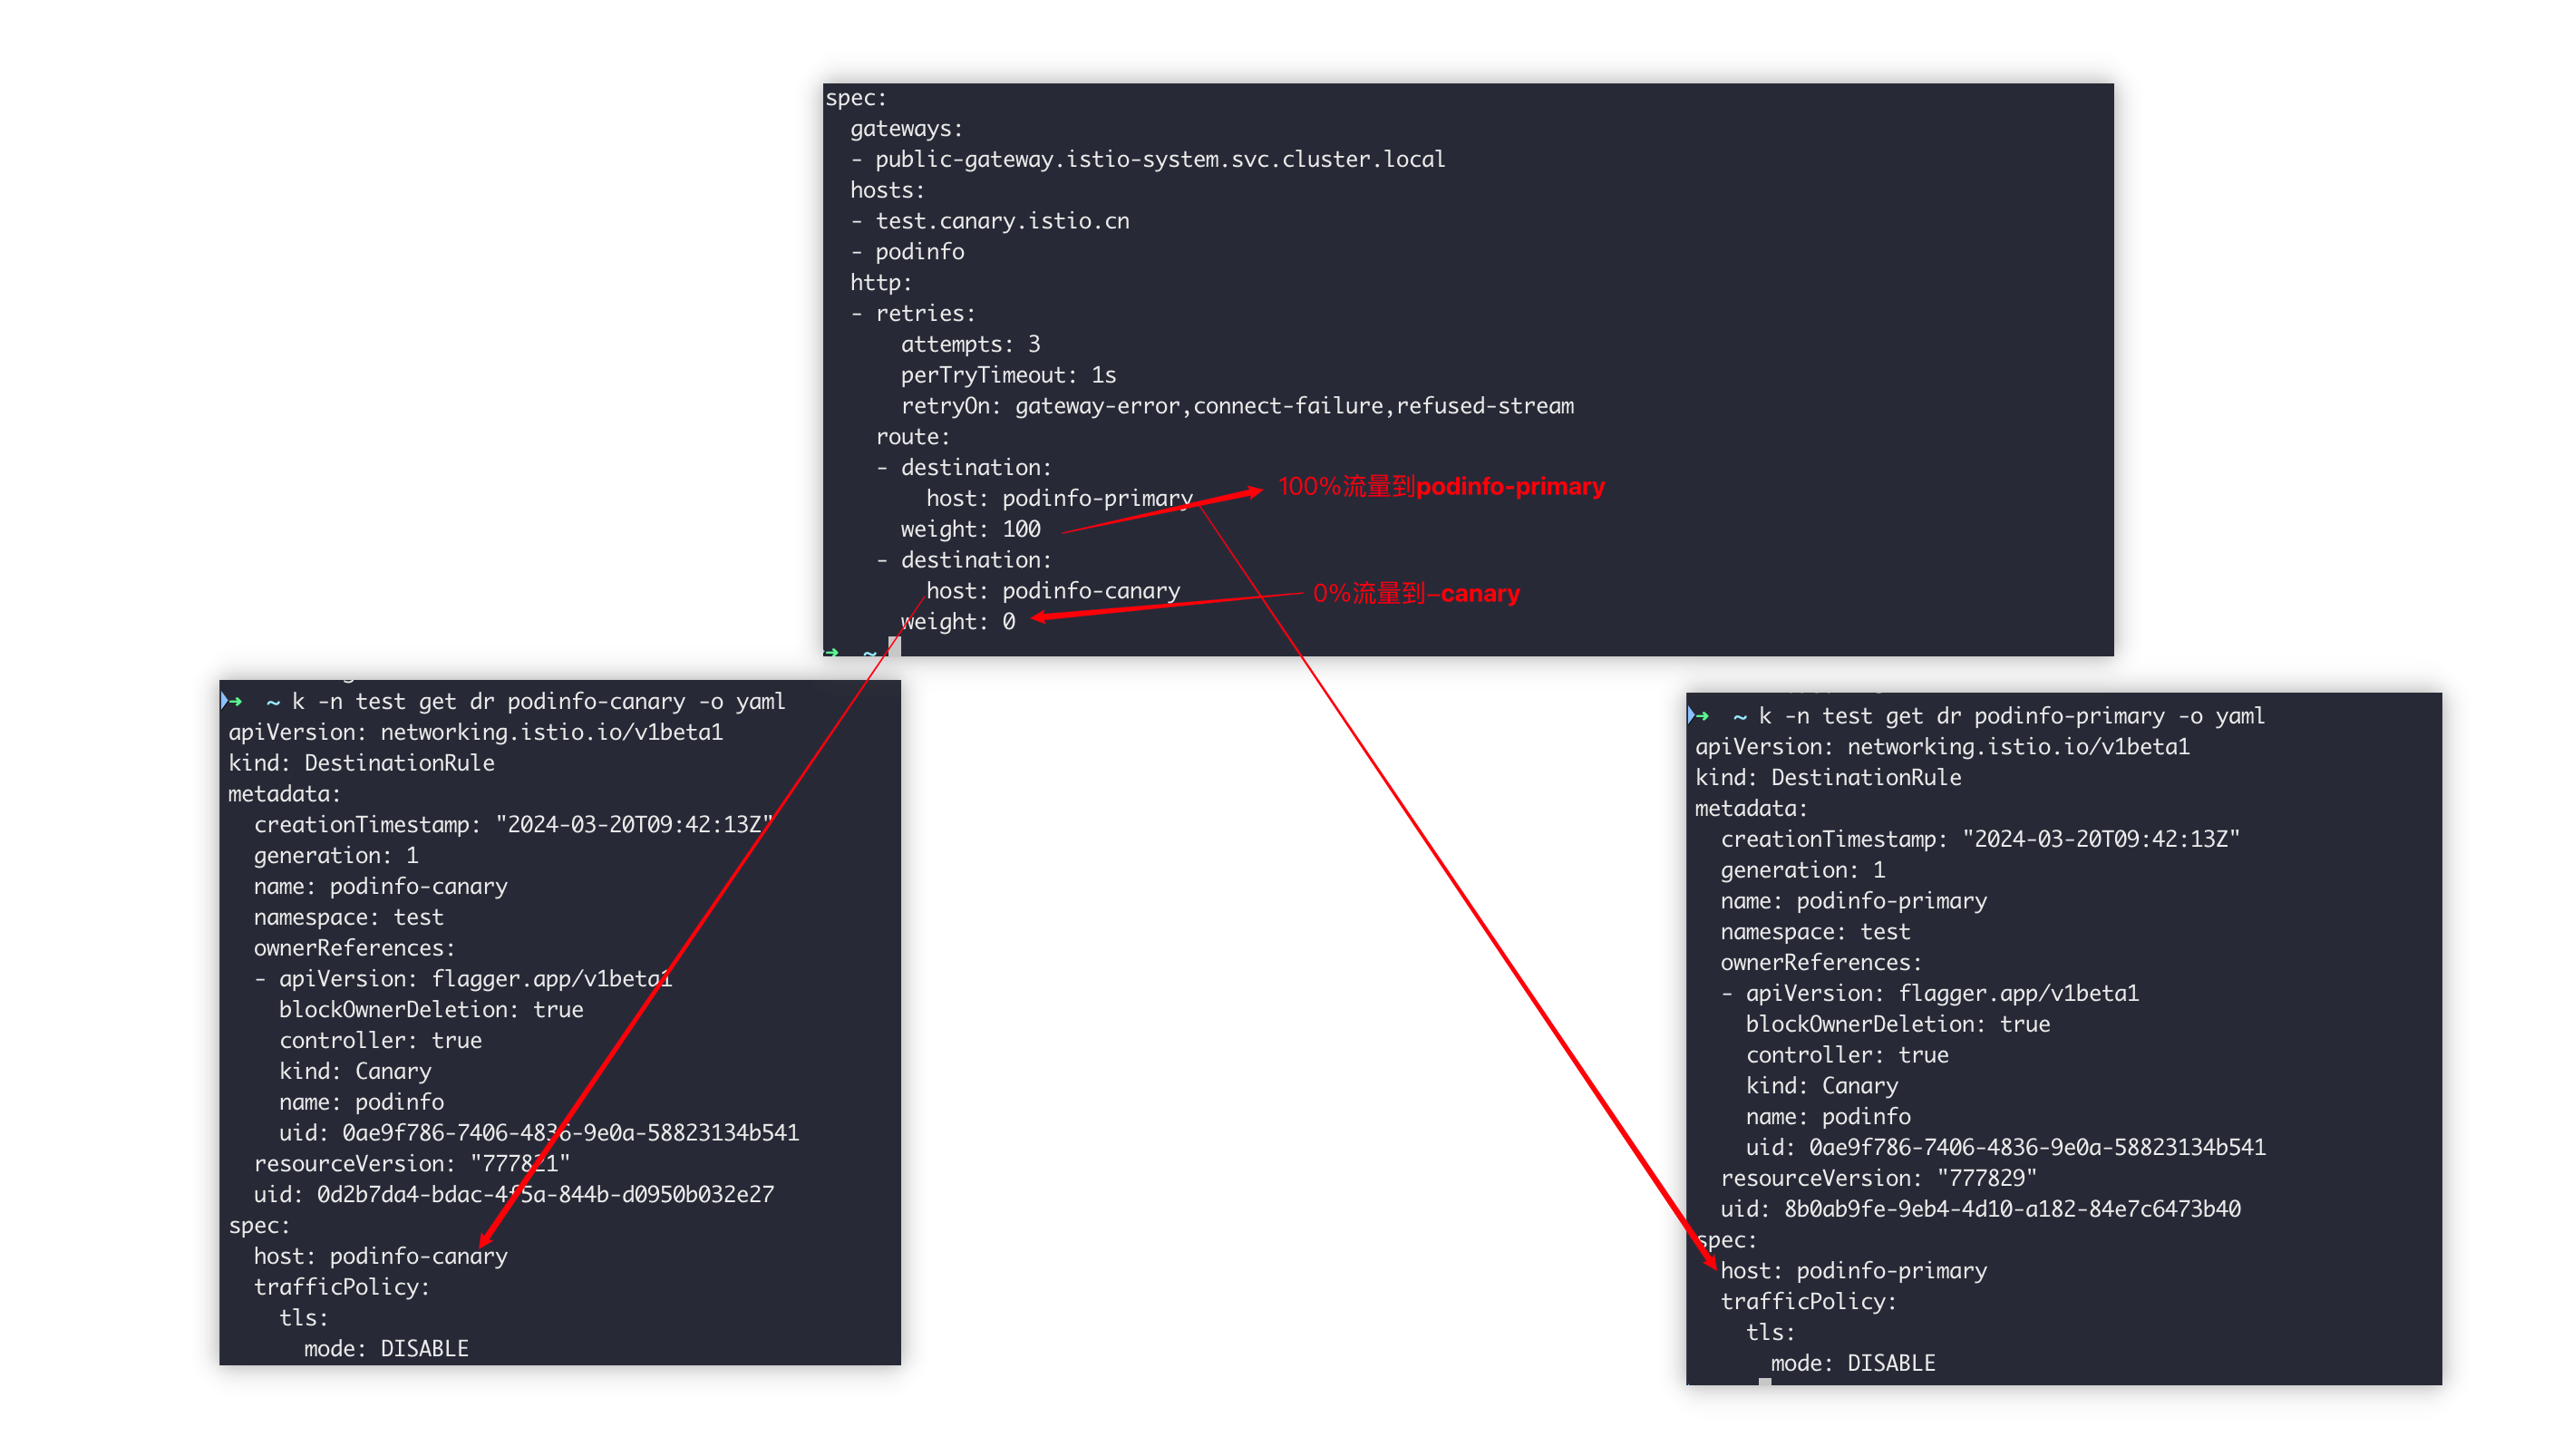
自动创建VS(VirtualService)和DR(DestinationRule)
创建VS

创建DR
流量控制:流量100%到podinfo-primary(对应自动创建的Service podinfo-primary)
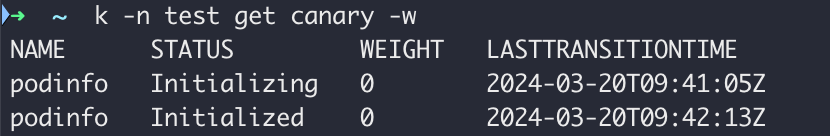
Canary 状态变化
【案例1】验证金丝雀发布
注意:如果您在金丝雀分析期间对部署应用新的更改,Flagger将重新启动分析。
金丝雀部署由以下任何对象的更改触发:
- 部署 PodSpec(容器镜像、命令、端口、环境、资源等)
- ConfigMap 作为卷安装或映射到环境变量
- 作为卷安装或映射到环境变量的秘密
变化资源有:Canary(状态数据)、Deployment、VS
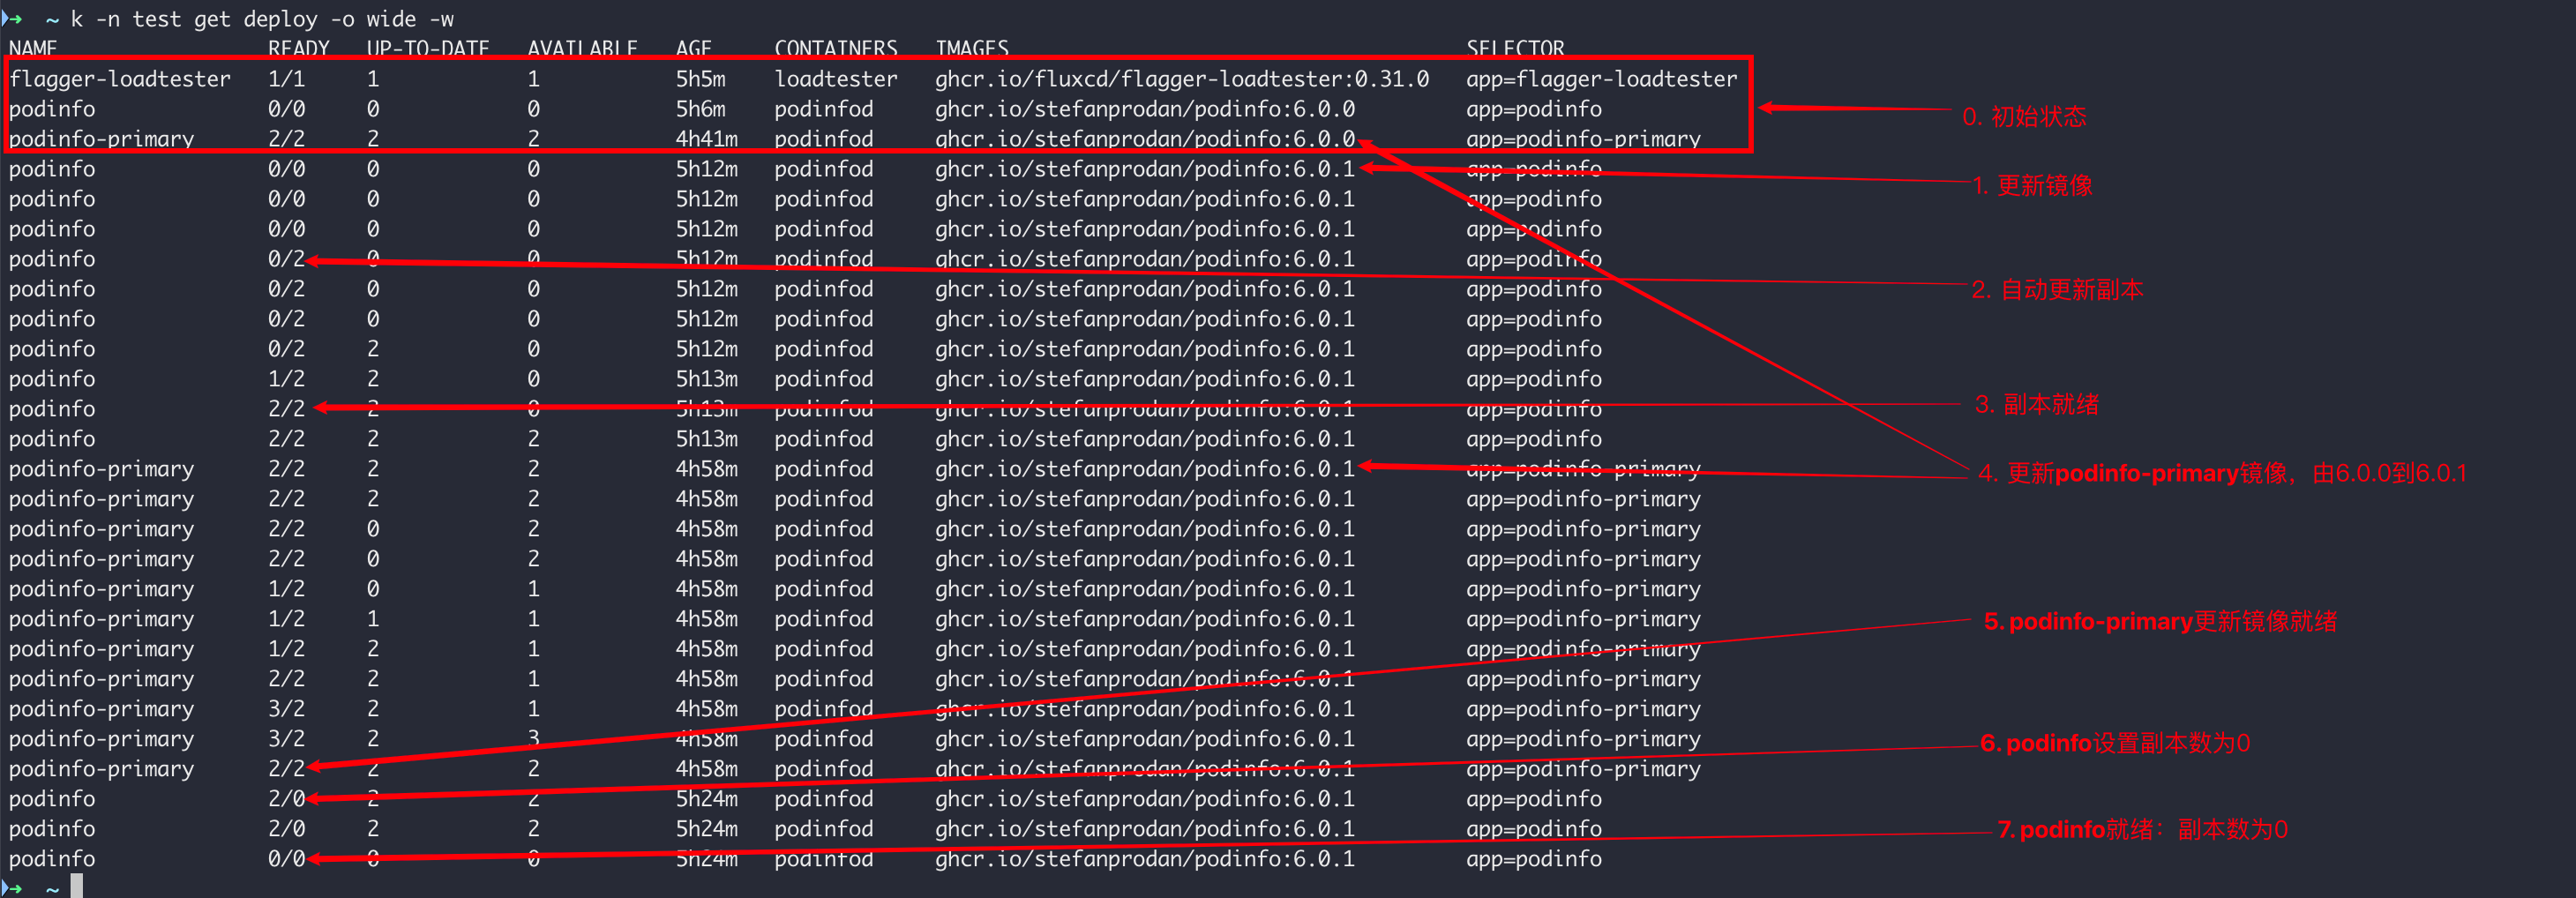
步骤1:更新容器镜像触发
kubectl -n test set image deployment/podinfo podinfod=ghcr.io/stefanprodan/podinfo:6.0.1
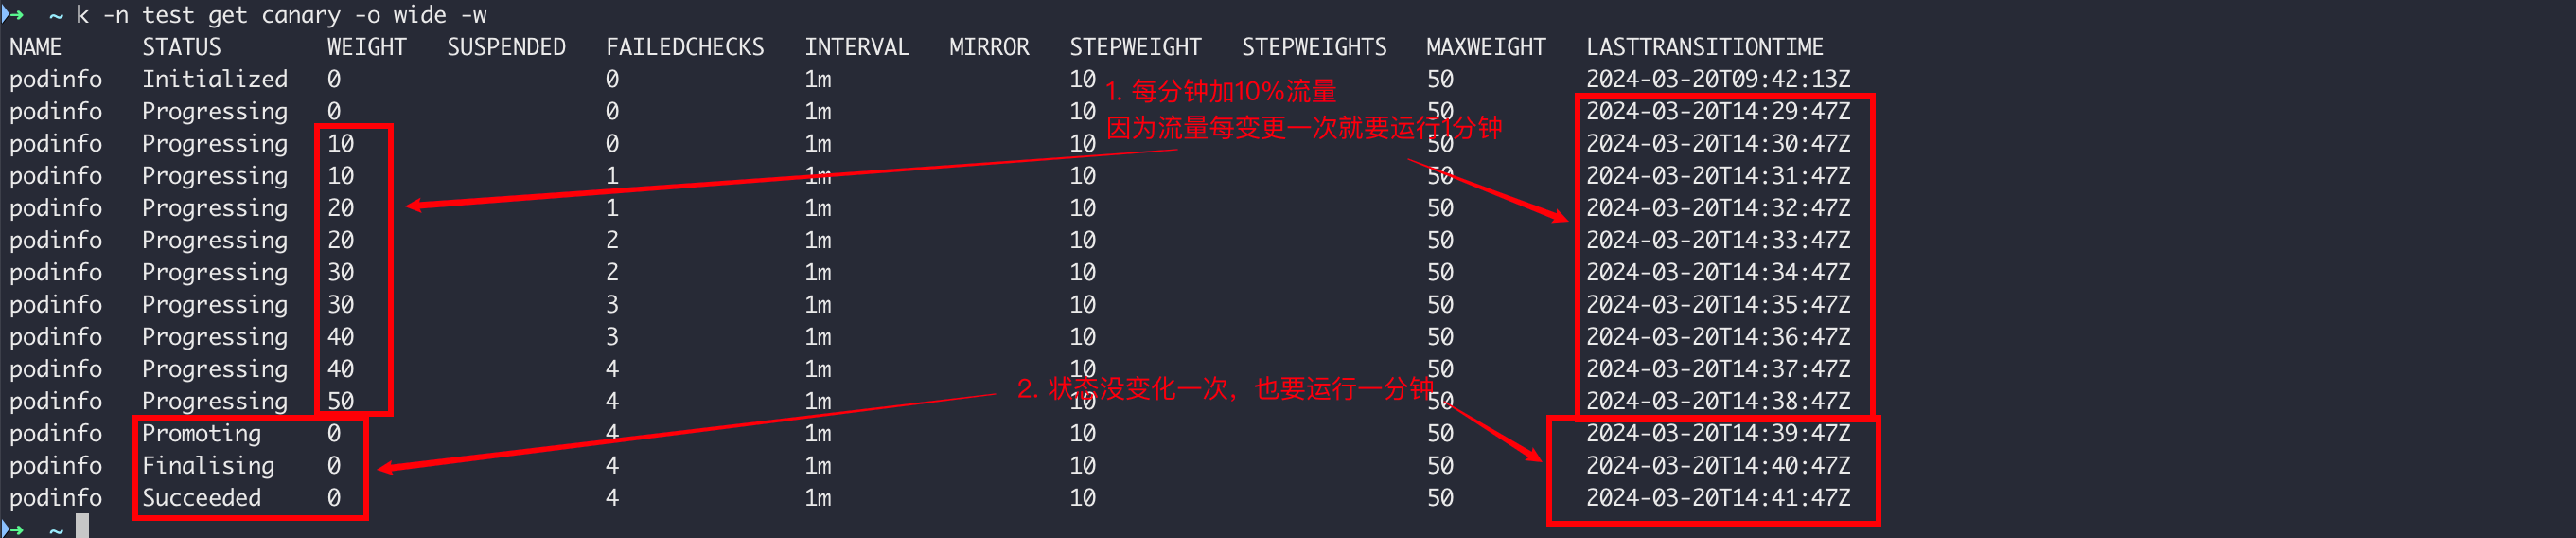
步骤2:查看Canary状态变化
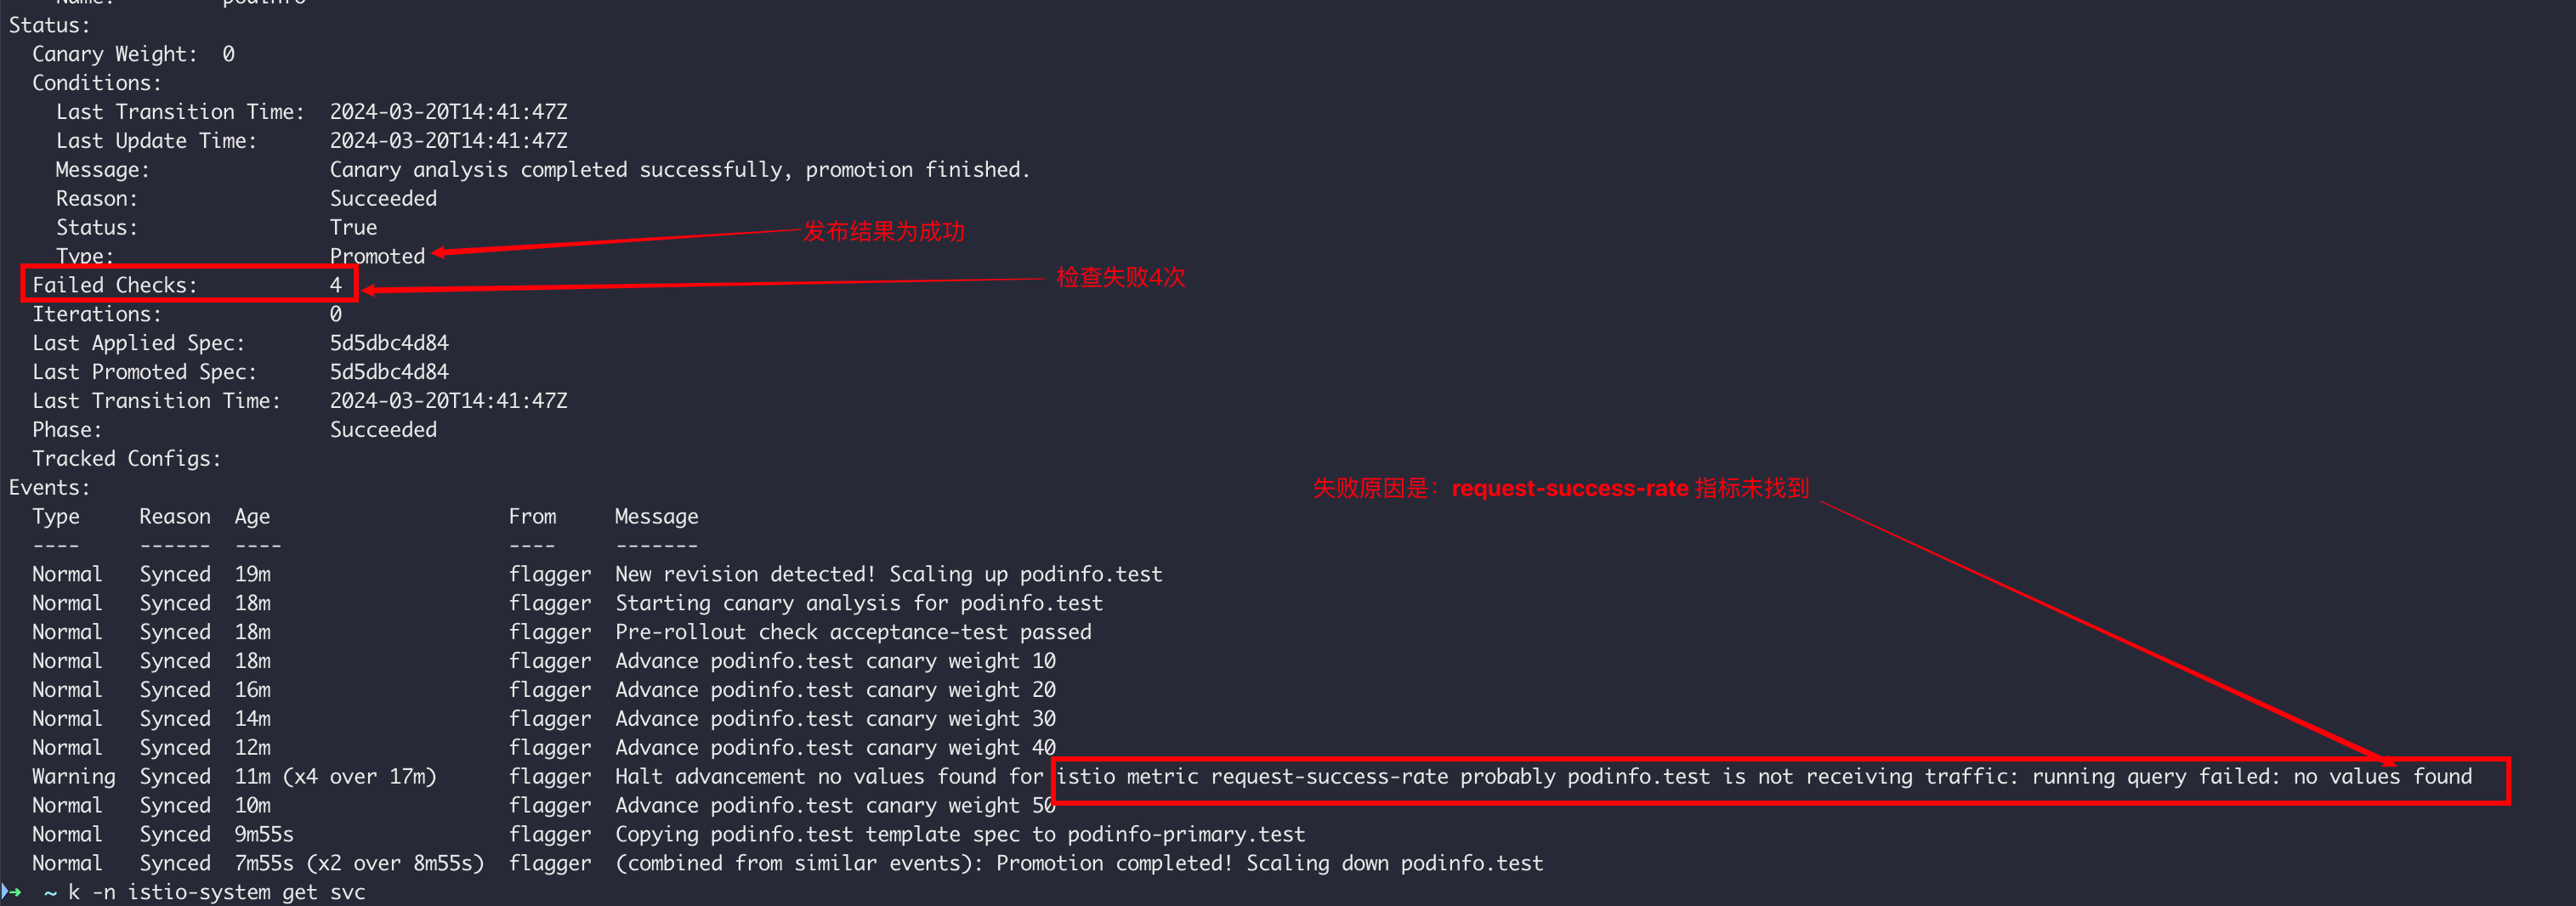
问题1:为什么检查失败仍然发版成功?因为检查失败了4次(未达到5次),Canary配置如下:
步骤3:查看Deployment变化
步骤4:查看VS变化
灰度流量每次增加10%

步骤5:查看Flagger日志
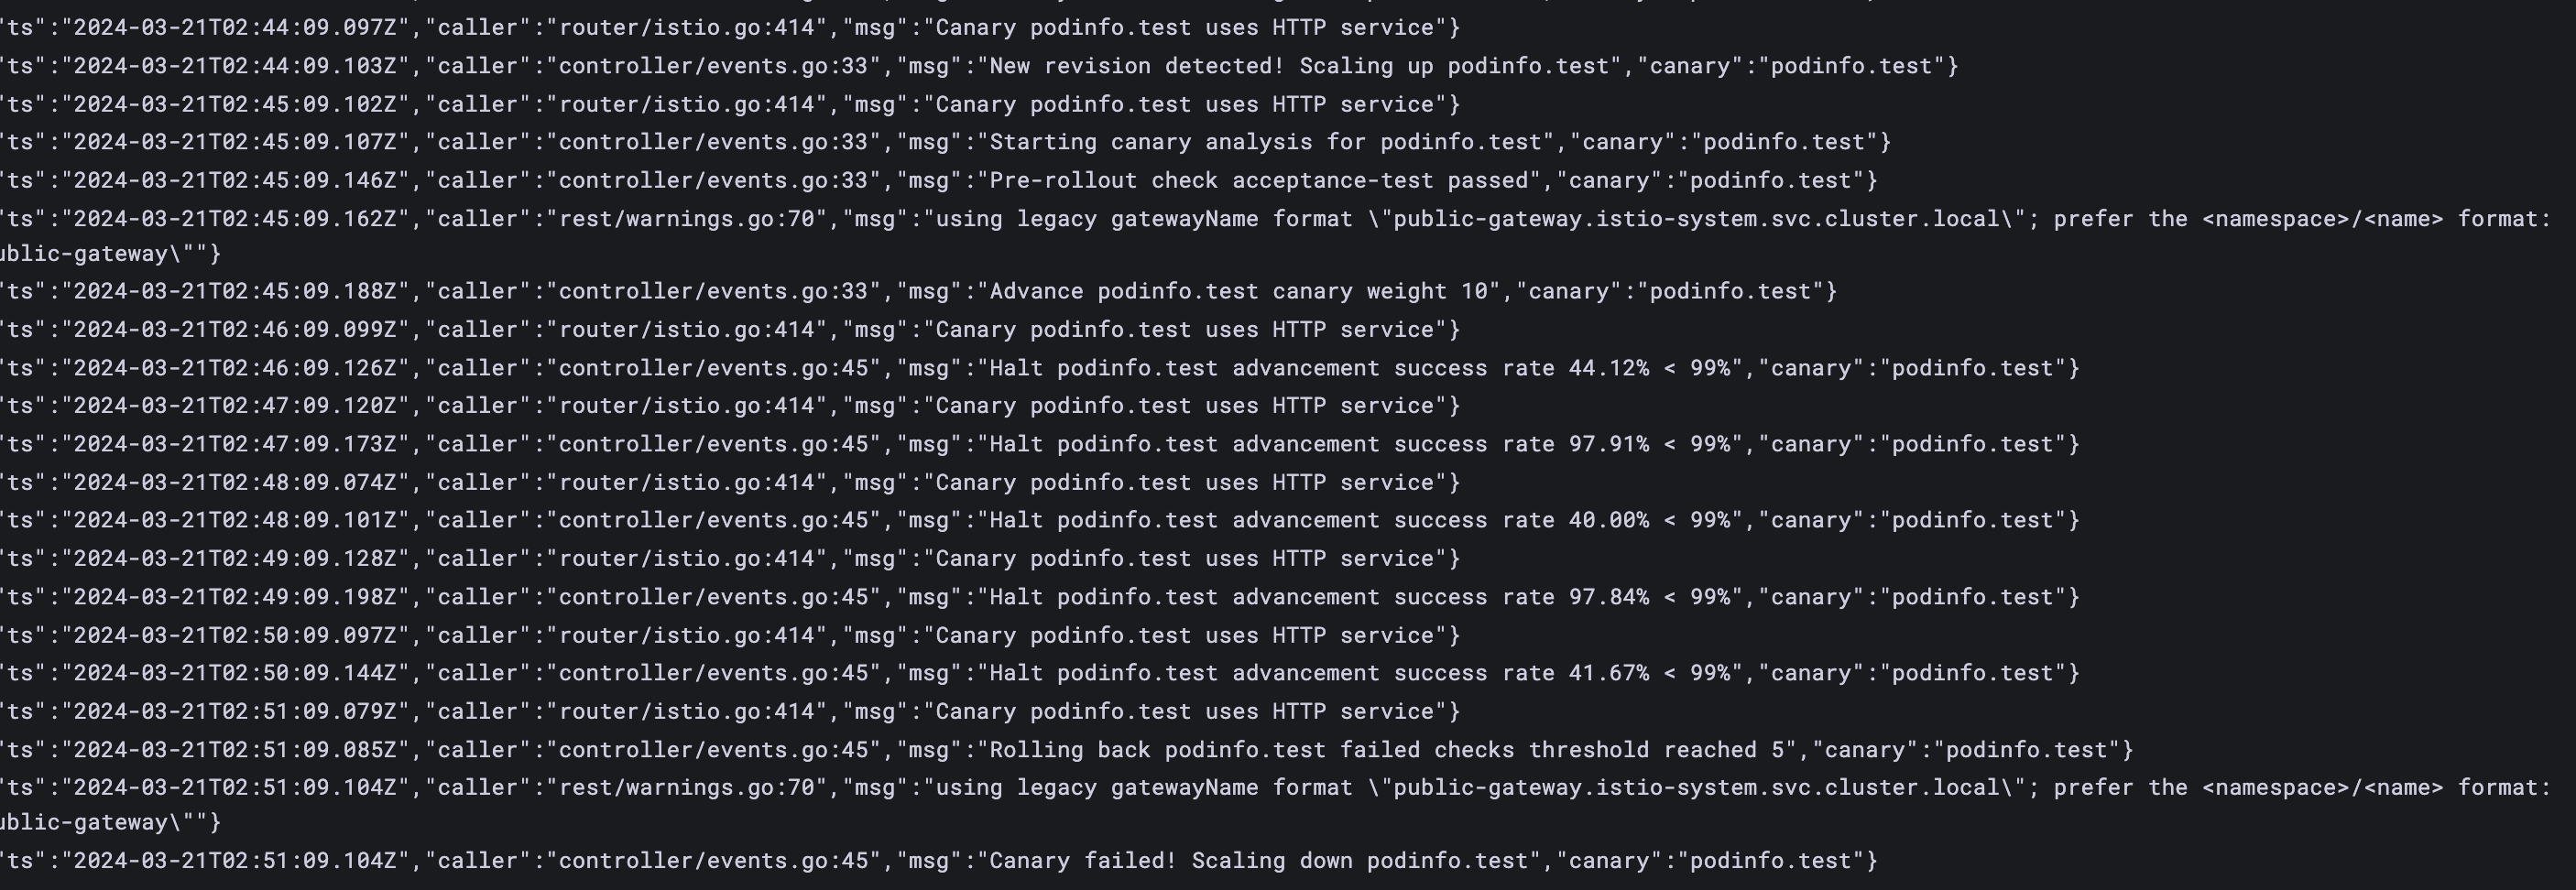
【案例2】验证自动回滚
验证方法:模拟HTTP 500错误和高延迟,观察Flagger是否暂停推出
观察方法:通过日志和canary事件
步骤1:更新镜像
kubectl -n test set image deployment/podinfo podinfod=ghcr.io/stefanprodan/podinfo:6.0.2
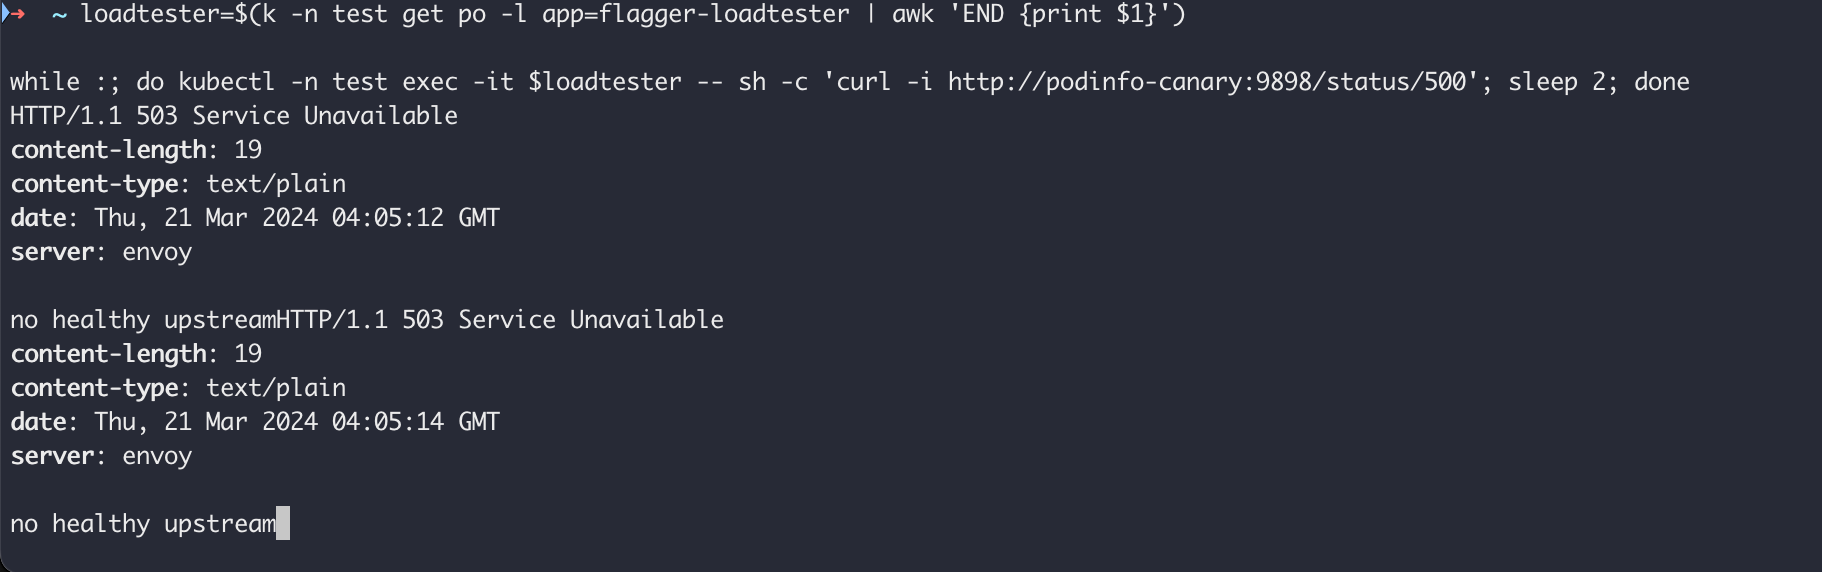
步骤2:模拟HTTP 500 错误,每2秒调用一次
loadtester=$(k -n test get po -l app=flagger-loadtester | awk 'END {print $1}')

while :; do kubectl -n test exec -it $loadtester -- sh -c 'curl -i http://podinfo-canary:9898/status/500'; sleep 2; done
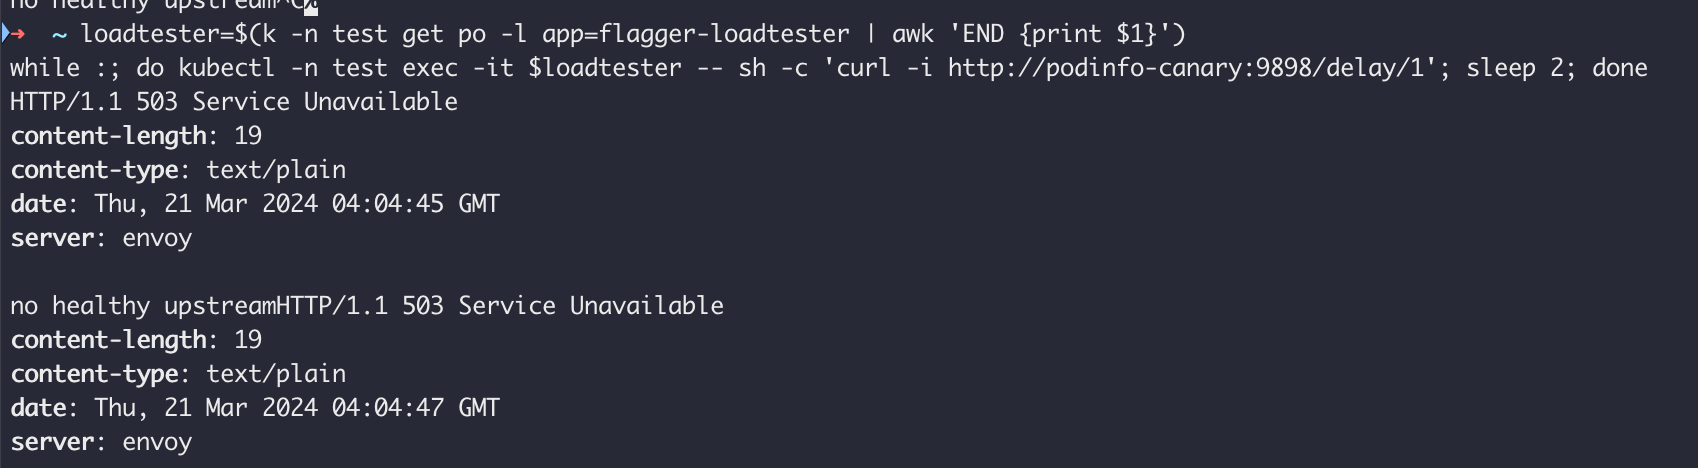
步骤3:模拟高延迟,每2秒调用一次
loadtester=$(k -n test get po -l app=flagger-loadtester | awk 'END {print $1}')
while :; do kubectl -n test exec -it $loadtester -- sh -c 'curl -i http://podinfo-canary:9898/delay/1'; sleep 2; done
步骤4:查看Canary事件

步骤5:查看日志
附录
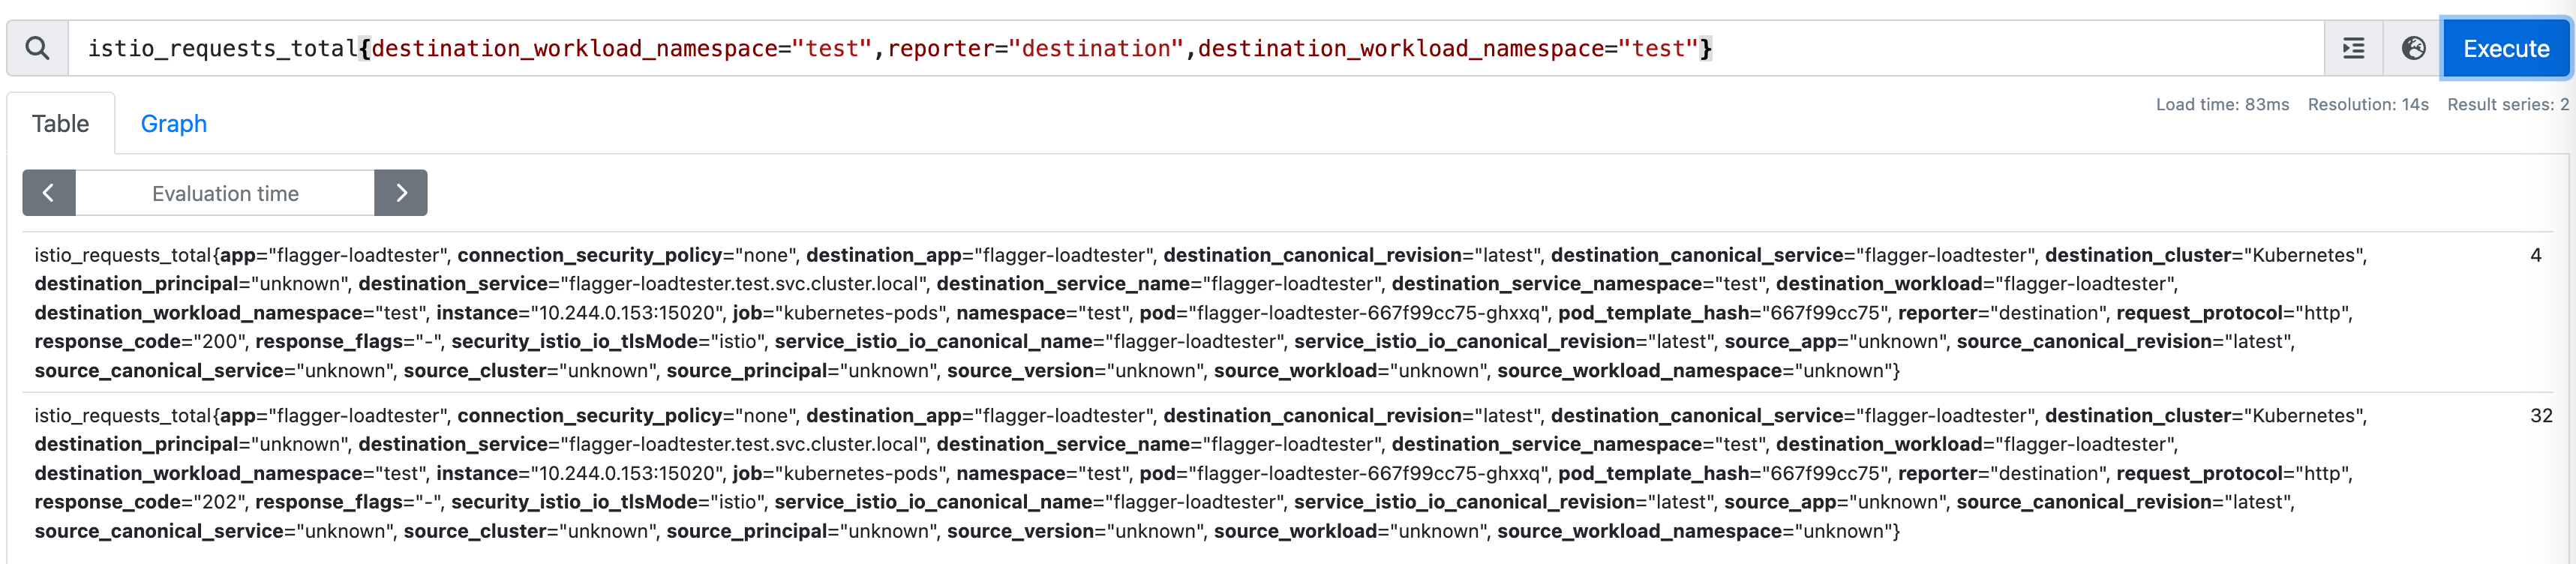
【Istio】内置指标:request-success-rate
代码位置:https://github.com/fluxcd/flagger/blob/main/pkg/metrics/observers/istio.go#L29
promql模板(gotemplate):
sum(
		rate(
			istio_requests_total{
				reporter="destination",
				destination_workload_namespace="{{ namespace }}",
				destination_workload=~"{{ target }}",
				response_code!~"5.*"
			}[{{ interval }}]
		)
	)
	/
	sum(
		rate(
			istio_requests_total{
				reporter="destination",
				destination_workload_namespace="{{ namespace }}",
				destination_workload=~"{{ target }}"
			}[{{ interval }}]
		)
	)
	* 100
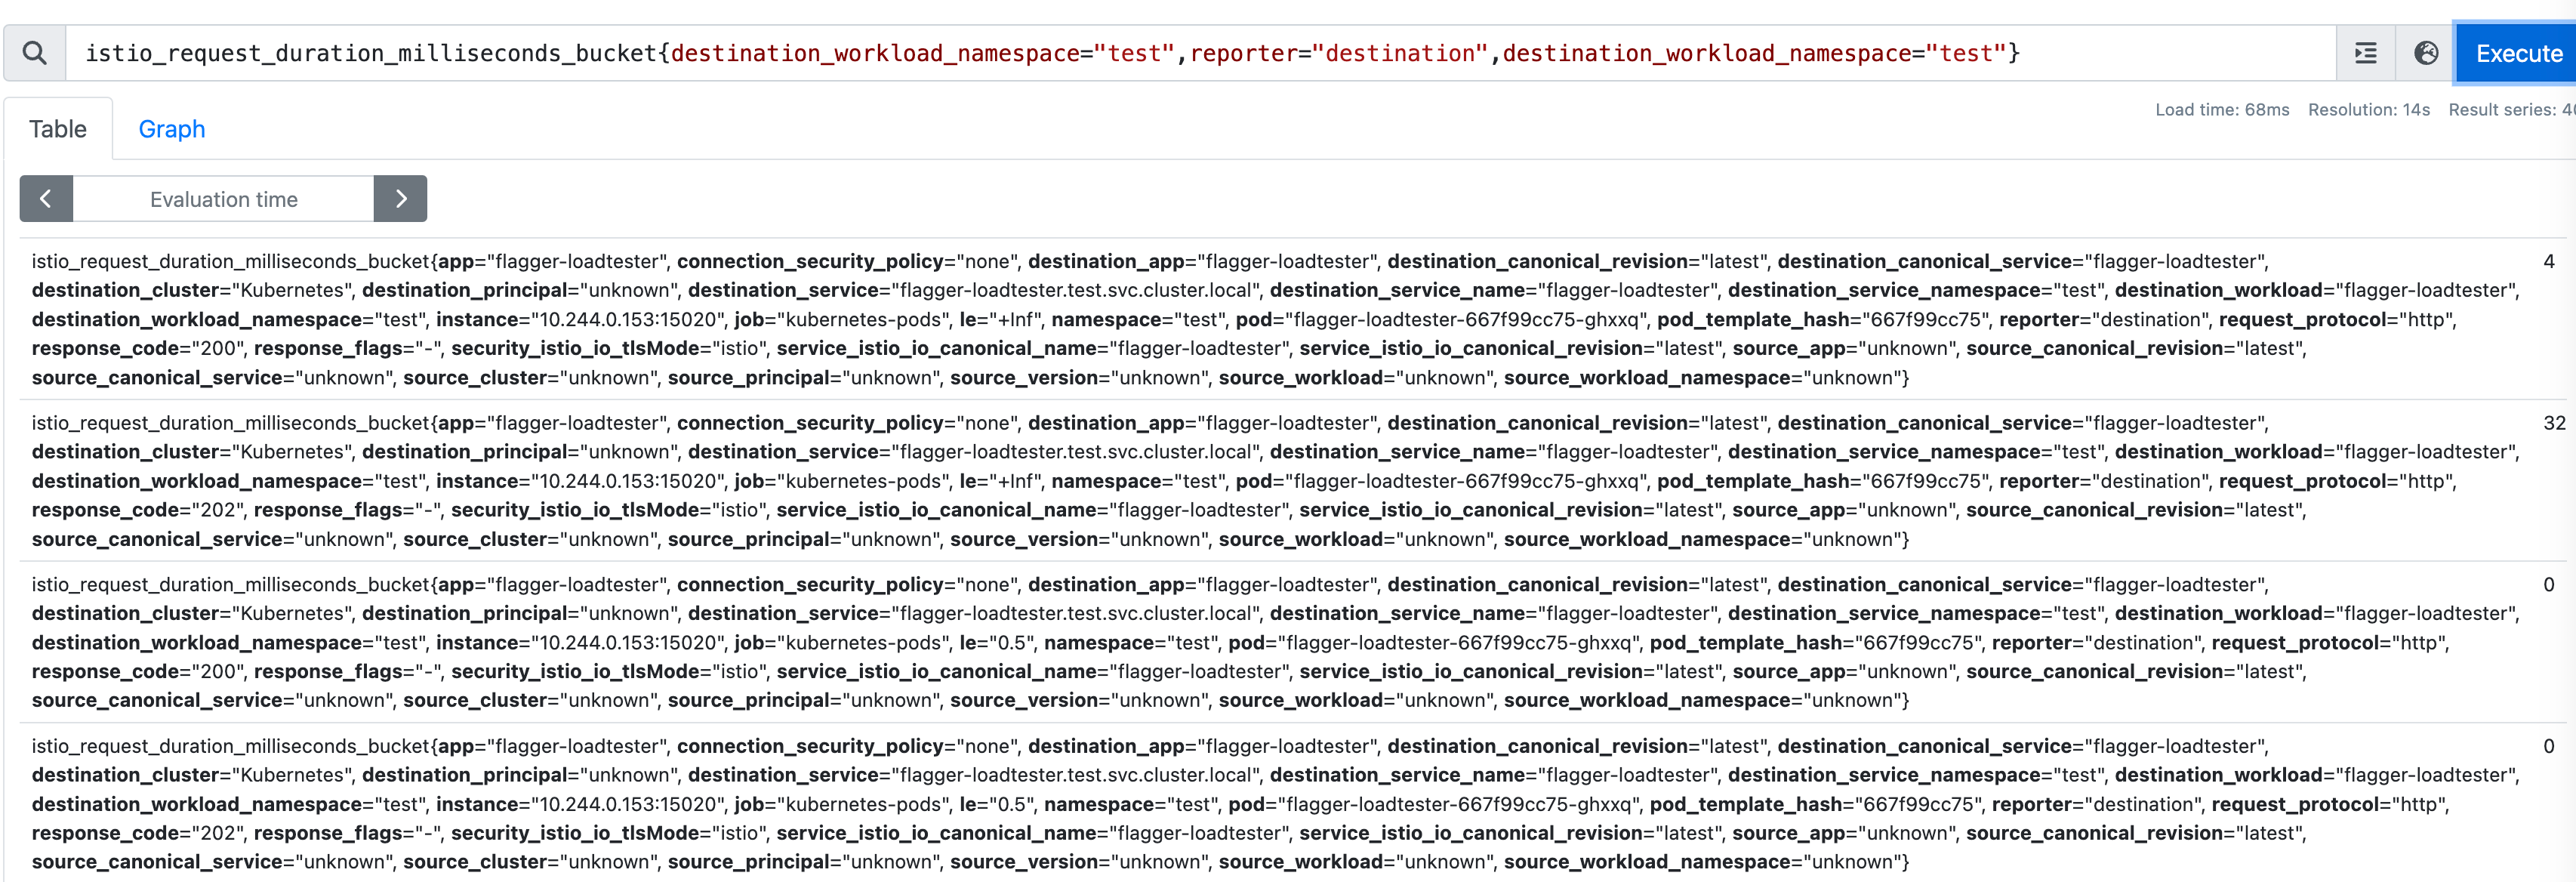
【Istio】内置指标:request-duration
代码位置:https://github.com/fluxcd/flagger/blob/main/pkg/metrics/observers/istio.go#L51
promql模板(gotemplate):
histogram_quantile(
		0.99,
		sum(
			rate(
				istio_request_duration_milliseconds_bucket{
					reporter="destination",
					destination_workload_namespace="{{ namespace }}",
					destination_workload=~"{{ target }}"
				}[{{ interval }}]
			)
		) by (le)
	)
结语
本文全面解答了应用Flagger和Istio的所有疑问,若您还遇到了其它问题和诉求,请留言告知🙏。
todo:即将输出自动化金丝雀部署的
会话亲和性、镜像流量、A/B测试案例。

请用微信扫码关注下🙏 ,持续更新云原生DevOps最佳实践。


 4万+
4万+


 被折叠的 条评论
为什么被折叠?
被折叠的 条评论
为什么被折叠?
 到【灌水乐园】发言


